SSRS Financial Reports to Power BI: Before & After Examples
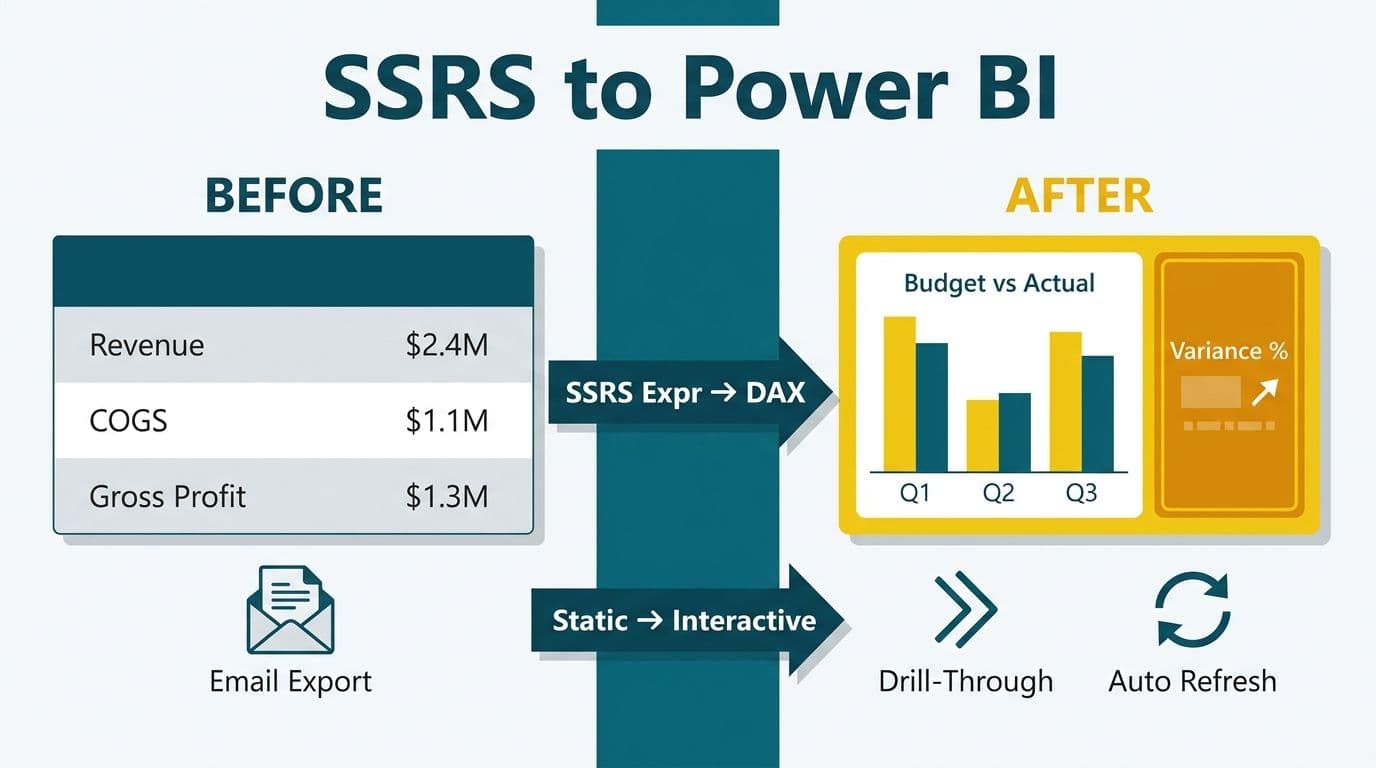
Finance teams replace SSRS financial reports in Power BI by rebuilding P&L statements, budget variance trackers, and period-close packages as interactive dashboards backed by semantic models. The core translation work converts SSRS expressions to DAX, replaces pixel-perfect layouts with drill-through visuals, and substitutes email subscriptions with automated refresh and sharing through the Power BI service.
Key Takeaways
- Power BI interactive dashboards replace static SSRS P&L, budget variance, and period-close reports while preserving audit-trail accuracy.
- SSRS expressions translate to DAX measures; the logic is equivalent but the syntax and filter context differ significantly.
- Power BI paginated reports handle pixel-perfect PDF output for regulatory filings; interactive reports handle self-service drill-through analysis.
- Report subscriptions in SSRS map to Power BI service subscriptions or Power Automate flows, preserving scheduled delivery workflows.
- A mid-market SSRS to Power BI migration typically runs 8-16 weeks and covers semantic model build, DAX conversion, and user training.
What Makes SSRS Financial Reports Difficult to Modernize?
SSRS financial reports are difficult to modernize because they embed business logic directly in RDL expressions, mix presentation and calculation in the same layer, and rely on SQL Server infrastructure that few cloud-first teams still maintain. Finance teams at mid-market companies often carry dozens of reports accumulated over two decades, each hand-tuned by a developer who may no longer be available.
Three specific pain points surface consistently:
Expression sprawl: SSRS uses VB.NET-style expressions scattered across textboxes, group headers, and conditional formatting rules. These are invisible to the business user and hard to audit across a large report library.
Print-first design: SSRS was built for pixel-perfect paper output. Finance directors in the US and UK who need to interrogate variance line-by-line - drilling from summary to GL detail - cannot do that in a static PDF.
Subscription fragility: SSRS subscriptions deliver reports by email on a schedule. When the SQL Server agent fails, email delivery silently stops. Finance teams often discover a missed delivery only when the CFO asks why the Monday close report never arrived.
Moving to Power BI does not mean abandoning precision. Our Tableau to Power BI migration services covers the full platform migration methodology - the same approach applies when SSRS is the source system.
SSRS Financial Reports to Power BI Examples: P&L, Budget Variance, and Period-Close
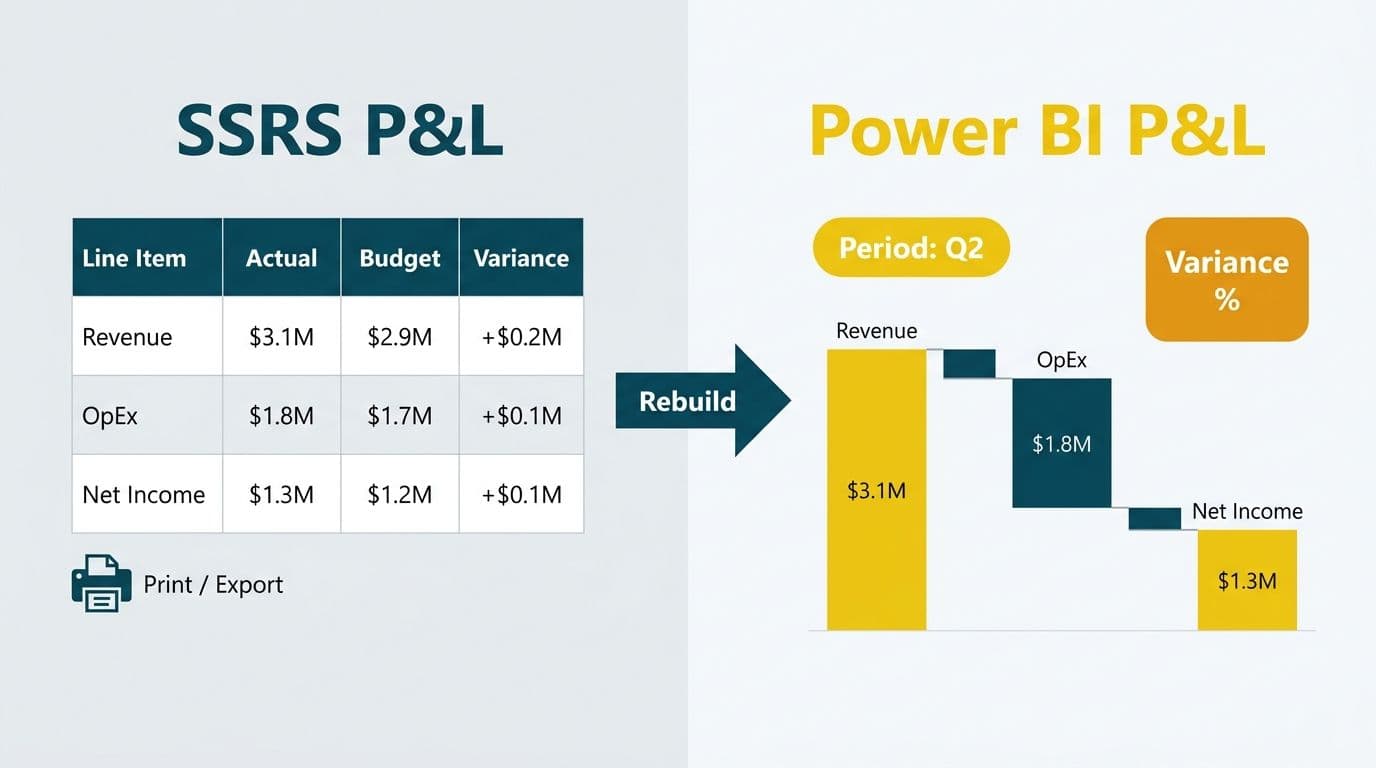
The three reports finance teams migrate most often are the Profit and Loss statement, the budget variance report, and the period-close package. Each maps to a distinct Power BI pattern.
Profit and Loss Statement
Before (SSRS): A tablix with hardcoded row groups for Revenue, Cost of Sales, Gross Profit, and Operating Expenses. Subtotals use `=Sum(Fields!Amount.Value)` grouped by account category. Drill-through opens a second RDL file.
After (Power BI interactive): A matrix visual backed by a semantic model with `NetRevenue`, `COGS`, `GrossMargin`, and `OpEx` measures. Row-level security (RLS) restricts Canadian subsidiaries to their own legal entity without maintaining a separate report version - an important simplification for organizations subject to PIPEDA data residency requirements. The drill-through page is a native Power BI page, not a second file stored on the report server.
Budget Variance Report
Before (SSRS): Side-by-side columns for Actual, Budget, and Variance, calculated as `=Fields!Actual.Value - Fields!Budget.Value`. Conditional formatting highlights negative variance in red using an IIF expression. The report is emailed every Monday morning.
After (Power BI): A bar-and-line combo chart shows Actual vs Budget by week. A DAX measure handles variance: `Variance = [Actual Amount] - [Budget Amount]`. Conditional formatting uses a `VAR` block to return color codes dynamically. The Monday email is replaced by a Power BI subscription that sends a PDF snapshot on the same schedule - same cadence, no SQL Server agent dependency.
Suppose a US healthcare system's finance team runs this report across 40 cost centers. In SSRS, each cost center director receives a separate emailed PDF with a hardcoded filter. In Power BI, a single report with RLS delivers the right slice to each director on login - reducing subscription management from 40 individual edits to one role table update. The same RLS framework can enforce HIPAA-aligned data separation by department or provider group.
Period-Close Package
Before (SSRS): A multi-page RDL or a suite of linked RDLs - balance sheet, income statement, cash flow, and variance commentary - exported as one PDF and emailed to the board.
After (Power BI): A Power BI paginated report in .rdl format (rendered by paginated reports in Premium or Fabric capacity) replicates the pixel-perfect layout required for board packs and regulatory filings. The data source switches from a local SQL Server to a shared Power BI semantic model, so the paginated report and the interactive dashboard always reflect the same verified numbers. UK fintech firms subject to FCA reporting requirements often choose the paginated path for its document-level audit trail - without maintaining a separate SSRS server.
A practical note on data volume: Power BI's default visual export caps at 30,000 rows. Teams that need full transactional datasets behind a report should connect directly to the Analysis Services engine underneath the semantic model to bypass that visual-layer limit.
SSRS vs Power BI Paginated Reports: Which Format Should Finance Teams Choose?
Power BI offers two distinct report types, and choosing the wrong one is the most common mistake in an SSRS migration. The table below maps SSRS capabilities to their Power BI equivalent.
| Capability | SSRS | Power BI Interactive | Power BI Paginated |
|---|---|---|---|
| Pixel-perfect PDF output | Yes | No | Yes |
| Multi-page financial statements | Yes | No | Yes |
| Drill-through and cross-filter | Limited | Yes | Limited |
| Self-service field selection | No | Yes | No |
| RDL file format compatibility | Yes | No | Yes |
| Data-driven subscriptions | Yes | Partial (Premium) | Yes (Premium/Fabric) |
| Handles 1M+ row detail exports | Yes | No | Yes |
| Mobile-optimized layout | No | Yes | No |
The right answer for most finance teams: use Power BI paginated reports for regulatory filings, board packs, and any output that must print identically on every run. Use Power BI interactive reports for day-to-day variance analysis and executive dashboards. The two formats coexist in the same Power BI workspace and share the same semantic model - no data duplication required.
One licensing note: Power BI paginated reports require Power BI Premium Per User (PPU), Premium capacity, or a Microsoft Fabric capacity. Organizations still on standard Pro licenses should factor this into their migration plan before committing to the paginated approach for period-close packages.
For Canadian manufacturing companies filing PIPEDA-regulated reports or US healthcare organizations producing HIPAA-compliant financial summaries, the paginated path provides the document-level output auditors expect. UK and EU teams can apply GDPR-compliant sensitivity labels at the workspace level to control who can download or share exported PDFs.
How Do You Translate SSRS Expressions to DAX in Power BI?
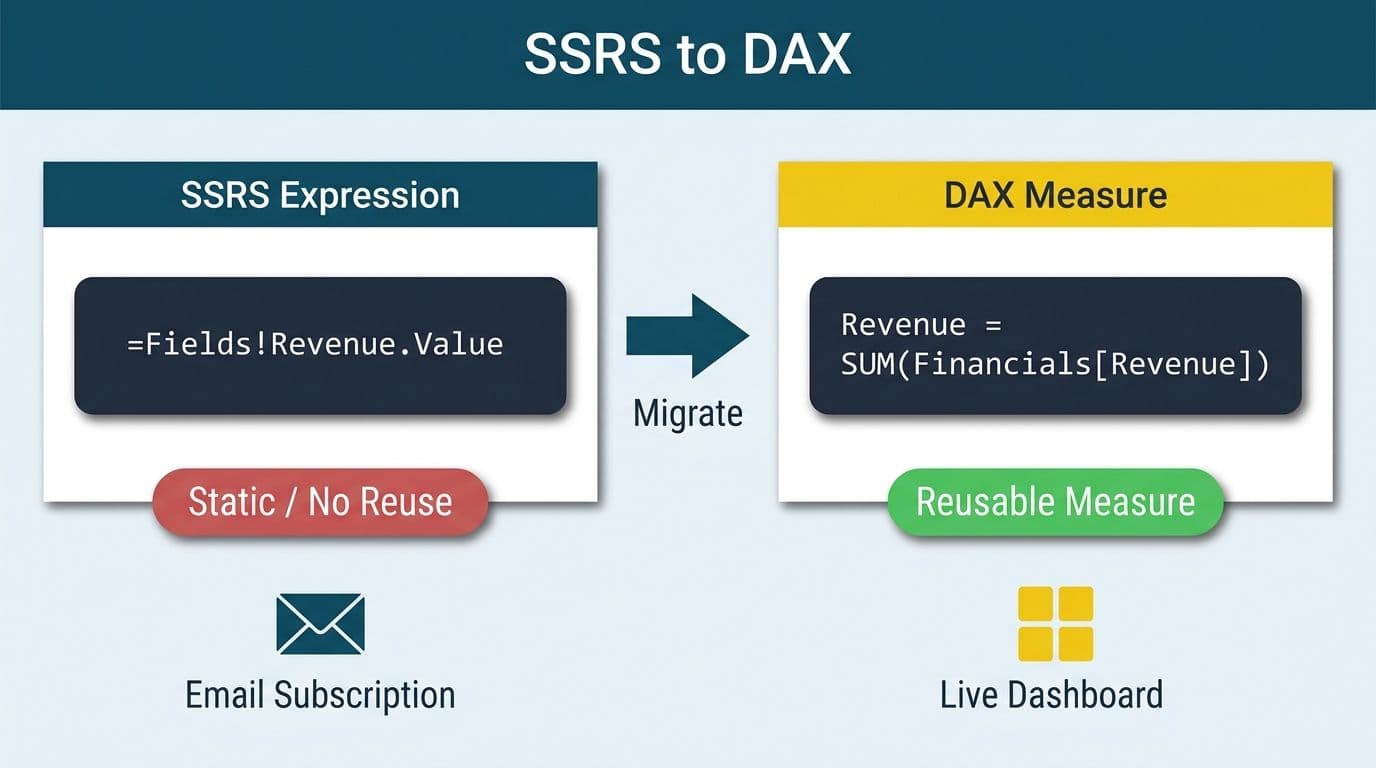
The core principle of any SSRS expressions to DAX translation guide: never paste an SSRS expression directly into a DAX measure. SSRS expressions evaluate row-by-row within a dataset; DAX evaluates in filter context against a compressed column store. The same business rule requires different code in each system.
| SSRS Expression | DAX Equivalent |
|---|---|
| `=Sum(Fields!Revenue.Value)` | `Total Revenue = SUM(Fact[Revenue])` |
| `=Fields!Actual.Value - Fields!Budget.Value` | `Variance = [Actual] - [Budget]` |
| `=RunningValue(Fields!Amount.Value, Sum, "DS1")` | `CALCULATE([Amount], FILTER(ALLSELECTED(Date[Date]), Date[Date] <= MAX(Date[Date])))` |
| `=IIF(Fields!Variance.Value < 0, "Red", "Green")` | `IF([Variance] < 0, "#FF0000", "#00AA00")` |
| `=DateDiff("m", Fields!StartDate.Value, Today())` | `DATEDIFF(Table[StartDate], TODAY(), MONTH)` |
| Prior-period comparison | `CALCULATE([Amount], DATEADD(Date[Date], -1, MONTH))` |
Running totals are the hardest translation. In SSRS, a running total relies on dataset row order; in DAX, the equivalent uses `ALLSELECTED` on a date table to respect slicer context set by the end user. Period comparisons in SSRS use VB.NET date functions; in DAX, `DATEADD`, `SAMEPERIODLASTYEAR`, and `DATESYTD` cover the common financial time-intelligence patterns needed for YTD, QTD, and prior-year comparisons.
For teams navigating a Tableau background alongside this migration work, the Power BI skills map for Tableau users covers the broader mental model shift that applies to both transitions.
How Do You Replace SSRS Report Subscriptions in Power BI?
SSRS subscriptions deliver scheduled PDFs or data files to distribution lists. Power BI replaces this through three mechanisms depending on the use case.
Standard subscriptions: Any report owner in the Power BI service can configure email subscriptions that deliver a PDF snapshot or a report link on a daily, weekly, or post-refresh schedule. This covers the majority of SSRS subscription use cases - Monday close reports, weekly variance summaries, and monthly board pack delivery.
Data-driven subscriptions: SSRS data-driven subscriptions send different parameterizations to different recipients from a lookup table. In Power BI, this requires Premium or Fabric capacity and is handled through paginated report subscriptions, which support parameter-per-recipient delivery from a connected dataset (per Microsoft Power BI paginated reports documentation, 2025).
Power Automate flows: For complex routing - sending a regional P&L to each regional director and a consolidated version to the CFO on a trigger - Power Automate connects to Power BI's Export to File API and routes output through any email or Teams channel logic the workflow requires. This approach is more flexible than SSRS data-driven subscriptions and does not require a separate report for each recipient group.
For UK and EU finance teams, sensitivity labels applied at the workspace level ensure subscription-delivered PDFs are tagged for GDPR compliance before they leave the tenant. Canadian organizations can apply equivalent controls under PIPEDA by restricting subscription delivery to internal domains and logging access through the Power BI admin audit log.
A practical SSRS to Power BI migration checklist for subscriptions: (1) inventory all active SSRS subscriptions by report name, schedule, recipient list, and output format; (2) classify each as standard or data-driven; (3) recreate distribution lists using Power BI workspace sharing with appropriate sensitivity labels; (4) test delivery on a staging workspace before decommissioning the SSRS infrastructure. Subscription inventory should be step one of any migration - it reveals whether Premium or Fabric capacity is required before any other infrastructure decision is made.
What Does an SSRS to Power BI Migration Cost and Timeline Look Like?
SSRS to Power BI migration cost and timeline depend on three factors: report count, expression complexity, and whether the team is adding paginated output for regulatory filings alongside interactive reports.
| Scope | Typical Duration | Primary Cost Driver |
|---|---|---|
| Under 20 simple reports, one data source | 4-8 weeks | Semantic model design |
| 20-50 reports, mixed complexity, 2-3 sources | 8-16 weeks | DAX expression library build |
| 50+ reports, complex expressions, paginated and interactive | 16-24 weeks | Testing and parallel-run validation |
| On-premise SSRS plus cloud migration combined | 20-28 weeks | Infrastructure and capacity planning |
Cost drivers that extend timelines: undocumented SSRS expressions written by former staff, reports with dozens of parameter combinations, and finance teams requiring parallel-run validation - where SSRS and Power BI outputs run simultaneously through at least one full close cycle before the old server is decommissioned.
A data quality audit before migration is not optional. One air-quality remediation company we worked with found their revenue reports were quietly missing money - a date-filter bug in the reporting join had dropped 175 invoices out of 9,500 in their field service system. Fixing the ingest logic before migrating the report layer added time to the project but prevented those data gaps from carrying forward into the new Power BI environment. Finance teams should treat a data completeness check as a pre-migration gate, not an afterthought.
For teams evaluating the build-vs-managed tradeoff, the in-house BI vs managed reporting cost guide walks through the TCO comparison in detail. For a scoped estimate, the instant project cost calculator returns a range in under two minutes. For teams migrating from other legacy BI platforms alongside SSRS, the Cognos to Power BI migration anti-pattern guide covers expression-translation pitfalls that apply equally to SSRS source migrations.
---
About Lets Viz: Lets Viz has delivered data analytics and BI migration engagements since 2020, serving US healthcare systems, UK fintech firms, Canadian manufacturing companies, and global SaaS organizations. The team holds a 5.0 Clutch rating and specializes in Power BI semantic model design, DAX development, and full-stack SSRS modernization programs.
Ready to move your SSRS financial reports to Power BI? Our Tableau to Power BI migration services team applies the same semantic model methodology to SSRS migrations - semantic model design, DAX conversion, and validated period-close testing included.