ServiceNow Change Management Dashboard: CAB Power BI Guide
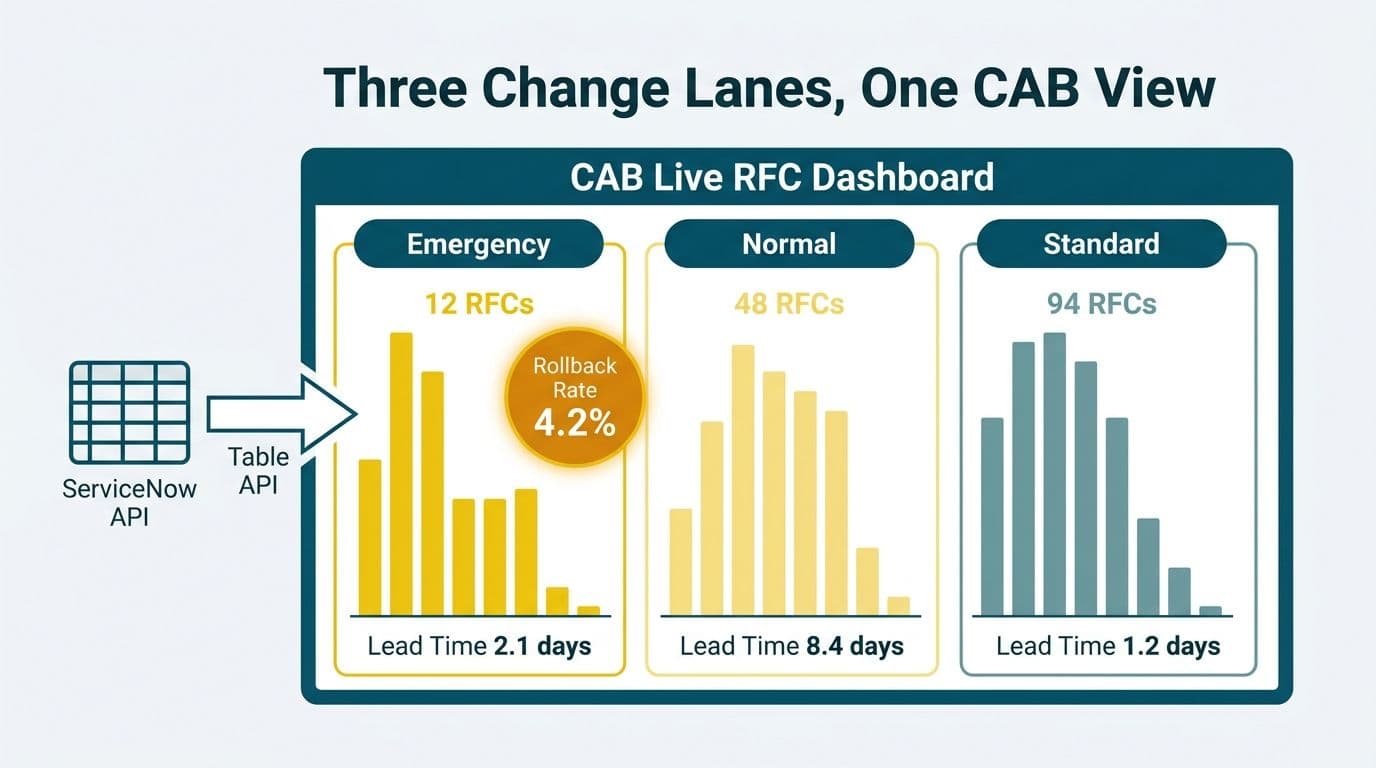
A ServiceNow change management dashboard in Power BI gives your Change Advisory Board a single view of every open request for change (RFC) - grouped by type, sorted by lead time, and annotated with rollback rate - without manual exports. Connect Power BI to ServiceNow's Table API or a nightly snapshot, then split emergency, normal, and standard changes into separate visual lanes. The result replaces the weekly CAB status deck with a live, governance-grade view that CIOs and change managers can read in under a minute.
Key Takeaways
- Emergency, normal, and standard changes need separate visual lanes in a CAB dashboard - mixing them obscures their fundamentally different risk profiles.
- Lead time distribution by approval stage reveals where RFCs stall, not just whether they missed the SLA.
- Rollback rate is most useful broken down by change type and team, not averaged across the full queue.
- Scheduled refresh (nightly) is more reliable than DirectQuery for the ServiceNow Table API at CAB-report scale.
- Compliance tagging for HIPAA, GDPR, and PIPEDA should be built into the data model before the dashboard reaches a shared workspace.
What Is a CAB-Ready Change Management Dashboard in Power BI?
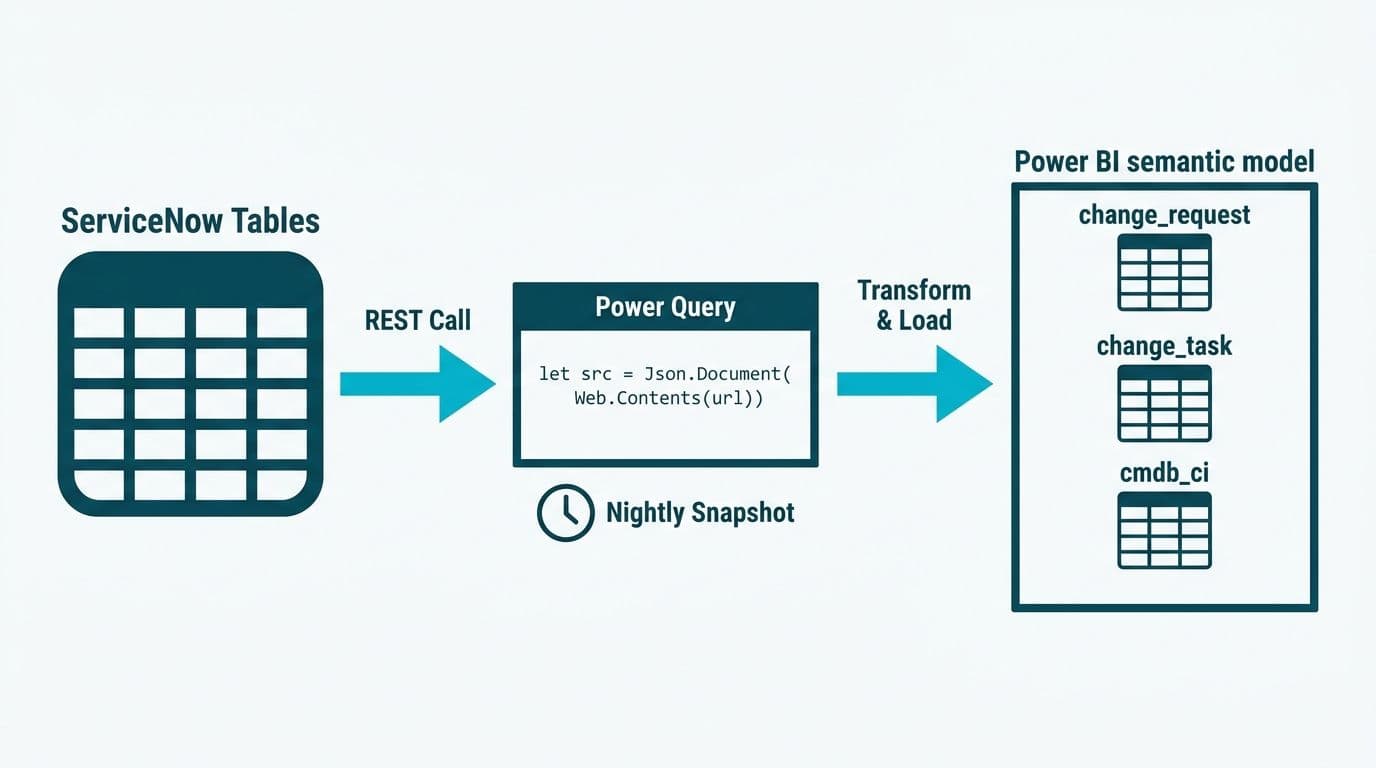
A CAB-ready dashboard is purpose-built for one meeting and one decision: which changes are approved to proceed in the next implementation window. In Power BI, that means pre-filtering to the current change window, surfacing change type prominently, and showing the three metrics that drive CAB decisions - volume by type, lead time distribution, and rollback rate - without requiring the board chair to drill through a raw table.
This article is deliberately distinct from the ServiceNow Power BI integration guide already on this site. That guide covers how to move data from ServiceNow into Power BI. This one covers what to build once the pipeline is running: the specific layout, DAX measures, and compliance considerations for a CAB-meeting view.
Our ServiceNow + Power BI / Tableau consulting team treats the CAB dashboard as a separate deliverable from the integration layer - typically a focused two-week sprint after the `change_request` table is flowing cleanly into Power BI.
What ServiceNow data does a CAB dashboard require?
ServiceNow's Change Management module stores RFCs in the `change_request` table. The key fields for a CAB view include:
- `type` - emergency, normal, or standard
- `state` - draft, assess, authorize, scheduled, implement, review, closed
- `planned_start_date` and `planned_end_date`
- `start_date` and `end_date` (actual implementation)
- `close_code` - successful, successful with issues, unsuccessful
- `cab_date` - the scheduled CAB meeting date
- `u_rollback_performed` - a custom boolean field, if your organisation has configured it
- `assignment_group` - for team-level lead time and rollback breakdowns
According to ServiceNow's official product documentation (2025), all of these fields are accessible via the Table API with OData-compatible query syntax that Power BI's built-in Web connector parses without a custom connector.
How Do You Split Emergency, Normal, and Standard Changes in a Power BI CAB Dashboard?
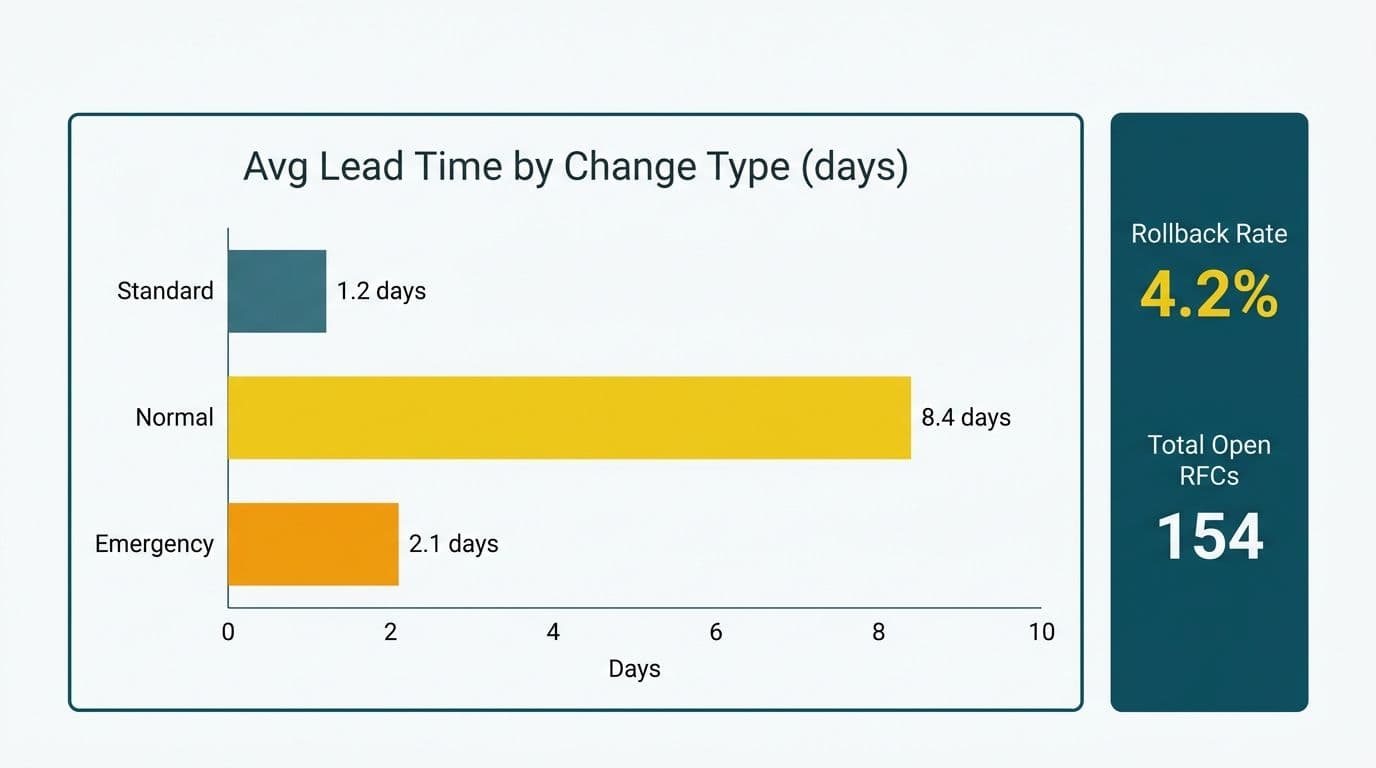
The three change types carry fundamentally different risk profiles and approval paths, which is why they must occupy separate visual lanes rather than a shared aggregate view.
Emergency changes bypass standard CAB approval and require a post-implementation review. Tracking their volume separately lets CIOs see how often the organisation operates outside normal governance - a key indicator for SOC 2 audit readiness in the US, ISO 27001 certification in the UK and EU, and equivalent internal controls in Canadian organisations subject to PIPEDA.
Normal changes are the primary input to the weekly CAB meeting. They follow the full assess-authorize-scheduled-implement pipeline and should dominate the middle lane of the dashboard. Standard changes are pre-approved and low-risk; they appear in the bottom lane for volume tracking but should not consume CAB agenda time.
In Power BI, add a calculated column to label change types clearly for visual display:
```dax
Change Type Label =
SWITCH(
change_request[type],
"emergency", "Emergency",
"normal", "Normal",
"standard", "Standard",
"Other"
)
```
Build a Stacked Bar Chart with `Change Type Label` as the legend and `cab_date` on the X-axis. This gives board members a week-by-week view of change mix at a glance.
CAB page swim-lane layout
Organise the CAB report page as three horizontal swim lanes:
1. Top lane - Emergency changes (red card headers): RFC count, mean actual lead time, post-implementation review completion rate.
2. Middle lane - Normal changes (default): State distribution bar, lead time histogram, rollback trend line.
3. Bottom lane - Standard changes (green card headers): Volume by category, count by team.
A slicer on `cab_date` lets the board chair lock the view to the current meeting window before the session starts.
What Does Lead Time Distribution Reveal About Your Change Pipeline?
Lead time distribution maps how long each RFC spends in each approval stage - assess, authorize, scheduled, implement - displayed as a histogram grouped by change type. The distribution matters more than the mean because a bimodal curve (most changes closing in two days, a tail closing in 20) looks healthy on average but signals a structural bottleneck for the outlier RFCs that carry schedule risk into the next CAB cycle.
To calculate stage-level lead time, you need ServiceNow's audit log (`sys_audit` table), which records every state transition with a precise timestamp. Join `sys_audit` to `change_request` on `documentkey = sys_id`, then calculate:
```dax
Stage Duration (hrs) =
DATEDIFF(
MIN(sys_audit[sys_created_on]),
MAX(sys_audit[sys_created_on]),
HOUR
)
```
grouped by `fieldname = "state"` and the target state value. This produces one row per stage per RFC, which feeds directly into a histogram visual.
Recommended visual for lead time
Use a histogram with a bin width of 8 hours for emergency changes and 24 hours for normal changes. Add a reference line at your SLA threshold. The reference line immediately shows what fraction of changes breach target - a sharper signal for a CIO than a percentage buried in a table cell.
A Canadian healthcare IT team operating under PIPEDA, for example, might set a 48-hour SLA on the authorise stage for normal changes and a 4-hour SLA for emergency changes. Displaying both thresholds as reference lines on the same histogram lets the CAB see the full risk picture without switching views. Lead time data containing personnel identifiers should also be filtered through row-level security before the report reaches a shared workspace, consistent with PIPEDA's accountability requirements.
How Do You Calculate and Display Rollback Rate in Power BI?
Rollback rate is the percentage of implemented changes that were reversed before the close review completed. In ServiceNow, this is captured either via `close_code` (value: unsuccessful) or a custom `u_rollback_performed` boolean field.
The DAX measure:
```dax
Rollback Rate % =
DIVIDE(
COUNTROWS(
FILTER(
change_request,
change_request[u_rollback_performed] = TRUE()
)
),
COUNTROWS(
FILTER(
change_request,
change_request[state] = "closed"
)
),
0
) * 100
```
Display as a KPI card at the top of the CAB page with conditional formatting: green below 3%, amber between 3 and 7%, red above 7%. These thresholds are illustrative - confirm your organisation's specific targets against your change management policy and any applicable internal audit standards.
Rollback rate by change type and team
An organisation-wide rollback rate averages out the signal that matters. Break it down by change type and `assignment_group` to identify whether rollbacks are concentrated in one team or systemic across the estate.
| Change Type | Risk profile | Recommended rollback view |
|---|---|---|
| Emergency | Highest | 30-day rolling rate with trend line |
| Normal | Moderate | Weekly by CAB cycle, split by team |
| Standard | Lowest | Monthly by category |
In a US healthcare organisation operating under HIPAA, a rising rollback rate on infrastructure changes affecting clinical systems may need to be documented in CAB minutes as part of the organisation's risk management record. A Power BI dashboard that surfaces the trend automatically makes that documentation consistent and reproducible across audit cycles.
How Do You Build the CAB Power BI Report Step by Step?
This section covers the build sequence from data connection to final layout in Power BI Desktop. It assumes the ServiceNow data pipeline is already running - if not, the ServiceNow Power BI integration guide covers the connection and authentication setup in full.
Step 1: Connect to change_request and sys_audit
Use the Web connector in Power BI Desktop with the ServiceNow Table API:
```
https://<instance>.service-now.com/api/now/table/change_request
?sysparm_fields=sys_id,type,state,planned_start_date,end_date,
close_code,cab_date,u_rollback_performed,assignment_group
&sysparm_query=planned_start_dateONLast 90 days
```
Authenticate with a service account holding the `itil` or `change_manager` role. Use scheduled refresh (nightly) rather than DirectQuery in production - the Table API is not optimised for live query volumes and can trigger rate limits at dashboard scale during business hours.
Step 2: Build the data model
Create these relationships in Power BI Desktop:
- `change_request[sys_id]` to `sys_audit[documentkey]` (one-to-many, for stage duration calculations)
- `change_request[cab_date]` to a `Date` table generated via the DAX `CALENDAR()` function (enables time intelligence)
The `Date` table allows slicers and time-intelligence measures to work correctly across both source tables without ambiguous filter context.
Step 3: Lay out the three-lane CAB page
Set the report page size to 1920 x 1080 pixels for widescreen meeting-room displays. Place the emergency lane at the top with KPI cards, the normal lane in the middle with the histogram and state distribution bar, and the standard lane at the bottom with category volume and team breakdown.
Step 4: Add governance filters and bookmarks
Create a bookmark called "CAB View - Current Window" that pre-filters `cab_date` to the next scheduled meeting date. The CAB chair can include the bookmark URL in the calendar invite so every attendee opens the view pre-filtered.
For UK fintech teams operating under GDPR, set the Power BI workspace to the EU data residency region and exclude personally identifiable fields - assignee email, requester name - from the CAB page, or anonymise them via a calculated column before they reach the report layer.
Workspace-level governance steps, including sensitivity labels and certified dataset pipelines, are covered in the Power BI Governance Best Practices: 12-Point Checklist. Review that checklist before promoting the CAB dashboard from development to a shared production workspace.
How Does a CAB Dashboard Differ from a General ITSM Report?
A general ITSM report covers incidents, problems, and changes together over a rolling 30 or 90-day window for daily operational review. A CAB dashboard is scoped to one meeting, one decision, and the current change window only.
| Dimension | General ITSM Report | CAB Dashboard |
|---|---|---|
| Audience | Operations team (daily) | CAB members (weekly meeting) |
| Time horizon | Rolling 30-90 days | Current change window only |
| Change type split | Optional | Mandatory |
| Lead time view | Summary average | Distribution by approval stage |
| Rollback rate | Historical KPI | Forward-looking risk signal |
| Compliance tagging | Uncommon | Required (HIPAA, GDPR, PIPEDA) |
| Page layout | Multi-topic, flexible | Three-lane swim-lane, fixed |
The CAB dashboard is also the right place to surface implementation success rate by team, which tells CIOs whether change quality issues are systemic or concentrated in one group - a conversation that belongs in CAB, not in an incident post-mortem the following week.
For broader platform context, the ServiceNow platform overview for CIOs covers how the change module sits within the Now Platform. Healthcare IT teams should review ServiceNow ITSM compliance considerations for HIPAA, GDPR, and PIPEDA before exposing change data in any shared workspace.
What Compliance Requirements Apply to a ServiceNow Change Management Dashboard?
Change management records contain timestamps, system identifiers, and personnel data including approver names and change owner email addresses. In regulated industries, these fields create obligations before the data reaches Power BI.
US healthcare (HIPAA): Change records touching clinical systems may form part of the audit trail required under the HIPAA Security Rule (45 CFR Part 164). Keep change data within the same tenant and data residency zone as your EHR environment, and apply Power BI sensitivity labels before sharing the workspace beyond the IT department.
UK and EU (GDPR): Assignee and requester email addresses are personal data under GDPR Article 4(1). Either anonymise them in the Power BI data model or restrict dataset access via row-level security tied to Active Directory groups. The EU data residency setting in Power BI Premium ensures data does not leave the EEA.
Canada (PIPEDA): Private-sector organisations handling personnel information in change records - names, roles, approval history - should complete a Privacy Impact Assessment before publishing a CAB dashboard to a shared workspace. PIPEDA's accountability principle requires a designated individual responsible for the organisation's compliance with those data protection obligations.
The most practical approach across all three jurisdictions is to build a CAB-safe API view in ServiceNow - a scripted REST endpoint that returns only non-PII fields - and connect Power BI to that view rather than querying the raw `change_request` table directly. This eliminates the need for row-level masking inside Power BI and simplifies the compliance documentation for auditors reviewing the reporting chain.
---
About Lets Viz: Lets Viz has delivered data and analytics consulting since 2020 for clients in US healthcare, UK fintech, Canadian manufacturing, and global SaaS - holding a 5.0 rating on Clutch. Our team designs ServiceNow reporting layers and Power BI dashboards built to meet HIPAA, GDPR, and PIPEDA requirements without adding friction to the CAB approval cycle.
If your change advisory board is still working from exported spreadsheets or weekly slide decks, our ServiceNow + Power BI / Tableau consulting team can design and build a CAB-ready dashboard in a focused two-week engagement.