ServiceNow Power BI Integration: A Complete Guide
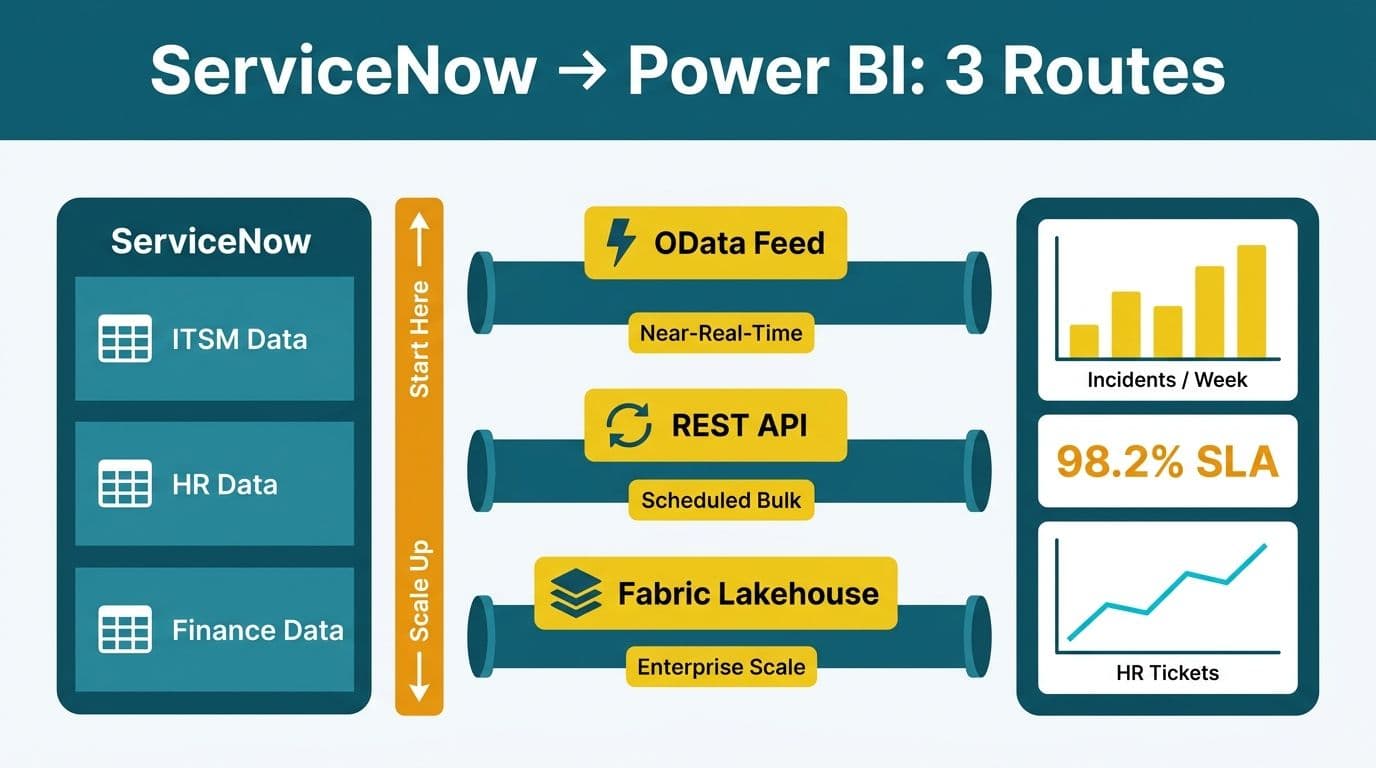
ServiceNow Power BI integration routes ITSM, HR, and financial service data from ServiceNow into Power BI dashboards using one of three paths: OData feeds for near-real-time reporting, the ServiceNow REST API for scheduled bulk exports, or Microsoft Fabric Lakehouse as a governed staging layer for high-volume enterprise use. Most mid-market teams start with OData and graduate to Fabric as data volumes and governance requirements grow.
Key Takeaways
- ServiceNow exposes data via OData feeds, REST APIs, and the Table API - choose based on row volume and refresh latency requirements.
- Power BI connects natively to ServiceNow OData endpoints without custom connectors for standard ITSM tables such as incidents, changes, and problems.
- Microsoft Fabric Lakehouse replaces traditional Power BI datasets at enterprise scale, centralizing ServiceNow data alongside ERP, finance, and EHR sources.
- HIPAA (US), GDPR (UK/EU), and PIPEDA (Canada) each impose distinct constraints on where ServiceNow data can be stored and who can query it in Power BI.
- For financial reporting, Power BI's DAX calculation engine handles ad-hoc time-intelligence analysis natively; Looker requires LookML model definitions for equivalent outcomes.
What Is ServiceNow Power BI Integration?
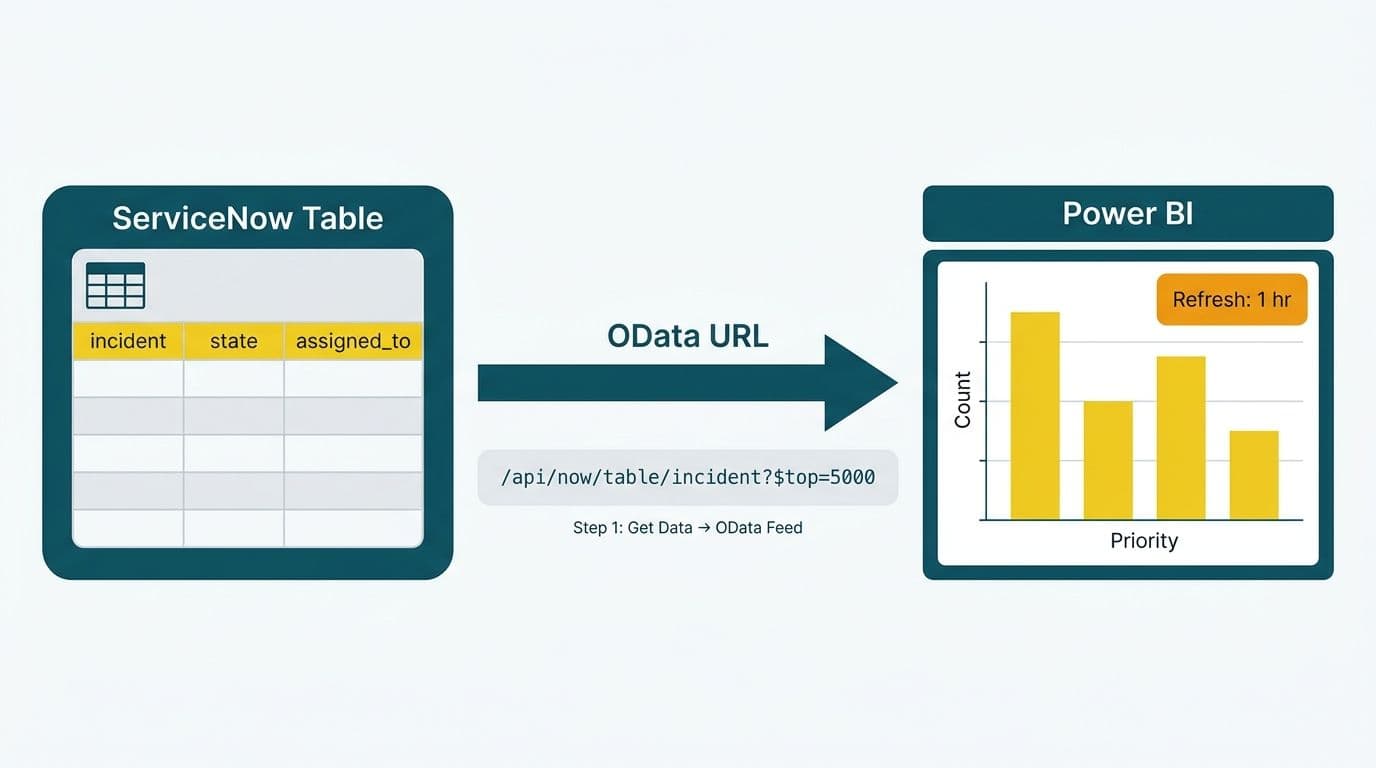
ServiceNow Power BI integration is the practice of pulling structured operational data - incident logs, CMDB records, HR cases, procurement approvals - from ServiceNow into Power BI for real-time or scheduled reporting. The result is a live analytics layer over your service management platform, replacing ServiceNow's native Performance Analytics widgets with the full modeling and visualization toolkit of Power BI.
For CIOs and data team leads, the core business case is clear: ServiceNow holds authoritative records for IT operations and service delivery, but its native reporting is constrained to pre-built widgets and limited cross-system joins. Power BI adds row-level security, cross-source data blending (ServiceNow plus ERP plus HR), and broad report distribution without requiring additional per-seat ServiceNow reporting licenses.
The complexity of choosing a connection method, modeling CMDB hierarchy relationships, and applying correct sensitivity labels is why many organizations begin with a ServiceNow + Power BI / Tableau consulting assessment before attempting the integration in-house.
Key source tables to consider connecting:
- Incident (incident) - volume, SLA, assignment group, resolution time
- Change Request (change_request) - approval history, risk classification, CAB data
- CMDB CI (cmdb_ci) - asset baseline and configuration hierarchy
- HR Case (sn_hr_core_case) - case type, resolution time, PII sensitivity classification
- Cost Allocation (cost_center, project_cost) - chargeback and financial reporting
How Do You Connect ServiceNow to Power BI?
Power BI connects to ServiceNow through three distinct methods. The right choice depends on row volume, refresh latency requirements, and whether your organization has Microsoft Fabric capacity already provisioned.
Method 1 - OData Feed (recommended starting point)
ServiceNow exposes every table as an OData v4 endpoint. In Power BI Desktop, select OData Feed as the data source, enter your instance URL, and authenticate with a dedicated service account. Power BI's OData connector handles pagination automatically for small-to-medium table sizes.
One practical ceiling: ServiceNow's glide.ui.query.max_count parameter (defaulting to 10,000 rows on most instances) limits OData exports per request. Mature enterprise incident tables frequently exceed this within months of go-live.
Method 2 - REST API with Paginated Extraction
The ServiceNow Table API supports limit and offset parameters for paginated bulk extraction. A Power Query M function loops through offset pages and appends results into a single table. This approach handles tens of millions of rows but requires either an on-premises data gateway or an Azure Function for cloud-hosted orchestration.
Method 3 - Microsoft Fabric Lakehouse
For organizations on Microsoft Fabric capacity, a Fabric Data Pipeline ingests ServiceNow data via REST API into Delta tables on OneLake. Power BI then connects to the Fabric semantic model - the successor to standalone Power BI datasets - rather than querying ServiceNow directly. This separates extraction from reporting, adds governed data lineage, and enables DirectLake mode for near-real-time query performance at scale.
| Method | Practical Row Limit | Latency | Governance | Best For |
|---|---|---|---|---|
| OData Feed | ~10,000 (configurable) | Near-real-time | Basic | Pilots, small tables |
| REST API + Dataflow | Unlimited | 15 min to 4 hr | Moderate | Mid-market standard |
| Fabric Lakehouse | Unlimited | Configurable | Enterprise | Large orgs, multi-source |
When Should You Use Microsoft Fabric Lakehouse for ServiceNow Reporting?
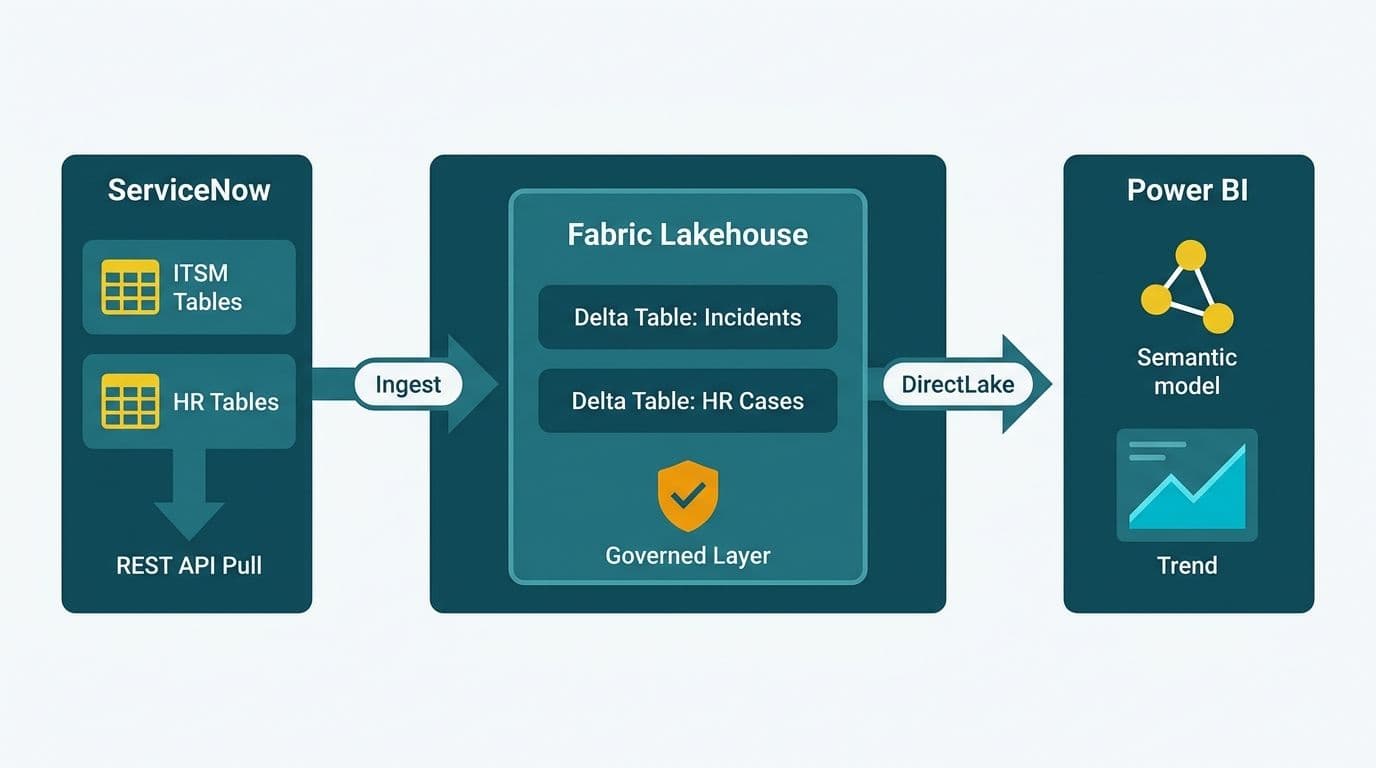
The Microsoft Fabric Lakehouse vs Power BI dataset decision becomes relevant when ServiceNow data needs to join other enterprise sources - ERP general ledger, EHR patient records, or revenue data - and the combined dataset outgrows what Power BI Import mode can hold in memory, or when data lineage and audit trails are a governance requirement.
A Fabric Lakehouse stores raw and curated ServiceNow data as Delta Parquet files on OneLake, Microsoft's unified storage layer. A Fabric semantic model sits on top, exposing clean business-logic tables to Power BI report authors. The key difference from a standalone Power BI dataset: the lakehouse adds a SQL analytics endpoint, Python and Spark notebook access for data scientists, and native integration with Fabric data engineering pipelines - all reading the same underlying files.
Data lakehouse architecture best practices for ServiceNow:
1. Bronze layer - raw ServiceNow table exports, timestamped and append-only, never overwritten
2. Silver layer - deduplicated, type-cast records joined to the CMDB asset hierarchy
3. Gold layer - aggregated KPIs (MTTR, SLA compliance rate, incident volume by team) ready for Power BI DirectLake mode
DirectLake mode - introduced in Microsoft Fabric and documented by Microsoft (2025) - allows Power BI to read Delta files from OneLake directly without importing data into memory, combining Import-mode query speed with near-real-time data freshness. For a US healthcare provider running ServiceNow ITSM alongside Epic EHR data, this architecture means one governed lakehouse can serve both the IT operations team and the clinical analytics team from a single data store - without duplicating sensitive patient data across multiple Power BI datasets.
Before configuring Fabric for healthcare workloads, review how HIPAA compliant BI tools for hospital data visualization interact with Fabric's sensitivity label and encryption model.
Power BI vs Looker for Financial Reporting from ServiceNow
When finance directors at mid-market companies evaluate BI tools for ServiceNow financial data - procurement spend, IT cost allocation, chargeback reporting - the comparison often comes down to Power BI and Looker.
Before comparing the two products, the difference between Looker and Looker Studio is worth clarifying. Looker (Google Cloud) is a governed, model-driven enterprise BI platform built on LookML semantic definitions. Looker Studio is Google's free self-service dashboard product - comparable to Power BI's free tier, not its Premium licensing tier. Organizations evaluating Power BI vs Looker for financial reporting are comparing enterprise-grade products, not Looker Studio's lighter feature set.
Where Power BI holds an advantage for ServiceNow financial data:
- Native OData connector - zero custom code required to connect ServiceNow tables in Power BI Desktop
- DAX time-intelligence - rolling averages, period-over-period variance, and year-to-date calculations are single-function expressions in DAX; LookML requires explicit dimension definitions for equivalent results
- Microsoft 365 integration - SSO via Azure AD, Teams report embedding, and SharePoint distribution work natively for organizations already on Microsoft 365 - a meaningful advantage for a UK fintech firm under FCA reporting requirements or a Canadian insurer governed by PIPEDA
- Predictable licensing - Power BI Pro at $10 per user per month (Microsoft 2026 pricing) scales cleanly for mid-market teams without negotiated contracts
When Looker is the stronger choice:
- Your data team maintains shared LookML models across multiple BI consumers and values a single governed semantic layer above all else
- Your data warehouse is on Google BigQuery and ServiceNow data already lands there via an existing pipeline
- Your organization is committed to the Google Cloud ecosystem across analytics and machine learning workloads
For teams considering migrating from Looker to Power BI, the translation work centers on converting LookML dimension tables into Power BI semantic model tables and replicating Looker explore relationships as Power BI relationship definitions or bridge tables. The Looker Studio vs Power BI 2026 decision guide covers the full evaluation framework if both tools remain in contention.
How Does ServiceNow Power BI Integration Handle HIPAA, GDPR, and PIPEDA Compliance?
Compliance is the most underestimated dimension of a ServiceNow Power BI integration. ServiceNow frequently holds data subject to healthcare privacy regulation - HIPAA in the US, PIPEDA in Canada - or general data protection law under GDPR in the UK and EU. HR cases with employee health disclosures, support desk tickets referencing patient MRNs, and financial approval records tied to individual identities all fall under one or more of these frameworks depending on where your organization operates.
HIPAA (US Healthcare)
A US hospital running ServiceNow ITSM for its Epic support desk will have incident records that contain PHI - patient names, MRNs embedded in ticket descriptions, and facility references. Before connecting these tables to Power BI:
- Confirm a Business Associate Agreement (BAA) is in place with Microsoft. Azure and the Power BI service both support BAAs per Microsoft's published compliance documentation (2025).
- Apply Power BI sensitivity labels to prevent PHI from being exported to unprotected Excel or CSV formats.
- Implement row-level security (RLS) so clinical IT staff see only their department's records, not the full incident table.
For a practical example of how healthcare teams structure compliant Power BI reporting layers for clinical operational data, see the Hospital Readmission Rate Analytics Dashboard in Power BI article.
GDPR (UK and EU)
A UK fintech firm using ServiceNow for HR case management must ensure personal data does not transit outside the EEA without adequate transfer safeguards under GDPR Article 44. Microsoft's EU Data Boundary commitment - effective 2025 per Microsoft documentation - keeps Power BI processing and storage within EU regions for qualifying tenants, but this requires explicit tenant configuration, not just regional deployment of the service.
For a detailed compliance checklist covering SaaS financial reporting under GDPR, see our GDPR compliant financial reporting guide.
PIPEDA (Canada)
Canadian organizations - whether a Toronto-based insurer or a Vancouver health authority - must ensure ServiceNow personal data processed in Power BI is governed under PIPEDA's accountability principle. If using Microsoft Fabric, verify that your Fabric capacity is provisioned in Canada Central or Canada East to satisfy data residency requirements. Microsoft's Fabric compliance documentation (2025) confirms SOC 2 Type II and PIPEDA alignment for Canadian region deployments.
What Does a ServiceNow Power BI Integration Project Look Like in Practice?
A typical mid-market ServiceNow Power BI integration runs across four phases.
Phase 1 - Discovery (1 to 2 weeks)
Identify source tables, row volumes, PII classification, and refresh frequency requirements. A US SaaS company might need incident and change data refreshed every 15 minutes for a network operations center dashboard; a Canadian manufacturing firm might need monthly procurement cost allocation for a finance review cycle.
Phase 2 - Connection and Semantic Modeling (2 to 4 weeks)
Build the OData or API extraction layer, create the Power BI semantic model with CMDB hierarchy relationships and calculated KPI measures, and apply row-level security aligned to ServiceNow assignment groups or cost center ownership.
Phase 3 - Dashboard Build (2 to 3 weeks)
Develop executive KPI dashboards - MTTR, SLA breach rate, incident aging by priority - and operational drill-down reports. For IT financial chargeback reporting, this phase includes mapping ServiceNow cost center fields to ERP general ledger codes for a unified finance view.
Phase 4 - Governance and Handover (1 week)
Configure sensitivity labels, finalize scheduled refresh or Fabric pipeline cadence, document the semantic model for maintainability, and train report authors on Power BI's self-service layer.
A practical note on data volume at scale: Power BI's visual export is capped at 30,000 rows for CSV exports from a visual. For scenarios requiring the full underlying dataset - audit extracts, downstream reconciliation, or external billing verification - the correct approach is to connect directly to the Power BI XMLA endpoint (the Analysis Services engine underlying the semantic model) and stream data from the model itself rather than from a report visual. One of our clients, a book distributor, needed all 5,042,721 billing rows for an external reconciliation; connecting to the model engine directly streamed the complete extract at approximately one million rows per minute.
For ongoing semantic model maintenance after go-live, Managed Power BI services cover refresh monitoring, schema change management, and incremental report development. If your data infrastructure readiness is uncertain before starting, the free BI readiness assessment surfaces governance gaps in about 10 minutes.
---
About Lets Viz: Lets Viz has delivered data and analytics projects since 2020 for clients in US healthcare, UK fintech, Canadian manufacturing, and global SaaS - holding a 5.0 rating on Clutch. Our team architects ServiceNow-to-Power BI pipelines designed to satisfy HIPAA, GDPR, and PIPEDA requirements from the discovery phase, not as a post-go-live remediation.
If your team is ready to connect ServiceNow to Power BI - or wants to evaluate whether Microsoft Fabric belongs in the architecture - our ServiceNow + Power BI / Tableau consulting team offers a scoped discovery engagement as a starting point.