Power BI Copilot vs Tableau Pulse: Finance Leaders Guide
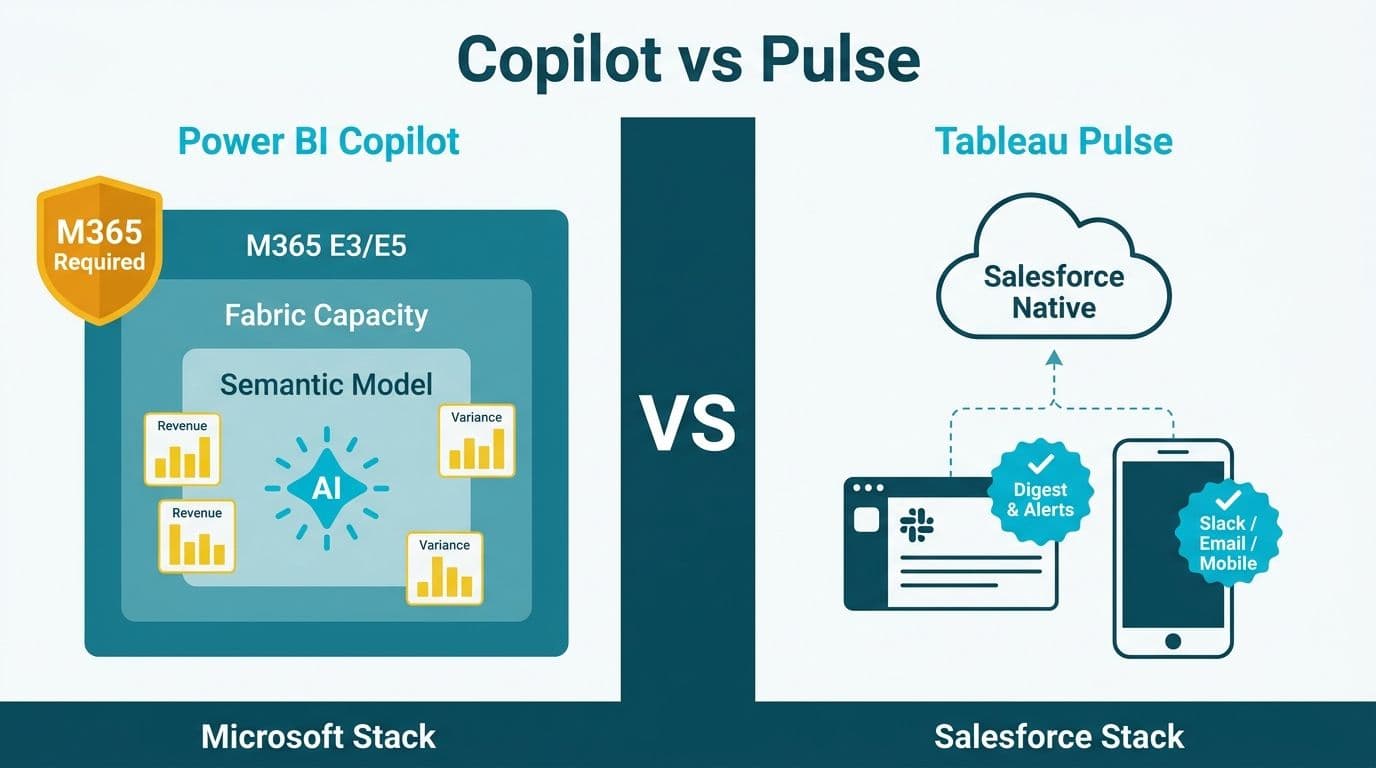
Power BI Copilot embeds AI directly inside Microsoft's semantic model and requires Fabric capacity alongside an M365 E3 or E5 licence. Tableau Pulse operates as a digest-and-alert layer delivered through Slack, email, and mobile. For finance teams already committed to the Microsoft stack, Copilot offers tighter data model integration; organisations running Salesforce-native infrastructure will find Pulse's workflow embedding more natural. The right choice depends far more on your existing cloud ecosystem than on any headline AI feature.
Key Takeaways
Power BI Copilot licensing requires Microsoft 365 E3 or E5 plus Fabric F64 capacity or Premium Per User, adding meaningful per-user cost above base Power BI Pro.
Tableau Pulse is bundled with Tableau+ and Enterprise plans, but organisations not on those tiers face incremental licence costs to access it.
Copilot integrates at the semantic model layer - AI answers inherit row-level security, calculated measures, and all relationships already defined in your model.
Pulse integrates at the metric layer and excels at proactive alerting and mobile consumption; Copilot leads on structured, model-aware financial narrative.
Data model readiness is the single biggest predictor of Copilot success - poorly named measures and missing relationships limit AI output quality regardless of licence tier.
How Do Power BI Copilot Licensing Requirements Compare to Tableau Pulse Costs?
Licensing is often the first question finance directors raise, and the structures differ substantially. Power BI Copilot licensing requirements centre on two layers: first, each user needs a Microsoft 365 E3 or E5 subscription (or a separately purchased Microsoft 365 Copilot add-on at approximately $30 per user per month as of 2026, following Microsoft's early-2026 restructure that separated Copilot from the base M365 suite for new commercial agreements); second, your Power BI workspace must sit on either Fabric F64 capacity or a Premium Per User (PPU) licence. PPU runs around $20 per user per month, while F64 Fabric capacity starts near $6,500 per month (as of 2026) and is shared across all users in the tenant. For a 50-seat finance team, that Fabric floor can look steep until you factor in the tenant-wide benefit across every department consuming Power BI reports.
Tableau Pulse is bundled into Tableau+'s subscription tier and the Enterprise plan. Organisations already paying for Tableau Creator or Explorer licences must upgrade, adding a cost variable that finance directors should model carefully against current contract terms. Salesforce (which owns Tableau) increasingly bundles Pulse capabilities with Data Cloud, so companies running the full Salesforce Revenue Cloud stack may find Pulse arrives with little incremental spend. For organisations outside that ecosystem, unlocking Pulse requires a tier jump.
Budget for annual licence reviews in any multi-year roadmap.
For Canadian financial services firms subject to PIPEDA, data residency within Microsoft's Canadian Azure regions is contractually available under Fabric, which can simplify compliance documentation significantly. UK and EU organisations operating under GDPR should verify Tableau's data processing agreements with Salesforce before committing - both vendors publish DPAs, but Fabric's tighter Microsoft 365 compliance boundary is often easier to document for regulators. For help sizing costs against your specific user count and capacity needs, explore Power BI consulting (Copilot-ready).
How Deep Is the Semantic Model Integration in Power BI Copilot vs Tableau Pulse?
This is where the two platforms diverge most sharply. Power BI Copilot data model readiness is the foundation of everything the AI can do. When a finance analyst asks "What drove the revenue variance in Q2?", Copilot queries the live semantic model - it sees your DAX measures, your relationship graph, your row-level security filters, and your table descriptions. A well-built model with named measures like `[Gross Margin %]` and `[Budget vs Actual Revenue]` produces precise, auditable answers. A poorly structured model with generic column names returns generic, unreliable output.
Tableau Pulse works one abstraction higher. It consumes Tableau Metrics - pre-defined KPIs that a data team has already surfaced - and applies Einstein AI to detect anomalies, generate natural-language digests, and push alerts. Salesforce's 2026 Agentforce integration with Tableau Pulse extends this further: AI agents can now trigger metric-layer alerts, surface contextual summaries inside Sales Cloud workflows, and initiate follow-up actions without analyst involvement - a meaningful capability leap for organisations running the full Salesforce Revenue Cloud stack. The limitation remains that Pulse cannot reach below its metric layer to explore why the underlying model is behaving in a particular way.
For finance teams that have already invested in a governed, certified semantic model in Power BI, Copilot compounds that investment. For teams where data engineering resources are thin and the priority is surfacing 10-20 KPIs to executives on mobile, Pulse is faster to deploy. Our Microsoft Fabric OneLake Explained guide covers how a unified data lake layer strengthens Copilot's model integration across the Fabric estate.
A US healthcare system running clinical finance dashboards under HIPAA constraints typically has row-level security segmented by cost centre. Copilot respects those filters natively - a director of nursing finance will only see AI-generated answers scoped to her cost centres, with no additional configuration beyond what already exists in the model.
Which Platform Generates Better Financial Narratives?
For finance-specific narrative quality, the comparison splits cleanly by use case. Power BI Copilot can draft variance commentary directly from DAX measures - summarise a P&L, annotate a budget-vs-actual waterfall, or describe trend inflection points in a cash flow statement. Because it sits inside the report canvas, Copilot-generated narrative appears inline with the visual it describes, which is exactly the format FP&A teams need when preparing board packs.
Tableau Pulse generates narrative too, but its output is designed for digest consumption rather than embedded commentary. The language is terse and alert-style: it excels at "Revenue is 8% below target; three regions are contributing 90% of the gap." It is less suited to paragraph-form commentary inside a formatted financial statement.
A UK fintech firm building automated reporting for investor relations would find Copilot's in-canvas narrative generation more appropriate than Pulse's digest format. Any AI-generated financial commentary intended for UK FCA-supervised reporting must carry clear disclosure and human review - neither platform automates away that obligation, but Copilot's inline position in the report makes that review workflow more natural under GDPR documentation requirements.
Finance teams that establish a human-in-the-loop review workflow now will be better positioned as narrative quality on both platforms continues to improve. For a broader view of how AI tools are reshaping finance workflows, see Best AI Tools for Finance Professionals Compared (2026).
Finance-Specific Task Performance: Power BI Copilot vs Tableau Pulse Side by Side
The table below summarises performance across the tasks finance teams most commonly bring to embedded BI AI tools.
| Task | Power BI Copilot | Tableau Pulse |
|---|---|---|
| Budget vs actual variance commentary | Strong - draws from DAX measures | Limited - digest-style alerts only |
| Month-end close KPI digest (email/Slack) | Moderate - requires workflow configuration | Excellent - native delivery channel |
| Row-level security compliance | Native - inherited from semantic model | Metric-layer only - does not inherit model RLS |
| Cash flow narrative for board packs | Strong - inline report narrative | Weak - not designed for formatted documents |
| Anomaly detection and proactive alerting | Moderate - improving with Fabric | Excellent - core design principle |
| Cross-dataset DAX exploration | Strong - full semantic model access | Not applicable - metric layer only |
| Mobile executive consumption | Moderate - Power BI Mobile required | Strong - Slack and email native |
| HIPAA/SOC 2 audit trail | Strong - Fabric audit logs | Requires Salesforce Shield add-on |
| GDPR/PIPEDA data residency documentation | Strong - Microsoft regional compliance | Available but requires DPA verification |
The variance analysis row deserves emphasis. A well-structured Power BI semantic model with measures like `[Actual COGS]` minus `[Budget COGS]` allows Copilot to answer "Why did gross margin decline in March?" with specific measure references that an analyst can trace back to source data. Tableau Pulse would surface the margin decline as an alert but could not walk through the decomposition.
For the DAX foundation that makes Copilot most powerful in finance reporting, the DAX SUMMARIZE vs SUMMARIZECOLUMNS: Finance Reporting Guide covers the modelling patterns that unlock the best AI responses. A Canadian manufacturing company with a 12-person finance team running Power BI for cost centre variance analysis found that Copilot's ability to scope answers using existing model RLS - which already met PIPEDA data segmentation requirements - reduced manual data preparation effort substantially compared to configuring equivalent metric-layer governance in Pulse.
What Are the Power BI Copilot Data Model Readiness Requirements?
The single biggest predictor of Copilot success is not licence tier or Fabric capacity - it is data model readiness. Microsoft's guidance identifies four prerequisites before enabling Copilot in Power BI workspaces:
1. Semantic model descriptions - tables and columns need plain-English descriptions so the AI can map user questions to the correct data.
2. Certified or promoted datasets - Copilot is most reliable when pointed at certified datasets rather than ad hoc workbooks.
3. Consistent measure naming - DAX measures should follow a naming convention that mirrors business language. `[Net Revenue]` is better than `[Net_Rev_v3_final]`.
4. Relationship completeness - missing or ambiguous relationships cause Copilot to produce incorrect cross-table answers, which in finance is worse than no answer at all.
Microsoft's internal telemetry, shared at Ignite 2025, indicated that Copilot Q&A accuracy improved by roughly 35-40% in semantic models with complete table and column descriptions versus equivalent models without them — underscoring why description hygiene is non-negotiable before committing to Fabric capacity spend.
Knowing how to enable Copilot in Power BI involves a two-step admin process: first enable the Copilot switch in the Fabric Admin portal at the tenant level, then assign Fabric capacity to the specific workspace. Users must hold either an M365 Copilot licence or a PPU licence. This two-step gate prevents accidental broad rollout before models are ready.
The Power BI Copilot scenario library - Microsoft's published set of supported use cases - covers Q&A over reports, summary generation, DAX query assistance, and report page creation from natural-language prompts. Finance teams should map their actual workflows against this scenario library before committing to Fabric capacity spend, since not all financial reporting patterns fall within supported scenarios today.
Finance teams that invest in clean semantic models now build the compounding foundation that embedded AI tools will leverage over the coming decade. For context on the broader AI analytics landscape in regulated industries, see AI Analytics Use Cases in Healthcare Finance: 2026 Guide.
When Should Finance Leaders Choose Power BI Copilot or Tableau Pulse?
The choice rarely comes down to a feature-by-feature score. It comes down to ecosystem fit and data team maturity.
Choose Power BI Copilot when:
Your organisation already has Microsoft 365 E3/E5 and is building toward Microsoft Fabric.
Your data team has built, or is willing to build, a governed semantic model with certified datasets.
Your primary finance use cases involve in-report narrative, variance commentary, and board pack generation.
You need AI answers to respect existing row-level security without additional configuration.
You operate in a US healthcare environment where HIPAA audit trails through Fabric's native logging reduce compliance overhead.
Choose Tableau Pulse when:
Your organisation runs Salesforce Revenue Cloud and already pays for Tableau+ or Enterprise.
Your priority is delivering KPI digests to executives via Slack and email with minimal analyst involvement.
Your data team is lean and you need a low-friction path to surfacing 10-20 business metrics with AI commentary.
Proactive anomaly alerting matters more than deep model exploration.
You are a UK fintech team where Salesforce ecosystem alignment — including Agentforce's 2026 agentic workflow capabilities — outweighs the Fabric cost advantages.
Neither platform is a plug-and-play solution. Both require deliberate investment - semantic model governance for Copilot, metrics layer curation for Pulse. Finance leaders who treat embedded BI AI as a feature switch rather than a capability to build will be disappointed by both products. The organisations seeing the strongest returns are those that started with clean data models and clear use-case prioritisation before enabling any AI feature.
---
About Lets Viz: Lets Viz has delivered data analytics and business intelligence solutions since 2020, working with US healthcare systems, UK fintech firms, Canadian manufacturing companies, and global SaaS businesses. Recognised with a 5.0 Clutch rating, the team specialises in Power BI semantic model governance, Copilot readiness assessments, and Microsoft Fabric implementations that help finance and analytics teams extract measurable value from embedded AI.
Ready to evaluate whether Power BI Copilot or Tableau Pulse is the right fit for your finance team? Explore Power BI consulting (Copilot-ready) to see how we assess data model readiness and architect Copilot-ready solutions across Microsoft Fabric.