How to Copy and Customize a Looker Studio Template
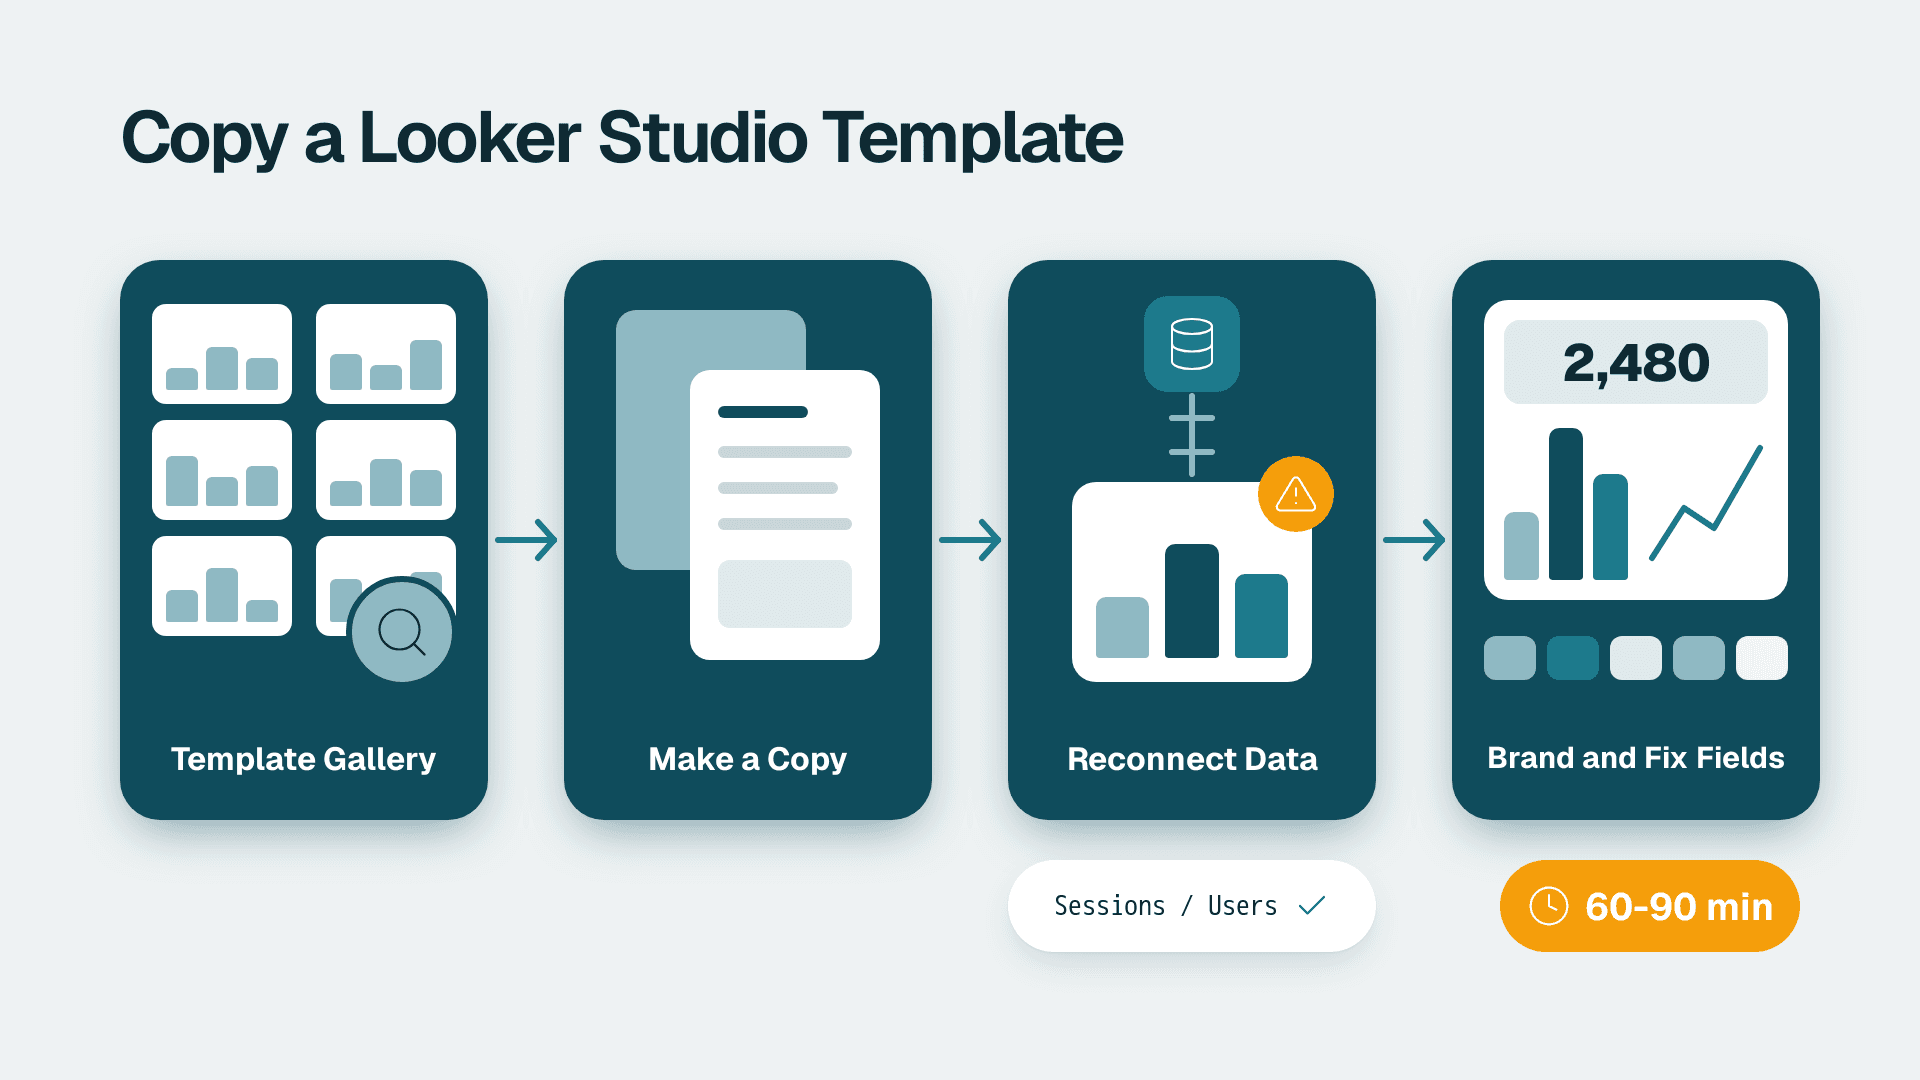
You can copy a template from the Looker Studio gallery, point it at your own data, apply your branding and repair broken calculated fields in roughly 60 to 90 minutes for a typical one- to three-page report. Most of that time goes to field mapping and formula repair, not the copy itself. This guide covers each step in order.
What You'll Need
- A Google account that can sign in to Looker Studio at lookerstudio.google.com. Free Looker Studio is enough for everything in this guide.
- Access to your data source: for example, edit or view rights on the Google Analytics 4 property, Google Ads account, Search Console site, BigQuery project or Google Sheet you want to connect. If you cannot open the data in its own product, the connector will fail later.
- The template you want to copy, either from the official template gallery or shared with you as a report link with copy permission.
- Your brand assets: logo as PNG or SVG with a transparent background, a primary and secondary hex colour, and your brand font name if it is available in Google Fonts.
- A list of the template's fields you actually need. Decide this now so you can delete the rest instead of repairing it.
- A test date range where you know the real totals (for example last month's sessions), so you can check numbers after reconnecting.
Per Google's Looker Studio Help documentation (2026), a copied report is independent of the original: edits you make do not touch the source template.
Step 1: Find and Open the Template in the Gallery
1. Go to lookerstudio.google.com and sign in.
2. In the left navigation, click Reports. At the top of the page you will see a strip labelled Template gallery. Click Template gallery to open the full list.
3. Filter by Use case or Data source at the top of the gallery. Choose the filter that matches the connector you plan to use (for example Google Analytics or Search Ads).
4. Click a template card. The template opens in view mode with sample data.
What you should see: a live report with demo numbers and a blue Use my own data button in the top-right corner. Click through every page of the template first. Note which pages use which data source, because a template with three sources needs three reconnections later.
Pick a template that fits your data
Before you copy, check that the template's metrics exist in your account. A template built for an ecommerce property will show empty scorecards on a lead-generation GA4 property. If more than a third of the charts will not apply, pick a different template. Deleting charts is quick, but rebuilding a data model is not.
Step 2: Make Your Copy with Your Own Data
There are two ways to copy. Use the first for gallery templates, and the second for a report someone shared with you.
Option A: Use my own data (gallery templates)
1. In the template, click Use my own data (top right).
2. A dialog titled Copy this report appears. For each data source the template uses, you will see a row with a dropdown labelled New Data Source.
3. Click the dropdown and choose Create new data source.
4. In the connector list, select the connector that matches the row, for example Google Analytics. Click Authorize if prompted.
5. Choose your Account, then Property, then Data stream or view, and click Connect at the bottom right.
6. Repeat for each remaining row, then click Copy Report.
What you should see: your copy opens in edit mode with a name like "Copy of [Template name]", and the charts show your numbers.
Option B: File > Make a copy (shared reports)
1. Open the shared report and click the three-dot menu in the top right, then Make a copy.
2. In the same dialog, pick a New Data Source for each row.
3. Click Copy Report.
If Make a copy is greyed out, the owner disabled copying. Ask them to enable it or to share the report with edit access.
Rename it now
Click the report title at the top left and rename it, for example "Client Name - Marketing Performance". Doing this immediately avoids mixing up copies later.
Step 3: Reconnect and Audit Your Data Sources
Sometimes the copy dialog is skipped, or you want to swap one connection for another. Do this audit even if the numbers look right.
1. In edit mode, click Resource in the top menu, then Manage added data sources.
2. You will see a table listing each data source, its type and its owner. Click Edit on the row you want to change.
3. In the data source editor, check the Connection area at the top. To point it at a different account, click Reconnect and choose the new account, property or table.
4. Click Done or Back when finished.
What you should see: the data source name, the connector icon and your account in the table. Any source still pointing at the template author's sample data needs replacing.
Swap the source on a single chart
1. Click a chart.
2. In the right-hand Setup panel, open the Data source dropdown (shown by the current source name).
3. Select your source from the list, or click Add data to create one.
If the new source has differently named fields, the chart shows a Configuration error or empty dimension and metric slots. Re-select each field in the Setup panel. That is expected and is covered in Step 6.
Set data credentials correctly
In Manage added data sources, click Edit and look at Data credentials (top left of the editor). Two settings matter:
- Owner's credentials: every viewer sees the data using your access. Right for client reports where viewers have no direct access to the account.
- Viewer's credentials: each viewer needs their own access to the underlying data. Right for internal reports on restricted data.
Picking the wrong one is the most common reason a client sees a Data Set Configuration Error while you see the report fine.
Step 4: Swap in Your Branding with Theme and Layout
Do branding at the theme level, not chart by chart. Otherwise you will repaint every object by hand.
1. Click Theme and layout in the toolbar (or Theme and layout under the Layout menu).
2. Open the Theme tab and click Customize at the bottom of the panel.
3. In Customize theme, set these tabs in order:
- Theme colors: set Primary and Secondary to your hex values (for example `#0B3D91`), then set the Background and Text colours.
- Font: choose a Font family for the report and, if needed, separate styles for headings and body text.
- Chart defaults: set series colours and gridline style so every new chart inherits them.
4. Click Save in the panel.
What you should see: every chart that used theme colours recolours itself. Any element that stayed the old colour has a manual override, which you fix next.
Replace the logo and header
1. Click the old logo on the canvas. Press Delete.
2. Click Insert in the top menu, then Image, and upload your logo.
3. Resize it by dragging a corner handle while holding Shift to keep proportions.
4. With the logo selected, open Arrange and click Make report-level so it appears on every page.
Do the same for the footer text, title text boxes and any hard-coded template-author name or URL. Use Edit then Find and replace-style scanning by clicking through each page, since Looker Studio has no global text search.
Fix manual colour overrides
Click any chart that did not update. In the Style tab, look for a series colour that was set manually and choose the theme swatch instead of the hex. Also check Page then Current page settings and Style for page-level background overrides.
Step 5: Strip What You Do Not Need
Removing unused pages and controls early reduces both clutter and broken-field noise.
1. Right-click a page tab at the bottom or in the Pages panel and choose Delete for any page you do not need.
2. Delete charts whose metrics your data does not have.
3. Open Resource then Manage added data sources and remove any data source no longer used by a chart. The table has a Remove option per row; Looker Studio warns you if charts still depend on it.
4. Check Resource then Manage controls and delete orphaned filter controls.
What you should see: a leaner report and a shorter list of sources. If you delete a data source that a chart still needs, the chart turns grey with an error, and you can undo with Ctrl+Z immediately.
Step 6: Fix Broken Calculated Fields
Calculated fields break after a copy because the formula references a field name that your connector does not have, or because the field lived in the template author's data source and did not carry over.
Find the broken fields
1. Go to Resource then Manage added data sources then Edit.
2. In the field list, look for fields marked with a red warning or an Invalid formula message. Click the field name to open its formula.
3. Separately, click each chart that shows an error and check the Setup panel for fields highlighted in red.
Understand the two places a formula can live
- Data source-level fields are created in the data source editor and are available in every chart using that source.
- Chart-level fields are created inside a chart (a Create field button in the metric or dimension dropdown) and only exist in that chart. These are the ones people forget to audit.
Repair the common cases
Renamed field. The formula points at `Sessions` but your connector calls it `sessions` or `Total sessions`. Open the field and replace the name:
```
SUM(Sessions) / SUM(Users)
```
becomes
```
SUM(Total sessions) / SUM(Total users)
```
Type the new field names exactly as shown in the field list; the editor autocompletes them when you start typing.
Division by zero. Ratio fields return errors on empty rows. Wrap the denominator:
```
SUM(Conversions) / NULLIF(SUM(Sessions), 0)
```
Wrong data type. A date stored as text breaks date comparisons. In the data source editor, click the Type column for that field and change it to Date, or convert it in the formula:
```
PARSE_DATE("%Y%m%d", Date_text)
```
Template-only field. If the formula references a field that does not exist in your data at all (for example a custom dimension), either create the equivalent in your source or delete the formula and the charts that depend on it.
Check a repaired field
1. Click Done in the editor and return to the report.
2. Set the report date range to your test period.
3. Compare one scorecard against the same number in the source product (for example GA4 itself).
Small differences can come from sampling, thresholds or timezone settings. A difference of orders of magnitude means the wrong field or wrong aggregation. For a deeper look at how well your reporting is set up overall, the free BI readiness self-assessment is a quick sanity check.
Step 7: Test, Share and Hand Over
1. Click View in the top right to leave edit mode and read the report as a viewer.
2. Change the date range, use every filter control and click through every page. Confirm the numbers still match your test period.
3. Click Share then Manage access. Add viewers by email, or change Link sharing to restrict who can open the report. Decide whether each person is a Viewer or Editor.
4. For scheduled delivery, click Share then Schedule delivery and choose recipients, frequency and pages.
5. If the report goes to a client, send the link from a test account first and check that they see data rather than a permissions error.
If you want examples of well-structured finished reports to model yours on, browse the dashboard examples.
Document what you changed
Keep a short note beside the report listing the data sources, the credential mode, the calculated fields you edited and the date of the copy. When the template author updates their version, you will know exactly what differs from yours. Template updates do not flow into your copy.
Common Mistakes
- Copying without checking which data sources the template uses. You reconnect one source and leave a second pointing at sample data. Fix: open Resource then Manage added data sources after every copy and confirm each row shows your account.
- Branding each chart manually. It takes hours and breaks the next time the palette changes. Fix: set colours and fonts in Theme and layout then Customize, and clear overrides on charts that do not follow.
- Leaving Owner's credentials on a source with sensitive data. Anyone with the link sees the data. Fix: choose Viewer's credentials for restricted data, or restrict link sharing under Share then Manage access.
- Fixing the chart error instead of the field. If a calculated field is invalid, re-selecting it in ten charts only hides the cause. Fix: repair it once in the data source editor so every chart inherits the fix.
- Never checking numbers against the source. A report can look perfect and still use the wrong aggregation. Fix: reconcile at least one scorecard per page against the native product before sharing.
Troubleshooting
- Charts show "Configuration error" or "Field not found" after reconnecting. The new source has different field names or types from the template's. Re-select each field in the Setup panel, or edit the data source and rename the fields to match what the charts expect.
- The report works for you but the client sees "Data Set Configuration Error". The data source uses Viewer's credentials and the client has no access to the underlying account. Switch to Owner's credentials in the data source editor, or give the client access to the source.
- Numbers are zero or look far lower than expected. The date range has no data, a template-level filter or segment is excluding your rows, or the field has been mapped to the wrong metric. Check the chart's Filter and Date range settings, then the field mapping.
If you would rather not spend a day on this for every client, our team can set up a reusable, branded template system for you. See our Looker Studio consulting or, if you are weighing the cost of a build, try the instant project cost calculator.
For reporting beyond a single dashboard, see our full range of analytics services.
If you want help standardising templates across client accounts, book a scoping call with our Certified Looker Studio consulting team.
---
About Lets Viz: Lets Viz has delivered data analytics, dashboard and BI consulting since 2020 for clients across healthcare, finance, SaaS, logistics and marketing agencies. We hold a 5.0 rating on Clutch, and our consultants build and maintain Looker Studio reporting for agency and mid-market teams every week.