Population Health Management Dashboard: Payer and ACO Guide 2026
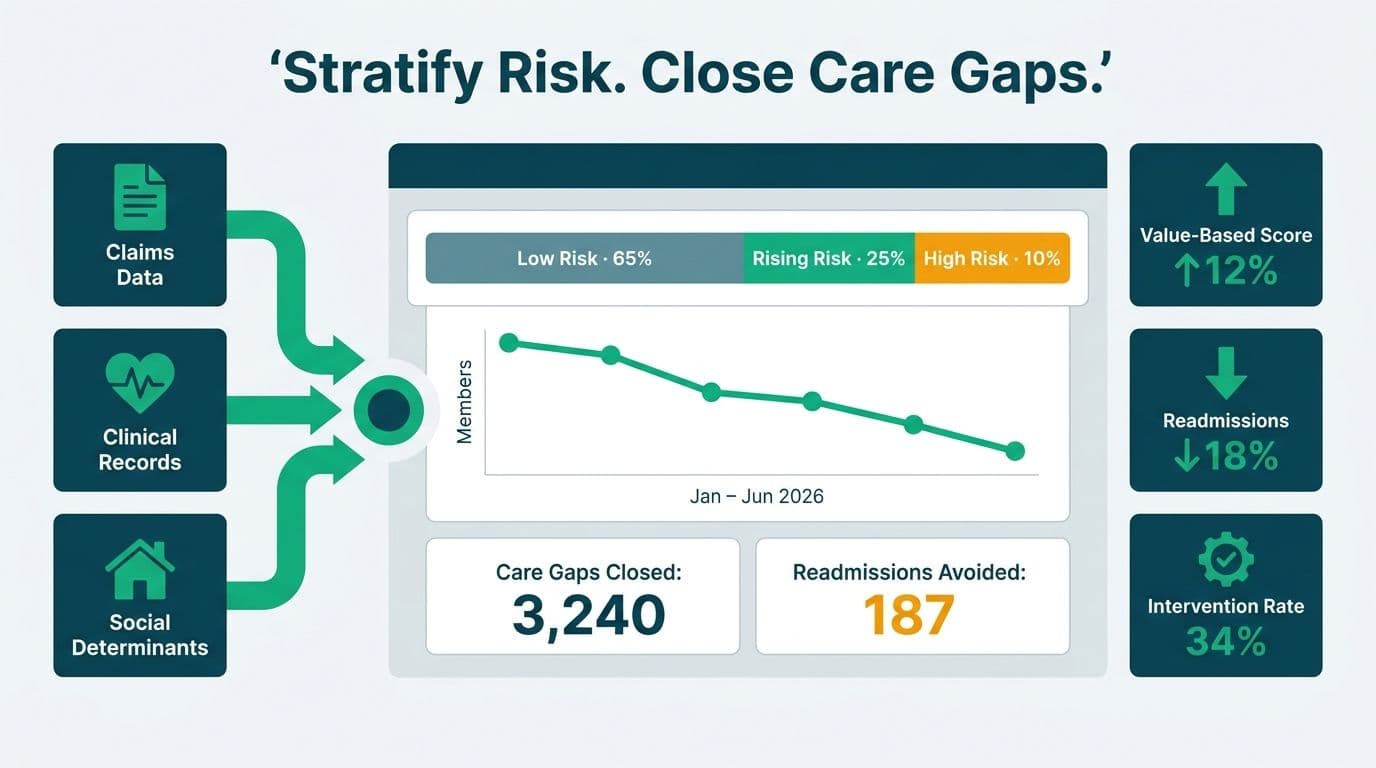
A population health management dashboard gives payers, ACOs, NHS Integrated Care Boards, and provincial health authorities a single analytical layer across claims, clinical, and social determinants data - turning fragmented records into actionable risk stratification, chronic disease tracking, and intervention prioritization. Administrators and CIOs use these dashboards to close care gaps, meet value-based contract targets, and reduce preventable admissions across their enrolled or attributed populations.
Key Takeaways
At-risk stratification - sorting members into low, rising-risk, and high-cost tiers - is the core function of any PHM dashboard and the primary cost lever for Medicare Advantage ACOs and NHS ICBs alike.
Chronic disease panels (diabetes, CHF, COPD, hypertension) drive the majority of high-cost claims; a well-built PHM dashboard surfaces care gaps at the patient level, not just the aggregate.
HIPAA row-level security in Power BI restricts sensitive PHI to authorized care team roles without requiring separate report copies.
UK NHS Integrated Care Systems and Canadian provincial health networks - including Ontario Health Teams that replaced the former Local Health Integration Networks - face structurally similar PHM challenges to US ACOs but operate under GDPR and PIPEDA respectively - dashboard architecture must reflect each jurisdiction's data governance rules.
A managed BI service typically reduces dashboard build time by months compared to in-house development and ensures ongoing compliance as regulatory frameworks evolve.
What Is a Population Health Management Dashboard?
A population health management dashboard is a real-time or near-real-time analytics environment that aggregates member or patient data across multiple sources - claims, EHR, pharmacy, lab, and social determinants of health (SDOH) - and presents it in views optimized for three decision layers: population-level trend monitoring, cohort-level care management, and individual patient outreach prioritization.
For US Medicare Advantage plans and Accountable Care Organizations, the dashboard is the operational backbone of value-based care contracts. CMS Star Ratings, HEDIS measures, and Hierarchical Condition Category (HCC) risk scores all feed into it. For UK NHS Integrated Care Systems, the governance body is the Integrated Care Board (ICB) and the equivalent accountability framework is the NHS Outcomes Framework alongside the Core20PLUS5 priority cohort methodology. For Canadian provincial health authorities - Ontario Health Teams, BC Health Authorities, Alberta Health Services - the dashboard serves population segmentation mandates under provincial funding agreements, with PIPEDA governing data handling.
What all three share is the need to move from retrospective reporting to prospective intervention: the dashboard must tell a care manager not just who was admitted last quarter, but who is likely to be admitted next month. The distinction between a static monthly report and a true PHM dashboard is interactivity, near-real-time data refresh, and the ability to drill from population aggregate to individual patient risk profile in a single click.
For healthcare teams building this infrastructure on Power BI, our Managed Power BI for healthcare teams covers the full pipeline from claims data ingestion through HIPAA-compliant report distribution and ongoing dashboard maintenance.
What Data Sources Feed a Population Health Management Dashboard?
The answer depends on the organization type, but five source categories appear in virtually every PHM implementation:
Claims and eligibility data - adjudicated medical, pharmacy, and dental claims provide the longitudinal cost and utilization spine. For Medicare Advantage plans, CMS Encounter Data and Part D files are the authoritative source; for NHS ICBs, Secondary Uses Service (SUS) data serves the equivalent function.
Electronic Health Record (EHR) extracts - clinical data including diagnoses, lab results, vitals, care plans, and problem lists from HL7 FHIR or HL7 v2 feeds fills the gaps claims data cannot capture: undiagnosed conditions, unreported preventive services, and clinical context that pure encounter data obscures.
Pharmacy and lab data - medication adherence and lab trend data (HbA1c trajectories, LDL panels, eGFR series) are the leading indicators for chronic disease deterioration. A diabetic patient whose HbA1c has risen across three consecutive quarterly labs is not yet a high-cost claimant - but will be absent early intervention.
Social determinants of health (SDOH) - housing instability, food insecurity, and transportation barriers predict readmission risk independent of clinical severity. CMS has mandated SDOH screening using Z codes in ICD-10-CM for many value-based care programs; NHS ICBs use the Core20PLUS5 framework to identify the most deprived 20% of their population; Canadian provincial programs increasingly integrate Statistics Canada community deprivation indices alongside clinical data.
Provider and care team data - attribution logic, primary care assignment, and care manager caseload data feed workload distribution views used by operations leadership and medical directors.
For a technical walk-through of how Power BI handles complex clinical data alongside operational metrics, see our guide on Hospital Patient Flow & Bed Capacity Dashboard in Power BI.
How Do Payers and ACOs Use Risk Stratification in a Population Health Management Dashboard?
Risk stratification is the process of segmenting a population into tiers - typically low, rising-risk, medium, and high - based on predicted future cost or clinical deterioration. It is the primary use case payers and ACOs build PHM dashboards to serve.
The dominant stratification model in US Medicare Advantage is the CMS-HCC (Hierarchical Condition Category) risk adjustment model. Each member receives a Risk Adjustment Factor (RAF) score derived from their diagnoses in the preceding plan year; higher RAF scores indicate higher predicted cost and attract higher capitation payments from CMS. An ACO's PHM dashboard should surface:
Members whose RAF scores have dropped year-over-year, indicating under-coding or unaddressed care gaps
Members in rising-risk tiers who have not had a comprehensive annual wellness visit in the current contract year
Members with multiple HCC conditions but low pharmacy adherence, measured by Proportion of Days Covered (PDC)
Members with recent ED visits who lack a post-discharge primary care follow-up within seven days
A well-configured PHM dashboard in Power BI presents a stratification waterfall - a visual showing the population moving between risk tiers quarter over quarter - alongside a care gap heatmap by attributed primary care physician. This creates a daily operational cadence for care managers, replacing the monthly flat report with a live work queue.
UK NHS ICBs perform structurally similar segmentation, though the vocabulary differs. NHS England uses the Combined Predictive Model (CPM) and practice-level scoring tools to assess GP-registered patients on unplanned admission risk. An ICB spanning multiple GP practices might segment patients into Routine, Enhanced, and Intensive Case Management tiers aligned to NHS England's Personalised Care framework and Core20PLUS5 priorities.
Canadian provincial health authorities - particularly in Ontario under the Ontario Health Team model - use the Adjusted Clinical Groups (ACG) system alongside provincial OHIP claims data to stratify their registered populations. In British Columbia, the Ministry of Health's data residency requirements and PIPEDA consent frameworks affect how patient-level stratification data flows into analytics environments and who can access individual risk profiles.
What Chronic Disease Metrics Belong in a Population Health Management Dashboard?
Chronic disease panels account for the majority of high-cost, high-utilization cases in any payer or health authority population. Six chronic disease KPIs should appear in every PHM dashboard implementation:
| Metric | US Medicare Context | UK NHS Context | Canadian Context |
|---|---|---|---|
| HbA1c control rate (diabetes) | HEDIS CDC measure | QOF DM019 indicator | Provincial lab data |
| Hypertension control rate | HEDIS CBP measure | QOF HYP007 indicator | OHIP claims + lab |
| 30-day CHF readmission rate | CMS HRRP measure | NHS Outcomes Framework | Hospital Morbidity DB |
| COPD exacerbation rate | HEDIS PCE measure | QOF COPD009 indicator | Provincial DAD data |
| Medication adherence (PDC) | Part D claims data | NHS BSA prescribing data | Provincial drug plans |
| Care gap closure rate | HEDIS composite | QOF composite | Provincial programs |
The Proportion of Days Covered (PDC) metric deserves special attention. CMS Star Ratings include PDC measures for diabetes, hypertension, and cholesterol medications, and a plan's Stars rating directly determines its quality bonus payments from CMS. A PHM dashboard that surfaces low-PDC members by care manager assignment creates an actionable daily work queue - not just a quarterly compliance report. Care managers can see which of their attributed members fall below the 80% PDC threshold and prioritize outreach before those members become high-cost claimants.
Beyond clinical KPIs, PHM dashboards for chronic disease management should include cost and utilization panels: emergency department visit rates per 1,000 members, specialist referral rates, pharmacy spend per member per month (PMPM), and total medical expense (TME) versus contract budget. These financial views are the layer payer finance teams and ACO CFOs rely on most heavily for value-based contract performance management.
For healthcare teams exploring how AI-assisted care gap identification fits into these workflows, our article on AI Workflow Automation for Healthcare Operations (2026) covers how to layer intelligent automation into the care management process without introducing additional compliance risk.
Population Health Management Dashboard Examples: ACO, ICS, and Canadian Health Network Views
Concrete population health management dashboard examples help care analytics teams understand how abstract KPIs translate into daily operational interfaces. US Accountable Care Organizations, UK Integrated Care Systems, and Canadian regional health networks each use distinct visualization patterns that reflect their funding models and accountability frameworks.
US ACO dashboard example - Medicare Shared Savings Program:
A typical MSSP ACO dashboard opens on a stratification summary tile showing attributed lives segmented into four risk tiers, with a quarter-over-quarter migration waterfall beneath it. A chronic-disease prevalence panel displays the percentage of the attributed population carrying active diabetes, CHF, COPD, and hypertension diagnoses, alongside a preventive-care gap tracker showing which members lack the HEDIS-required services - annual HbA1c test, retinal exam, nephropathy screening - in the current measurement year. A high-risk patient queue surfaces members in the top two risk tiers with a recent ED visit and no scheduled PCP follow-up, presented as a sortable table assigned to care managers by attributed physician. RAF score change alerts flag members whose diagnosis coding has declined year-over-year, indicating potential revenue risk under the HCC model.
UK ICS dashboard example - NHS Integrated Care Board:
An ICS dashboard built for an NHS ICB typically anchors on the Core20PLUS5 cohort view: a map overlay showing chronic-disease prevalence (diabetes, hypertension, severe mental illness) by GP practice area with deprivation decile shading. Preventive care gap panels track flu vaccination uptake, bowel cancer screening compliance, and cardiovascular disease risk assessment completion - broken down by practice and ethnicity category in line with Core20PLUS5 equity objectives. High-risk patient identification uses the NHS Combined Predictive Model score to surface GP-registered patients with a high probability of unplanned admission in the next 12 months, displayed as a prioritized caseload for community nursing and social prescribing teams.
Canadian health network dashboard example - Ontario Health Teams and former Local Health Integration Networks:
Ontario's 14 Local Health Integration Networks (LHINs) were the primary regional planning and funding bodies until 2021, when they were replaced by 51 Ontario Health Teams (OHTs) under the Connecting Care Act. The dashboard pattern that emerged from LHIN-era analytics persists in OHT implementations: a population segmentation panel built on the ACG system shows chronic-disease prevalence across the registered population, with separate tiles for diabetes prevalence, hypertension rates, and mental health diagnosis density by Forward Sortation Area (FSA). Preventive care gap tracking uses OHIP billing data to identify members who have not had a colorectal cancer screening, mammogram, or recommended immunization within the guideline interval. High-risk patient identification surfaces the top ACG-scored decile with recent emergency department visits, feeding a care coordinator assignment queue. British Columbia Health Authorities and Alberta Health Services follow structurally similar patterns using their respective provincial claims datasets and PIPEDA-compliant data sharing agreements.
How Do NHS ICBs and Canadian Health Authorities Configure PHM Dashboards Differently?
NHS Integrated Care Boards operate under a fundamentally different incentive structure than US MA plans. ICBs receive block funding and are accountable to NHS England for population health outcomes against the NHS Outcomes Framework rather than collecting per-member capitation. This shifts the dashboard's primary KPIs:
Avoidable emergency admissions per 100,000 population - a core ICB accountability metric under NHS planning guidance
Elective waiting list penetration by priority tier (P1 through P4 under NHS England RTT standards)
Healthy life expectancy gap across deprivation deciles, aligned to Core20PLUS5
Vaccination and screening uptake by ward, GP practice, and demographic group
An ICB dashboard built on Power BI must respect NHS Data Security and Protection Toolkit (DSPT) requirements, which mandate data residency within UK data centers. Microsoft Azure UK South and UK West regions satisfy this requirement. GDPR additionally requires that any patient-level data used in analytics be covered by a Data Protection Impact Assessment (DPIA) and that data minimization principles apply - meaning the dashboard should present aggregated or pseudonymized data at the analyst tier, with patient-identifiable records restricted to clinical roles via row-level security.
Canadian provincial health authorities face a parallel but distinct governance regime. Ontario's Personal Health Information Protection Act (PHIPA) and PIPEDA at the federal level require explicit consent for secondary use of personal health information. A provincial health authority in British Columbia would need to ensure its PHM dashboard data pipeline carries Ministry of Health data sharing agreements and that access logs satisfy OIPC audit requirements. In Power BI, this means workspace-level audit logging through Microsoft Purview and RLS profiles mapped to provincial role definitions.
For a practical treatment of how GDPR-compliant BI architecture applies to analytics environments - useful for NHS and European health system readers building PHM infrastructure - see GDPR Compliant SaaS Financial Reporting: The BI Checklist.
How Do You Build a HIPAA-Compliant PHM Dashboard in Power BI?
Building a HIPAA-compliant population health management dashboard in Power BI requires four architectural controls that map directly to the HIPAA Security Rule's Technical Safeguards (45 CFR 164.312):
1. Data residency and encryption - PHI must reside in a Microsoft Azure region covered by your Business Associate Agreement (BAA) with Microsoft. Microsoft's BAA for Power BI Premium and Microsoft Fabric covers US Azure regions and encrypts data at rest using AES-256 and in transit using TLS 1.2 or higher (Microsoft, 2026).
2. Row-level security (RLS) - Role-based data access is the most common PHM compliance gap in practice. A care manager should see only their attributed panel; a medical director should see the full ACO population; a payer auditor should see aggregated-only data. Power BI's dynamic RLS allows a single dataset to serve all three roles without maintaining separate report copies. For a detailed comparison of RLS approaches against legacy BI security models, see Cognos Security Model vs Power BI RLS: Side-by-Side Mapping.
3. Audit logging - HIPAA's audit control requirement (45 CFR 164.312(b)) mandates logging who accessed PHI and when. Power BI's activity log, surfaced through the Power BI REST API or Microsoft Purview, captures report access events, export events, and dataset refreshes with user principal name and timestamp.
4. Minimum necessary standard - The HIPAA minimum necessary rule limits analytics access to the PHI needed for the specific purpose. In PHM dashboards, this typically means cohort-level aggregates for operational reports and a role elevation step for individual patient drill-downs containing direct identifiers.
These same four controls - with GDPR's data minimization principle mapped to minimum necessary, and PIPEDA's accountability principle mapped to audit logging - apply across UK NHS and Canadian provincial PHM deployments respectively. The architecture is jurisdiction-portable; the configuration details differ by market.
Build vs. Buy vs. Managed Service for a PHM Dashboard
Healthcare organizations evaluating a PHM dashboard implementation typically face three paths:
| Approach | Typical Timeline | Compliance Overhead | Best Fit |
|---|---|---|---|
| Build in-house | 9-18 months | Full team responsibility | Large IDNs with dedicated BI engineering staff |
| Buy a PHM vendor platform | 3-6 months to deploy | Vendor BAA, limited customization | Mid-size MA plans needing off-the-shelf HEDIS reporting |
| Managed BI service on Power BI | 6-12 weeks for MVP | Shared responsibility model | ACOs, ICBs, and provincial authorities needing flexible analytics |
The managed service path has become the most common entry point for ACOs with fewer than 50,000 attributed lives and for NHS ICBs standing up their first system-level analytics capability. The combination of Power BI's native HIPAA and GDPR controls with a managed service layer that handles data engineering, RLS configuration, and compliance documentation addresses the resource gap most mid-market health organizations face.
The key differentiator between an in-house build and a managed service is ongoing governance work: schema migrations as CMS updates HCC model versions, QOF indicator revisions from NHS England, and Power BI platform updates that require RLS re-validation. A managed service absorbs these as routine maintenance; an in-house team must staff for them explicitly. For ACOs and ICBs operating on thin administrative margins, that staffing cost frequently exceeds the managed service fee.
---
About Lets Viz: Lets Viz has delivered data analytics and business intelligence solutions since 2020 for clients across US healthcare (HIPAA), UK fintech (GDPR), Canadian manufacturing (PIPEDA), and global SaaS - earning a 5.0 rating on Clutch. Our healthcare practice specializes in Power BI implementations for Medicare Advantage ACOs, hospital systems, and integrated care organizations where regulatory compliance and clinical usability must coexist.
Ready to scope your population health management dashboard? Managed Power BI for healthcare teams covers the full stack - from claims data modeling through HIPAA-compliant report distribution - designed for health plans, ACOs, NHS ICBs, and integrated care organizations.