How to Migrate from Excel to Zoho Analytics
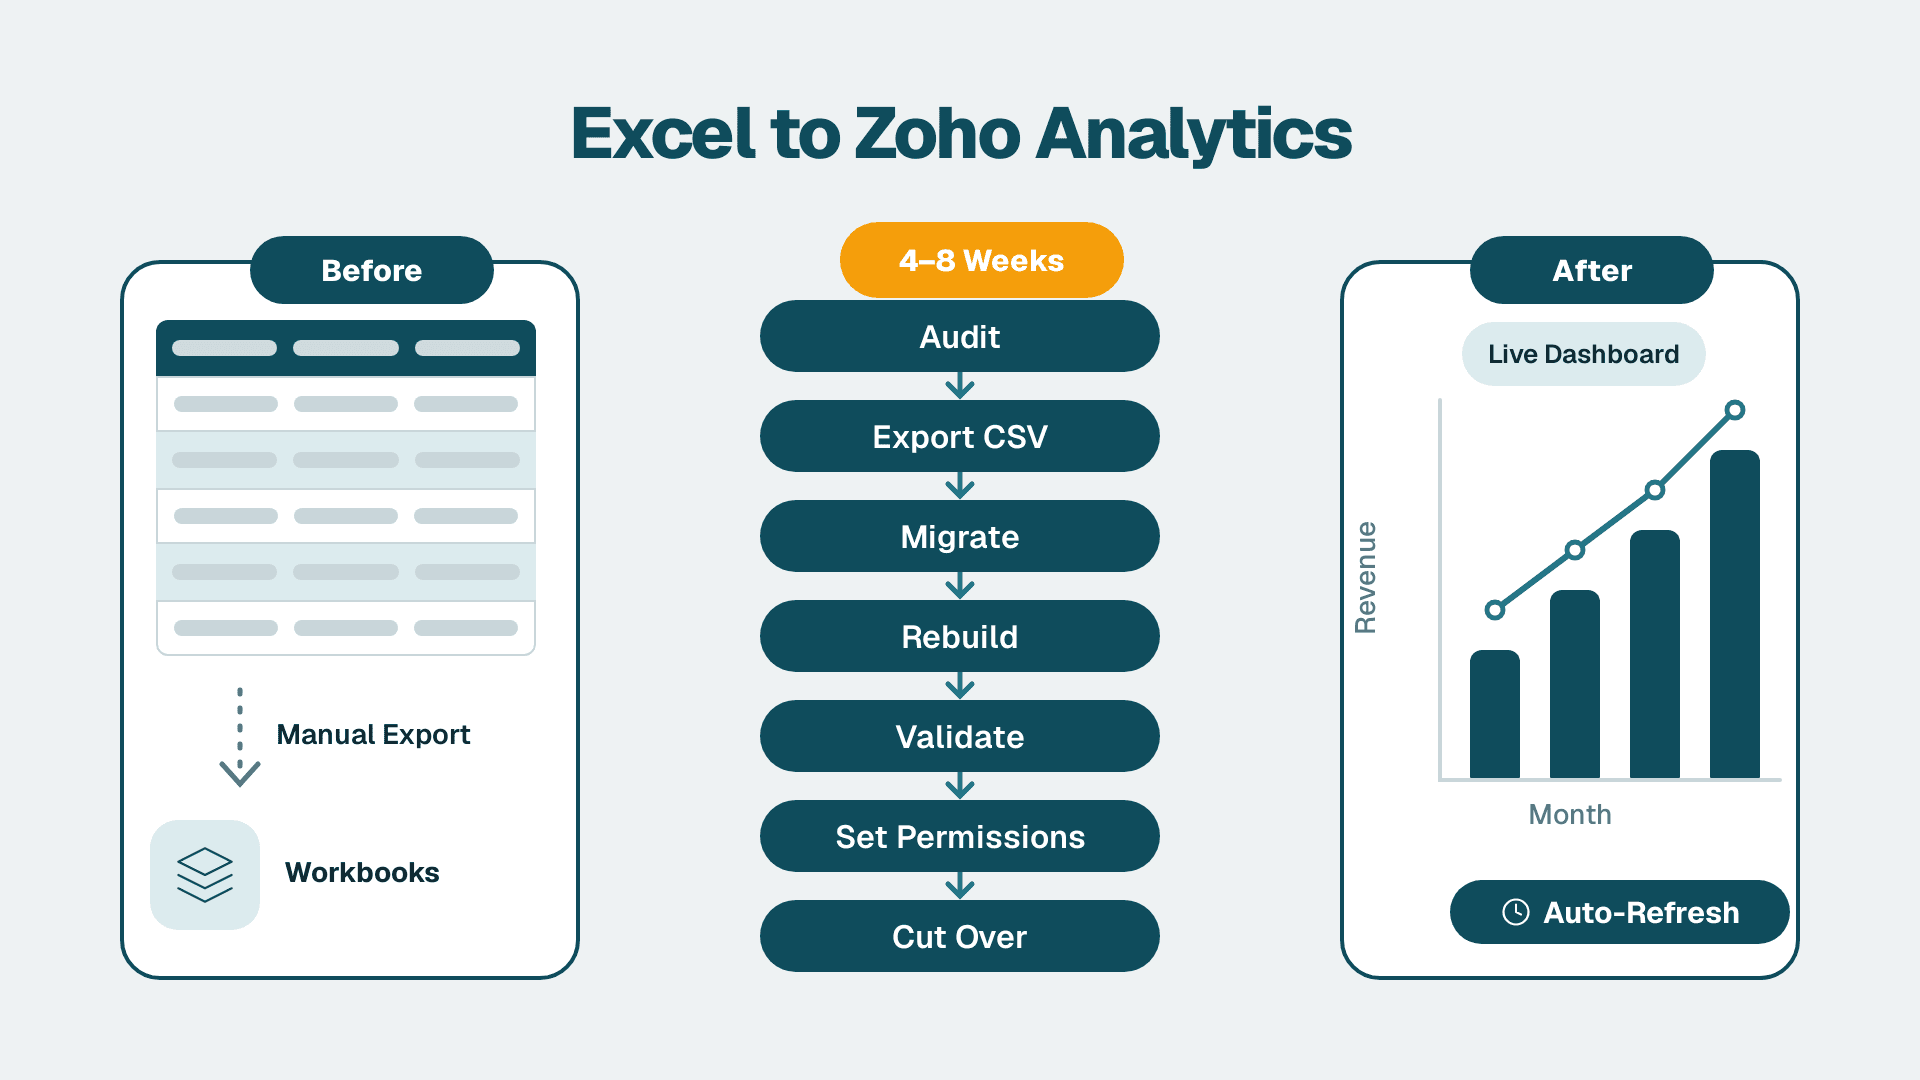
Migrating from Excel to Zoho Analytics takes four to eight weeks for most small businesses, depending on how many spreadsheets you are consolidating. By the end of this guide you will have a live workspace connected to your data sources, validated reports that match your existing Excel outputs, and an automated refresh schedule - no more manual file exports.
What You'll Need
Zoho Analytics access - standalone plan (Basic tier or above) or a Zoho One subscription, which bundles Zoho Analytics with CRM, Books, Desk, and Creator. If your team is already on Zoho One, Analytics is included at no extra per-app charge; confirm your plan tier covers the row count you need under Admin Panel > Subscriptions.
Admin or Owner role in Zoho Analytics - required to create workspaces and configure connectors.
Every Excel workbook that feeds reports you plan to replace. Categorize each sheet as raw data, calculated output, or display view before starting.
Source system credentials - if your Excel files are exports from Zoho CRM, Books, or Desk, you will connect those directly rather than uploading CSVs.
A list of report consumers - names and emails of everyone who currently opens these files.
One week of parallel run time blocked in your calendar before decommissioning Excel.
Step 1: Audit Your Workbooks and Build a Mapping Document
Open each workbook and classify every sheet into one of three types:
1. Raw data table - rows and columns, one fact per row. This becomes a Zoho Analytics table.
2. Calculated layer - VLOOKUP assemblies, pivot summaries, running totals. This moves to a query table or formula column.
3. Output view - formatted for print, email, or a meeting. This becomes a dashboard.
Create a mapping document - a new Excel sheet works fine - with these columns: Sheet Name, Type, Row Count, Key Columns, Destination Name (table, query, or dashboard).
Pay close attention to date columns. Excel stores dates as serial numbers; locale settings determine whether the export reads as `1/15/26`, `Jan 15 2026`, or `2026-01-15`. Standardize every date column to ISO format (`YYYY-MM-DD`) and reformat in Excel before exporting anything.
What you should see: Every sheet in the workbook has a destination. Anything still marked TBD is probable scope creep - exclude it from this migration cycle.
Step 2: Export Raw Data Sheets to Clean CSVs
For each raw data sheet:
1. Remove merged cells, any extra header rows above the column header, and grand-total rows appended at the bottom.
2. Go to File > Save As and select CSV UTF-8 (Comma delimited). Avoid "CSV (MS-DOS)" - it corrupts special characters in names, addresses, and product fields.
3. Open the file in a plain text editor and confirm: column headers on row 1, data starting on row 2, no blank rows in the body.
4. Name each file to match its Destination Name from your mapping document.
Skip this step for data that lives natively in Zoho CRM, Zoho Books, or Zoho Desk - those connect directly in Step 3 without a CSV intermediary.
What you should see: A folder of clean CSVs, one per raw data sheet, with consistent ISO dates and no stray rows.
Step 3: Migrate Your Excel Data to Zoho Analytics
1. Log in to Zoho Analytics and click + Create in the top-left corner.
2. Select New Workspace and name it by business unit - for example, "Finance 2026" or "Operations Dashboard".
3. Inside the workspace, click Import Data > From File > Local File and upload your first CSV.
4. On the column-mapping screen, check every detected data type. Change any Order ID or Account Number column from Number to Plain Text so leading zeros are not stripped. Click the column header to change the type.
5. Confirm First Row as Header is checked, then click Import.
6. Repeat for each remaining CSV.
For Zoho-native sources: Click Import Data > From Zoho Services, select the app (CRM, Books, Desk, or Creator), authenticate with admin credentials, and choose the module. Zoho Analytics pulls the schema automatically - no export file needed.
What you should see: Every table appears in the left sidebar named per your mapping doc. Row counts must match the source exactly. A lower count means a blank row exists in the CSV body - Zoho stops importing at the first fully blank row.
Step 4: Rebuild Calculated Logic as Query Tables and Formula Columns
Cross-sheet Excel calculations do not import - you rebuild them with two tools.
Query Tables handle multi-table joins and aggregations:
1. Click + > Query Table inside the workspace.
2. Write a SELECT statement in Zoho Analytics's MySQL-compatible SQL dialect.
3. To replicate a VLOOKUP pulling a sales rep's region into a transactions table:
```sql
SELECT t.Order_ID, t.Amount, r.Region
FROM Transactions t
JOIN SalesReps r ON t.Rep_ID = r.Rep_ID
```
4. Click Run and verify the output row count.
Formula Columns handle row-level calculations within a single table:
1. Open the table, right-click any column header, and select Add Formula Column.
2. Enter the formula in Zoho Analytics syntax. Running total example: `RUNNINGSUM("Amount")`.
Spot-check five to ten rows against your Excel source before building any reports on these tables.
What you should see: Query Tables and formula columns replicating the calculated sheets from your mapping doc, with spot-checked values confirmed against Excel.
Step 5: Build Reports and Validate Every Output Against Excel
1. Click + > Chart or + > Pivot Table to start a report.
2. Drag columns into the row, column, and values buckets - directly analogous to Excel's pivot field list.
3. Apply the same filters your Excel report used: fiscal year, region, status, or any other slice.
4. Build one report per output view in your mapping document.
Validation is mandatory before you decommission Excel. For every report, open the Excel equivalent and compare: total row count, numeric grand totals, and at least two dimension-level subtotals (one by region, one by month).
Your Excel formulas almost certainly encode hidden assumptions somewhere - find them during this comparison, not after the spreadsheet is gone.
For finance teams, Real-Time Financial Reporting Best Practices for FP&A covers the validation steps month-end close teams most commonly skip.
What you should see: Every Zoho Analytics report matches its Excel equivalent within rounding tolerance. Document any intentional calculation changes so stakeholders are not surprised.
Step 6: Configure Permissions, Sharing, and Scheduled Refresh
User permissions:
1. Click Workspace Settings > Users & Permissions > Add Users.
2. Assign roles: Viewer (read-only), Analyst (creates and edits reports), Admin (full access including table deletion). Default all new users to Viewer - Analysts can delete tables, Viewers cannot.
Sharing:
Internal users: click the dashboard, then Share > Share with Users and select by name or email.
External viewers without a Zoho account: click Share > Publish as URL and set a password.
Scheduled refresh:
CSV-based tables: click Import Data > Schedule Import, point to the file in Google Drive or a URL endpoint, and set daily or weekly frequency.
Zoho-native connectors: open the table, click Settings > Sync Frequency, and start with hourly rather than real-time until you have confirmed load performance.
If you are approaching your plan's row or user limits, this is the point to review whether the Zoho One all-employee bundle costs less than separate per-seat subscriptions. The Zoho One pricing plans are visible in Admin Panel > Subscriptions, which shows usage against your current tier. Teams already running Zoho CRM, Books, Desk, and Creator together frequently find that the Zoho One pricing breakdown for the full business reduces total cost once Analytics is included. The Zoho One admin setup guide in your Admin Panel walks through activating Analytics and adjusting org-level settings.
What you should see: All users receive invitation emails and access dashboards without your involvement. The Import History tab for each table shows green status for the most recent sync run.
Step 7: Run the Parallel Period and Cut Over
1. Run Zoho Analytics and Excel in parallel for one full reporting cycle - minimum one week, one full month for monthly-close teams.
2. Have at least one report consumer compare Zoho Analytics numbers against the Excel output they would normally use.
3. Log every discrepancy in your mapping document and resolve each one before the cutover date.
4. On cutover day, rename Excel files with an `_ARCHIVED_YYYYMMDD` suffix and move them to a read-only folder. Do not delete them - they are your audit trail for any future question.
5. Send report consumers a short message with a direct link to the live dashboard.
What you should see: Zero requests in the first two weeks that require opening an archived Excel file to answer. If any arise, add the missing view to the dashboard before calling the migration complete.
Realistic Migration Timelines
1-10 person team, under 5 workbooks: Two to three weeks, one person part-time.
10-50 person team, 5-20 workbooks, one Zoho source app: Four to six weeks, one analyst full-time.
50+ person team, multiple Zoho apps, cross-functional reporting: Eight to twelve weeks, requires a Zoho One admin setup pass at the org level and stakeholder sign-off at each stage.
Teams under compliance frameworks - healthcare organizations configuring Zoho One for HIPAA and GDPR data handling, or Canadian businesses applying PIPEDA controls - should add two to three weeks before the parallel period to configure data residency, audit log retention, and field-level access. Zoho's official compliance documentation (updated 2026) specifies exact settings for each framework.
If you are rolling out other parts of the Zoho suite alongside this migration, Top 7 Zoho Apps Businesses Underuse identifies the highest-value quick wins to stack with the Analytics cutover rather than tackle separately.
Common Mistakes
Importing calculated columns as static data. A "Gross Margin %" column that was formula-driven in Excel imports as a frozen snapshot and never updates when underlying costs change. Strip all calculated columns from the CSV and rebuild them as formula columns inside Zoho Analytics.
Skipping date format standardization. Mixed formats in a single column cause Zoho Analytics to treat it as Plain Text, which breaks every date filter, grouping, and trend chart built on that table across every report.
Enabling real-time sync before load testing. High-frequency syncs on large datasets slow dashboard load. Start at hourly and reduce the interval only after confirming response times are acceptable under normal usage.
Not checking row limits before a large import. Plan tiers cap total rows across all tables in a workspace. A partial import completes silently and your reports query incomplete data with no error shown. Check current usage at Workspace Settings > Usage before uploading large datasets.
Assigning Analyst role by default. Analysts can delete tables and query tables. Viewer is the safe default for anyone who only needs to read reports.
Troubleshooting
Imported table has fewer rows than the source CSV. Likely cause: a blank row inside the CSV body. Open the file in a text editor, find lines containing only commas (e.g., `,,,,`), delete them, and re-import.
Date filter returns no results despite a populated date column. Likely cause: the column imported as Plain Text. Right-click the column header, select Change Data Type > Date, choose the format matching your data, and confirm. Zoho Analytics re-parses all existing values.
Zoho CRM connector shows "Authorization Error" after weeks of normal operation. Likely cause: the OAuth token for the authenticating user expired, or that user's CRM role changed. Go to Import Data > Zoho CRM > Edit Connection > Re-authorize and re-authenticate with an admin-level CRM user to reduce future recurrence.
---
When your migration spans many workbooks, multiple Zoho apps, or requires a compliance configuration before go-live, working with a specialist cuts the timeline significantly. Our Zoho consulting services team has run this migration for operations and finance teams across retail, professional services, and healthcare - book a scoping call for a fixed-scope estimate and an honest view of whether this is a self-service job or one that needs hands-on support. You can also Try Zoho Analytics free to evaluate the platform before committing to a full migration.
---
About Lets Viz: Lets Viz has delivered analytics and business intelligence projects since 2020, serving SMBs across retail, professional services, healthcare, and the Zoho ecosystem. Our team holds a 5.0 rating on Clutch, earned across Zoho Analytics migrations, automated month-end close implementations, and Power BI infrastructure engagements. We work only with tools we run in production - the steps in this guide reflect real migrations, not vendor documentation paraphrasing.