Order Entry Automation ROI: The Formula That Shows Payback
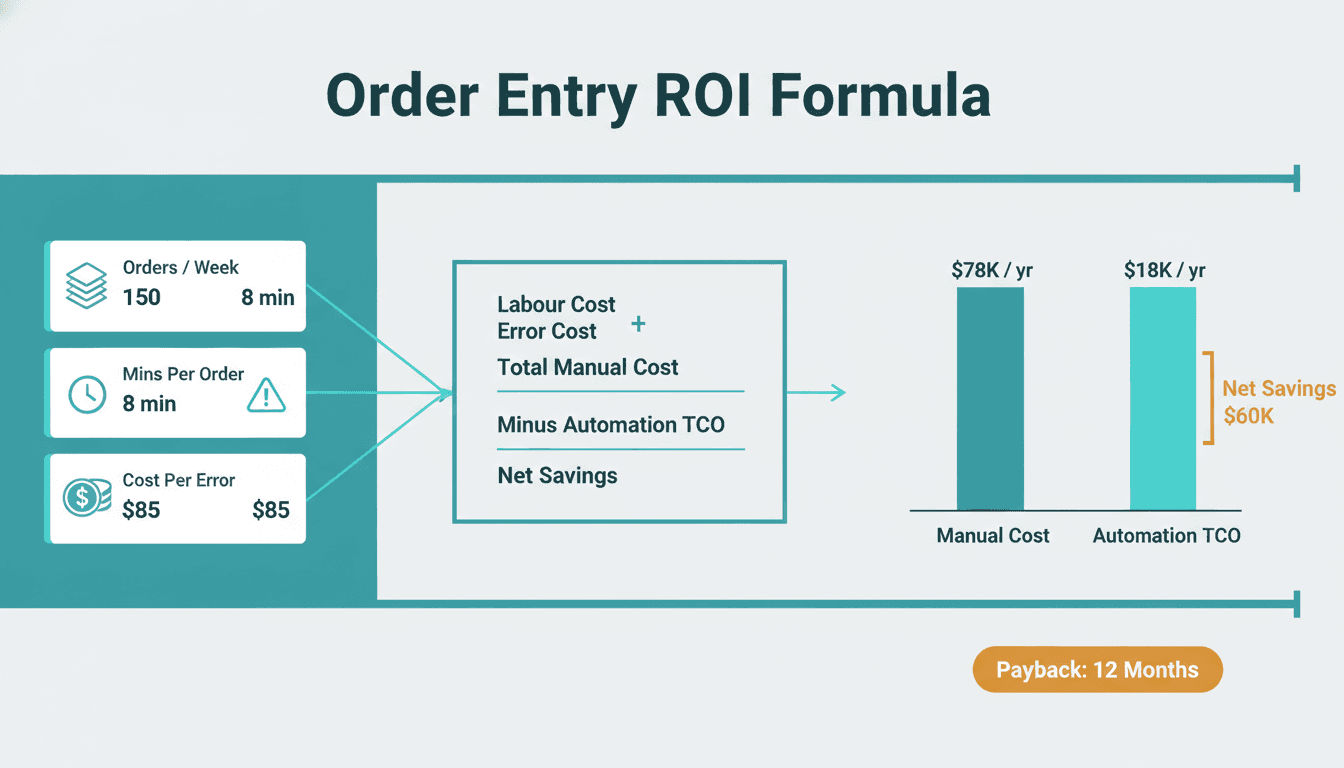
Order entry automation ROI is calculated by comparing the annual cost of manual re-keying - labour, errors, and delays - against the total cost of ownership of an automated workflow. For most wholesale distributors and 3PLs processing 100 or more orders per week, payback arrives within 12 months. The formula below makes every assumption explicit: replace the defaults with your own figures and the output changes immediately.
Key Takeaways
- Four inputs drive the model: orders per week, minutes per manual order, error rate, and cost per mis-keyed order.
- Labour savings alone often understate the true benefit - error-avoidance penalties frequently match or exceed them.
- Payback period is more sensitive to your error-cost assumption than to headcount; validate that number first.
- Order volume is the most elastic variable - a 50 percent drop more than doubles the payback period.
- A structured AI readiness assessment (fixed price, 5 days) before you build prevents the most common failure mode: automation layered on top of messy input data.
What Is the Order Entry Automation ROI Formula?
The calculation has two benefit streams and one cost stream. Run all four steps in sequence.
Step 1 - Annual Labour Saving
```
Annual Labour Saving =
Weekly Orders
x Minutes Per Manual Order
x 52 weeks
x Fully Loaded Labour Rate (per hour)
/ 60
```
Step 2 - Annual Error-Avoidance Saving
```
Annual Error Saving =
Weekly Orders
x 52 weeks
x Manual Error Rate (as decimal)
x Fully Loaded Cost Per Error
```
Step 3 - Total Annual Benefit
```
Total Annual Benefit = Labour Saving + Error Saving
```
Step 4 - ROI and Payback Period
```
ROI (%) = (Total Annual Benefit - Total Cost of Ownership)
/ Total Cost of Ownership x 100
Payback (months) = Total Cost of Ownership
/ (Total Annual Benefit / 12)
```
Year-1 Total Cost of Ownership (TCO) = implementation cost plus first-year licence and maintenance. From Year 2, TCO drops to the recurring licence only, which is why ROI improves sharply after the first year.
Editable Assumption Inputs
Adjust every row to your operation. Defaults reflect mid-market US wholesale distribution.
| Input | Conservative | Mid-Market | High-Volume |
|---|---|---|---|
| Orders per week | 150 | 300 | 500 |
| Minutes per manual order | 4 | 7 | 8 |
| Fully loaded labour rate | $28/hr | $35/hr | $40/hr |
| Manual error rate | 1.5% | 3.0% | 4.0% |
| Cost per mis-keyed order | $50 | $120 | $150 |
| Implementation cost | $15,000 | $30,000 | $45,000 |
| Annual licence + maintenance | $4,000 | $8,000 | $15,000 |
Mid-Market Worked Example (300 orders/week)
- Annual Labour Saving = 300 x 7 x 52 x $35 / 60 = $63,700
- Annual Error Saving = 300 x 52 x 0.03 x $120 = $56,160
- Total Annual Benefit = $119,860
- Year-1 TCO = $30,000 + $8,000 = $38,000
- ROI = 215% | Payback = 3.8 months
For an interactive version, use the project cost calculator to model your own inputs. These outputs are directionally useful, not guaranteed - accuracy depends entirely on how carefully you measure error rate and error cost.
How Do You Measure the Labour Hours That Automation Recaptures?
Capture handling time by timing three to five real order-entry cycles from the moment the incoming order is opened to the save confirmation in your ERP or WMS. Include every step: reading the email or PDF, switching screens, keying SKUs and quantities, confirming pricing, and saving. Teams routinely underestimate this figure by 30 to 40 percent because tab-switching and ERP load time is invisible until measured.
Use fully loaded rate, not base wage. Fully loaded rate includes employer payroll taxes, benefits, and overhead. In the US, this is typically 1.25 to 1.35 times base wage; in Canada and the UK the multiple shifts slightly due to different employer contribution structures. Using base wage alone understates the labour saving by the same ratio.
A Canadian distributor processing 200 orders per week at a 6-minute average cycle spends roughly 1,040 hours per year in pure entry labour - approximately CAD $43,680 at a CAD $42 fully loaded rate, before any error cost. For operations subject to PIPEDA, automating order entry also reduces human touchpoints on customer records, strengthening data-minimisation compliance.
A comparable UK 3PL at the same volume but an 8-minute cycle at £30/hr spends roughly £41,600 annually in entry labour. GDPR data-minimisation obligations apply the same logic: fewer hands on order data means a smaller audit surface for the data protection officer.
What Does a Mis-Keyed Order Actually Cost?
Cost per error is the most consequential and most underestimated input. Most operations managers think of rework time - 20 to 40 minutes to locate and fix the wrong SKU. That is only the first layer.
Five components make up the true cost:
1. Rework labour - finding, correcting, and notifying: 20 to 45 minutes at fully loaded rates.
2. Carrier or customer chargebacks - a short-ship, wrong address, or incorrect NMFC code triggers a trading-partner penalty. In US wholesale distribution, chargeback programmes impose fixed fees per compliance failure, sometimes with escalation tiers.
3. Expedite and re-ship cost - when a mis-keyed order causes a delivery miss, expedite cost frequently exceeds the original order margin.
4. Inventory write-down - a quantity error reaching the warehouse before discovery can require a physical count or adjustment.
5. Compliance risk - in food, pharma, or hazmat categories, a mis-keyed lot number or dangerous-goods class creates documentation exposure that is costly to unwind.
The most reliable way to set this input: pull three months of credit memos, chargebacks, and re-ship records tied to entry errors, divide by incident count, and use the average. If that data does not exist, $120 is a reasonable starting point for general US distribution. Freight brokerages dealing with carrier invoice disputes should model $175 to $200.
When we parsed six sample invoices across five carrier partners for a logistics client, we found a 2.86x surcharge overcharge on one lane - the kind of discrepancy that stays invisible as long as staff are re-keying rather than comparing structured data. That single finding justified automating the entire freight-invoice reconciliation workflow.
For teams questioning whether their ERP data is clean enough to drive reliable automation - the central issue in ERP data readiness for AI automation - the AI readiness assessment (fixed price, 5 days) surfaces those gaps in five working days, before any code is written.
How Do You Build a Payback Period Model by Scenario?
Payback period is Year-1 TCO divided by monthly benefit. Two costs are consistently missed: integration development (a custom API bridge for mid-market ERP platforms adds $5,000 to $20,000) and a ramp-up curve (model 75 percent efficiency in Month 1, 90 percent in Month 2, 100 percent from Month 3 onward).
Payback Period by Volume Scenario
| Scenario | Orders/Week | Annual Benefit | Year-1 TCO | Payback |
|---|---|---|---|---|
| Conservative | 150 | $20,410 | $19,000 | 11.2 months |
| Mid-market | 300 | $119,860 | $38,000 | 3.8 months |
| High-volume | 500 | $294,667 | $60,000 | 2.4 months |
At conservative volumes, the payback case rests heavily on error cost. If error-related costs are low and volume is under 150 orders per week, a partial automation targeting only the highest-error order types - emailed orders from un-integrated customers, for example - often returns faster than a full end-to-end deployment.
Sensitivity Analysis: Which Input Moves the Order Entry Automation ROI Most?
Order volume is the most elastic variable in the payback model. Holding all mid-market defaults constant and varying one input by 50 percent isolates which assumption carries the greatest estimation risk.
| Input Varied | -50% Value | Payback | Baseline | Payback | +50% Value | Payback |
|---|---|---|---|---|---|---|
| Orders per week | 150/wk | 7.6 mo | 300/wk | 3.8 mo | 450/wk | 2.5 mo |
| Minutes per order | 3.5 min | 5.2 mo | 7 min | 3.8 mo | 10.5 min | 3.0 mo |
| Error rate | 1.5% | 5.0 mo | 3.0% | 3.8 mo | 4.5% | 3.1 mo |
| Cost per error | $60 | 5.0 mo | $120 | 3.8 mo | $180 | 3.1 mo |
A 50 percent drop in weekly volume more than doubles the payback period (3.8 to 7.6 months), while the same swing in error rate or cost per error shifts payback by less than two months. Error rate and error cost are equally elastic because they multiply - a 50 percent underestimate in one is equivalent to a 50 percent underestimate in the other.
For US wholesale distributors and Canadian manufacturing supply chains where order volume is seasonal, run both a steady-state and a peak-season scenario. Peak-season ROI can be two to three times the off-season figure, which changes the framing of the business case significantly.
When Does Order Entry Automation ROI Turn Negative?
Three scenarios where the case is structurally weak:
1. Fewer than 75 to 100 orders per week with low error rates - annual labour savings rarely exceed $8,000, making it difficult to recover a $15,000+ implementation cost within 12 months.
2. Orders already arrive as structured EDI - standard 850 PO transactions loading directly into your ERP without human review are already automated for that channel. The ROI formula applies only to unstructured channels: email, PDF, and web portals.
3. Automation solves the wrong problem - when entry errors trace back to bad customer master data (wrong pricing tiers, discontinued SKUs, duplicate accounts) rather than keying mistakes, automation propagates bad data faster. Understanding AI agents vs rule-based automation before choosing an approach prevents building the wrong solution for the wrong root cause.
For teams evaluating the full back-office opportunity - including invoice matching and month-end reporting - the article on automating month-end financial close with AI tools applies the same ROI framework to finance workflows.
AI automation for SMEs in the 20 to 100 employee bracket typically starts with lightweight RPA or a low-code workflow platform rather than full ERP integration. For operations running an integrated stack - Zoho One, for example, bundles CRM, inventory, finance, and automation tools in a single environment - order entry automation frequently begins as a no-code workflow. Building an approval workflow in Zoho Creator walks through one practical starting point for routing flagged entries through a structured review queue before they reach the ERP.
---
About Lets Viz: Lets Viz has delivered data automation and analytics solutions to clients across US healthcare, UK fintech, Canadian manufacturing, and global SaaS since 2020. Our team holds a 5.0 Clutch rating and specialises in transforming back-office workflows - order entry, invoice matching, and financial reporting - from manual re-keying to structured, auditable data pipelines.
---
If you want to know whether your order entry or invoice workflows are ready to automate, and what the payback period looks like for your specific volume and error profile, the AI readiness assessment (fixed price, 5 days) delivers a concrete recommendation in five working days.