Managed Power BI ROI: The CFO Business Case Guide
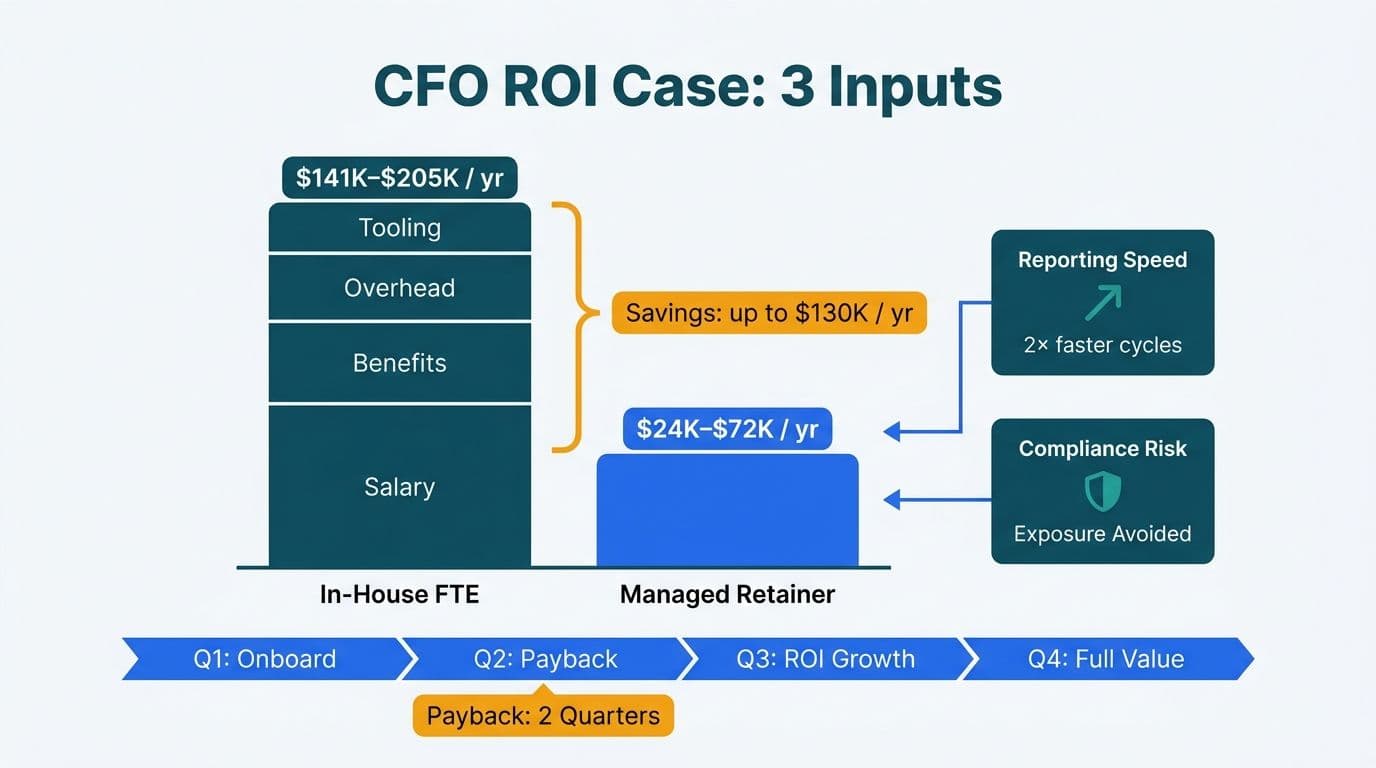
Building a managed Power BI ROI business case requires three quantifiable inputs: fully-loaded FTE cost versus a fixed-fee retainer, the revenue or cost impact of faster reporting cycles, and the financial exposure avoided by maintaining compliant data governance. When all three are modelled together, most mid-market healthcare and finance teams recover the retainer cost within the first two quarters of the engagement.
Key Takeaways
A fully-loaded Power BI analyst FTE in North America costs $141,000-$205,000 annually (salary, benefits, overhead, tooling) compared with $24,000-$72,000 for a managed retainer
Compressing monthly reporting cycles from 10-15 days to 2-3 days frees analyst capacity worth $40,000-$80,000 per year in redirected hours
Data governance outsourced through a managed Power BI provider reduces HIPAA, SOC 2, and GDPR audit exposure - a single compliance incident can exceed $500,000 in total cost
Power BI Premium per-capacity pricing favors large enterprises with 500 or more active users; managed retainers are more cost-efficient for smaller teams
A formal power bi managed service contract checklist protects both parties from scope creep and SLA ambiguity
Lets Viz delivers Managed Power BI services for healthcare and finance teams -- fully managed analytics, from data model to decision-ready dashboard.
What Does a Fully-Loaded FTE Really Cost vs. a Managed Power BI Retainer?
The most common mistake in a Power BI staffing cost comparison is using base salary alone. A fully-loaded FTE calculation must include employer payroll taxes, benefits, paid leave, hardware, software licenses, recruitment amortization, and management overhead - typically adding 40-60% above base salary in the US, UK, and Canada.
Fully-loaded Power BI FTE cost model (North America, 2026):
| Cost Component | Annual Estimate (USD) |
|---|---|
| Base salary - mid-level Power BI analyst | $85,000 - $110,000 |
| Benefits and payroll tax (40-50%) | $34,000 - $55,000 |
| Tooling: Power BI Pro/Premium, Azure | $3,000 - $8,000 |
| Training and certification | $2,000 - $4,000 |
| Recruitment amortization (3-year avg. tenure) | $5,000 - $10,000 |
| Manager oversight (10% of manager time) | $12,000 - $18,000 |
| **Total fully-loaded FTE cost** | **$141,000 - $205,000** |
Against this, a managed Power BI retainer from a specialist provider typically runs $2,000-$6,000 per month ($24,000-$72,000 annually), depending on scope - report builds, dashboard maintenance, data model updates, governance documentation, and SLA-backed support.
A US healthcare analytics team carrying two full-time Power BI contractors may be spending over $300,000 annually before Azure infrastructure costs. Consolidating to a managed retainer with clearly scoped deliverables can reduce that to under $80,000 while improving delivery consistency and governance accountability.
For a UK fintech firm, sterling salary benchmarks and employer National Insurance contributions push the fully-loaded equivalent to GBP 90,000-140,000 per analyst. A managed retainer, often priced in USD for North American providers, can represent a 40-60% cost reduction at current exchange rates - and eliminates the recruitment risk of a specialized hire in a competitive market.
How Do You Build the Managed Power BI ROI Business Case?
Managed Power BI services represent a strategic capability shift, not a commodity purchase. A credible business case for a CFO or IT director must present three financial pillars on a single page: cost delta, time-to-insight gain, and risk avoidance value.
Step 1 - Baseline your current state. Document hours spent per week on report builds, data model fixes, ad-hoc requests, and governance tasks. Multiply by blended analyst hourly cost ($65-$95/hour fully loaded in North America).
Step 2 - Quantify the retainer. Obtain a fixed monthly scope from a provider that includes deliverables, response SLAs, and out-of-scope escalation rates. Use this as your Year 1 managed cost.
Step 3 - Model time-to-insight improvement. If a finance director currently waits 12 business days for a close-cycle dashboard and a managed provider SLAs 3 business days, calculate the decision-cycle acceleration. Nine days saved per reporting period, across 12 monthly closes, equals 108 analyst-days recovered annually - time that can redirect to higher-value modeling or offset headcount growth.
Step 4 - Assign risk avoidance value. Data breaches and compliance failures carry quantifiable costs. In US healthcare, a HIPAA violation can range from $100 to $50,000 per incident under the tiered civil money penalty structure. A single reportable breach at a mid-size health system easily exceeds $500,000 in combined fines, remediation, and reputational loss. Governance controls embedded in a managed service contract reduce this exposure systematically.
For a Canadian financial services firm subject to PIPEDA, the risk value calculation must also account for mandatory privacy breach notification obligations, which can trigger regulatory review and measurable client attrition - costs that rarely appear in a spreadsheet but carry real weight in a board conversation.
How Do You Quantify Time-to-Insight Improvement?
Time-to-insight is an operational metric, not a vague benefit. The standard measurement framework counts calendar days from data availability to a signed-off dashboard or report reaching a decision-maker.
Delivery speed benchmarks for mid-market organizations (2026):
| Delivery Model | New Report Build | Incremental Changes |
|---|---|---|
| In-house team with active backlog | 10-15 business days | 4-7 business days |
| In-house team, steady state | 5-8 business days | 2-5 business days |
| Managed Power BI retainer (SLA-backed) | 5-10 business days | 1-3 business days |
For finance and healthcare teams running monthly close cycles, compressing the reporting lag by seven or more days has a compounding effect. A finance director who sees prior-month variance analysis on Day 3 rather than Day 14 can course-correct headcount spend, vendor accruals, or revenue recognition before the quarter closes.
Healthcare CFOs face structural pressure to deliver timely, accurate dashboards across value-based care contracts, payer analytics, and cost allocation - precisely where a managed Power BI environment with pre-built semantic layers and SLA commitments adds the most value.
For teams building finance-facing dashboards, our FP&A Dashboard in Power BI build guide and Healthcare KPI Dashboard examples by department provide benchmark templates that a managed provider can deliver against defined SLAs.
What Compliance Risks Does Outsourced Data Governance Address?
Data governance outsourced through a managed Power BI provider is among the most undervalued components in any ROI model - because the risk it avoids rarely appears in a budget until it materializes as an incident.
A managed provider with a documented governance framework delivers:
Row-level security (RLS) configuration - ensures users see only the data their role authorizes; critical for HIPAA-covered entities sharing clinical or claims data across departments. A managed provider also applies Microsoft Purview sensitivity labels and Power BI data loss prevention (DLP) policies, which block unauthorized export or sharing of classified datasets - a control layer that RLS alone does not cover and that auditors increasingly expect to see documented.
Audit log management - Power BI audit logs capture every export, share, and embed action; a managed service reviews these on a defined schedule and escalates anomalies
Data lineage documentation - required for SOC 2 Type II certification, which US SaaS and financial services firms increasingly need to retain enterprise clients
Retention and purge schedules - GDPR requires EU personal data to be deleted on request; PIPEDA imposes similar obligations on Canadian organizations; without a systematic process, Power BI exports create untracked copies of personal data that violate both frameworks
A US regional health system relying on informal Power BI sharing - workspaces shared by link, RLS unenforced - faces material HIPAA exposure on every dashboard export. Formalizing this through a managed service contract with documented RLS policies, workspace governance standards, and quarterly audit reviews converts an open liability into a controlled, auditable process.
For a deeper review of the specific control points that auditors examine, our AI Analytics Data Privacy Risks: Healthcare Audit Guide walks through the Power BI deployment areas most likely to fail a compliance assessment.
A UK financial services firm operating under FCA guidelines and GDPR must maintain data processing records for all analytics tools. A managed Power BI contract that includes governance documentation and a signed data processing agreement (DPA) closes that gap without requiring a dedicated data protection officer.
Power BI Premium vs Managed Service Cost: Which Fits Your Team?
The power bi premium vs managed service cost question arises whenever an IT director evaluates whether to scale internal infrastructure or externalize delivery. The right answer depends on user count, internal BI capability, and governance maturity.
Power BI Premium per-capacity (P1 SKU): approximately $4,995/month for a dedicated capacity node supporting unlimited internal report consumers - cost-effective at scale (typically 500 or more active users), but requires skilled internal admins, active governance ownership, and ongoing capacity management to avoid idle compute waste.
Power BI Premium per-user (PPU): approximately $20/user/month - practical for small teams under 50 users, but lacks the semantic model caching and deployment pipeline features that mid-market finance and healthcare teams typically require.
Managed Power BI retainer: $2,000-$6,000/month - covers delivery, governance, and support regardless of license tier, and is cost-efficient for teams of 50-300 users who need BI capability without adding permanent headcount.
The managed retainer model pairs well with Power BI Pro ($10/user/month) or Premium per-user licenses under existing Microsoft 365 agreements. The provider manages the semantic layer, publishes certified datasets, and maintains workspace governance, while the client organization handles end-user licensing through its existing volume agreement.
For teams weighing data connectivity architecture alongside cost, the Power BI Import vs DirectQuery decision guide covers the infrastructure trade-offs that affect both Premium and managed service design.
What Should a Managed Power BI Service Contract Checklist Include?
A power bi managed service contract checklist translates the business case into contractual protection. Without it, scope creep, ambiguous SLAs, and unclear handoffs erode the ROI model within the first six months.
Eight terms every contract must include:
1. Deliverable inventory - specific report builds, dashboard refreshes, and model updates included per month; extras priced at a defined hourly or project rate
2. Response and resolution SLAs - separate tiers for critical failures (data pipeline down), standard requests (new visual), and strategic work (new semantic model)
3. Governance ownership matrix - clear assignment of workspace admin, RLS policy management, and audit log review responsibility
4. Compliance obligations - explicit HIPAA Business Associate Agreement (BAA) for US healthcare clients; GDPR data processing agreement for UK and EU engagements; PIPEDA-aligned privacy provisions for Canadian organizations
5. License management scope - whether the provider advises on SKU optimization, manages procurement, or leaves licensing to the client IT team
6. IP and data ownership - explicit confirmation that all data models, DAX measures, reports, and documentation remain client property on contract end
7. Change management process - defined approval workflow for report changes that affect regulated financial or clinical reporting
8. Escalation and executive review cadence - named contacts at each tier and a quarterly business review schedule
A Canadian manufacturing company that outsourced its Power BI environment without a written IP clause discovered 18 months later that proprietary production dashboards resided on the provider's tenant. A standard managed service agreement would have prevented this entirely.
For finance teams comparing reporting tool options alongside managed delivery, the Power BI Report Builder vs Desktop: Finance Guide clarifies where managed delivery adds the most leverage in a finance reporting stack.
Is the Managed Power BI ROI Case Strong Enough for a Board?
The final test of any managed Power BI ROI business case is whether it survives board-level scrutiny. The numbers typically hold - provided they use organization-specific inputs rather than industry averages.
Year 1 summary for a representative mid-market US healthcare organization:
| ROI Line Item | Estimated Value (USD) |
|---|---|
| FTE cost avoided (2 contractors not hired) | +$280,000 |
| Managed retainer cost | -$60,000 |
| Analyst hours redirected to higher-value work | +$45,000 |
| Compliance risk reduction (probability-weighted) | +$35,000 |
| **Net Year 1 benefit** | **~$300,000** |
Healthcare analytics leaders continue to prioritize AI-driven analytics and payer analytics innovation as core investment themes, and the managed Power BI model sits at the intersection of both - accelerating insight delivery while maintaining the governance controls that CMS reporting, payer contracts, and value-based care arrangements require.
The business case is strongest when populated with the organization's actual headcount costs, current licensing spend, and documented compliance posture. The framework above provides the structure; the organization's own numbers provide the credibility.
Explore our Managed Power BI services to see how Lets Viz structures retainer engagements for healthcare and finance teams - with fixed-scope deliverables, SLA-backed support, and governance documentation built in from day one.
---
About Lets Viz: Lets Viz has delivered data analytics and Power BI solutions to clients across US healthcare, UK fintech, Canadian manufacturing, and global SaaS companies since 2020. Rated 5.0 on Clutch, the team brings direct experience with HIPAA-compliant analytics environments, GDPR-aligned data governance, and enterprise Power BI deployments at mid-market scale. Every managed engagement is structured to produce a documented, board-ready ROI within the first contract year.