Automation Audit Checklist: Score 18 Workflows in a Day
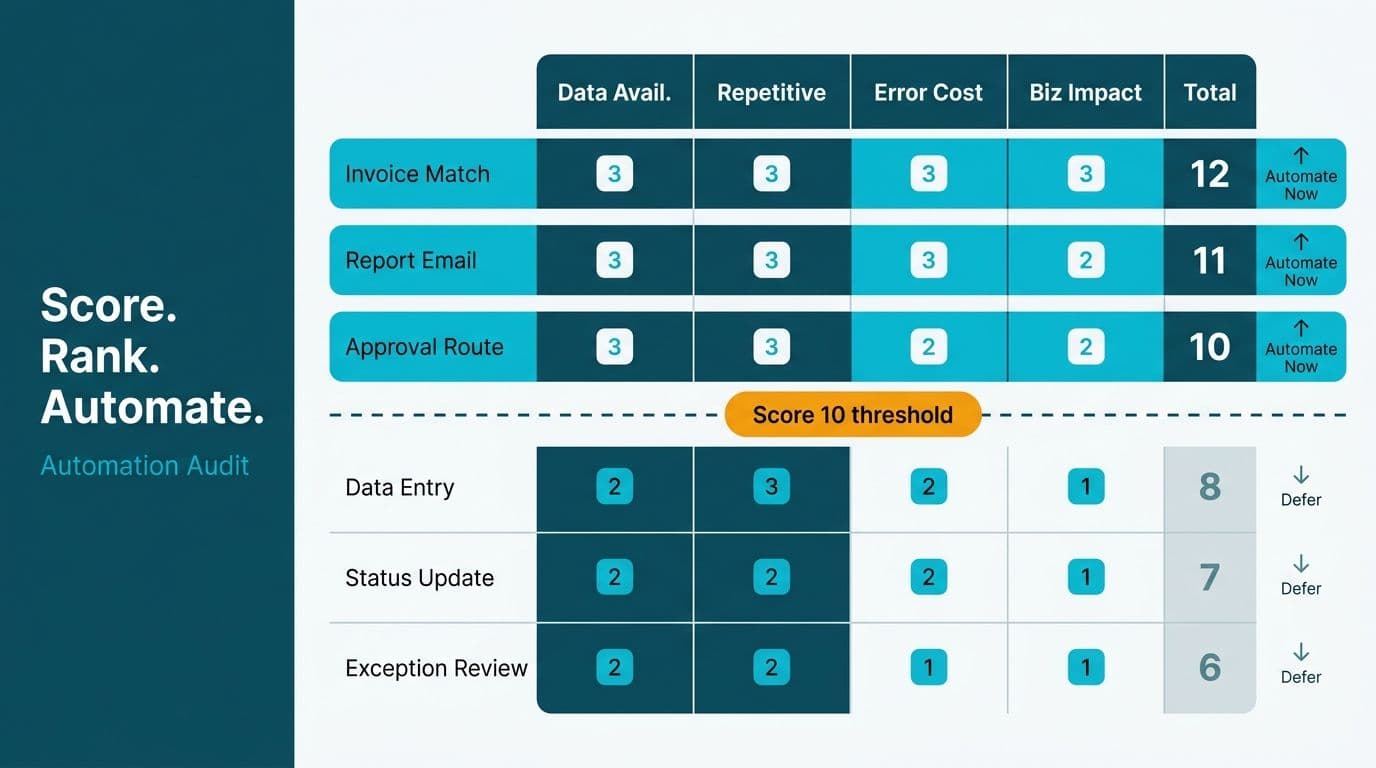
An automation audit checklist maps your 15-20 highest-frequency manual workflows and scores each on four dimensions: data availability, repetitiveness, error cost, and business impact. Each dimension gets 1-3 points; any workflow scoring 10 or above is a strong automation candidate. The exercise takes one working day and gives you a prioritized list your team can act on immediately.
Key Takeaways
Score every candidate workflow on four dimensions: data availability, repetitiveness, error cost, and business impact (1-3 each; max 12 total).
Workflows scoring 10-12 are first-wave automation targets; 7-9 need closer investigation before committing; 4-6 are low priority.
High repetitiveness alone does not make a workflow automatable - unstructured or inaccessible data kills more automation projects than technical complexity does.
Two worked examples below show how a freight reconciliation workflow scored 11/12 and a reporting workflow that seemed obvious scored 7/12 and stalled on a data infrastructure problem.
After scoring, sequence your build order by ROI, not by raw score.
What Is an Automation Audit Checklist?
An automation audit checklist is a structured inventory of manual workflows evaluated against objective criteria so you can rank them by automation potential rather than gut instinct. It is a diagnostic tool, not a technology selection exercise - it sits before any decision about platforms or vendors.
Most operations leaders already know their teams spend time on repetitive tasks. The audit converts that suspicion into a ranked shortlist. If you later engage a specialist for an AI readiness assessment (fixed price, 5 days), this checklist is the input that scopes the engagement - doing it yourself first compresses that discovery phase substantially.
The four scoring dimensions capture the two most common failure modes in automation projects: workflows that appear repetitive but lack clean input data, and workflows where the business impact is too low to justify the build cost.
How Do You Score a Workflow for Automation Potential?
Score each workflow 1-3 across four dimensions and sum the scores. The rubric below reflects criteria used across wholesale distribution, 3PL, manufacturing, professional services, and ecommerce engagements.
Dimension 1: Data Availability
Automation requires structured, accessible inputs. If the data lives in PDFs, freeform email text, or handwritten forms, the integration layer will consume most of the build budget before the workflow logic is even written.
1 - Unstructured or inaccessible: Paper forms, freeform email, or systems with no API or reliable export path.
2 - Digital but inconsistent: Data is in a system but varies in format, completeness, or field naming across records or sources.
3 - Structured and accessible: Consistent field definitions, reliable API or export, and no meaningful data cleaning required before use.
Dimension 2: Repetitiveness
Frequency determines how quickly an automation recovers its build cost. A quarterly process rarely justifies the investment unless error cost is very high.
1 - Ad hoc or quarterly: Triggered by one-off events with no fixed cadence.
2 - Weekly or monthly: Predictable but infrequent enough to limit ROI in isolation.
3 - Daily or multiple times per day: High volume; small per-instance savings compound into significant annual hours recovered.
Dimension 3: Error Cost
Some manual workflows carry low error cost because mistakes surface and are corrected immediately. Others allow errors to compound for weeks - a missed carrier surcharge, a billing discrepancy that ages into a dispute, or a mis-routed order that damages a customer relationship.
1 - Low cost: Errors are caught immediately and corrected without meaningful consequence.
2 - Moderate cost: Errors occasionally slip through; correction requires rework or a customer-facing interaction.
3 - High cost: Errors carry direct financial, operational, or reputational impact and may go undetected for weeks.
Dimension 4: Business Impact
This dimension captures the strategic upside of automating a workflow, not only the avoided cost.
1 - Minor time saving: A few hours recovered per month; no change in what the business can do.
2 - Meaningful efficiency gain: Removes a recurring bottleneck or relieves headcount pressure at a growth constraint.
3 - Strategic advantage: Enables a capability the business currently cannot perform at all, or creates measurable cost recovery that scales with volume.
Score Interpretation
| Total Score | Recommendation |
|---|---|
| 10-12 | High priority - automate in first wave |
| 7-9 | Medium - investigate data readiness and exception rate before committing |
| 4-6 | Low priority - revisit if volume grows or tooling costs fall |
The 18-Workflow Automation Audit Checklist
Use the table below as your starting inventory. Add or remove rows to match your operation. Fill in your scores before reading the worked examples - anchoring bias will pull your ratings toward pre-filled scores if you see them first.
| # | Workflow | Industry | Data Avail. (1-3) | Repetitive (1-3) | Error Cost (1-3) | Biz Impact (1-3) | Total /12 |
|---|---|---|---|---|---|---|---|
| 1 | Freight invoice reconciliation | Logistics, 3PL | |||||
| 2 | Purchase order entry from supplier email or PDF | Wholesale, Manufacturing | |||||
| 3 | Inventory reorder trigger | Wholesale, Ecommerce | |||||
| 4 | Shipment status update to customer | Logistics, Ecommerce | |||||
| 5 | Carrier rate shopping and comparison | Logistics, 3PL | |||||
| 6 | Accounts payable invoice processing | All | |||||
| 7 | Sales CRM data entry from email or meeting notes | All | |||||
| 8 | Weekly or monthly reporting assembly | All | |||||
| 9 | Marketing list segmentation and sync | All | |||||
| 10 | Client onboarding document collection | Professional Services | |||||
| 11 | Contract renewal tracking and alerts | Professional Services | |||||
| 12 | Timesheet collection and billing transfer | Professional Services | |||||
| 13 | Returns processing and refund initiation | Ecommerce | |||||
| 14 | Customer review monitoring and routing | Ecommerce | |||||
| 15 | Quality control defect logging | Manufacturing | |||||
| 16 | Production downtime event recording | Manufacturing | |||||
| 17 | Supplier lead time and order status tracking | Manufacturing, Wholesale | |||||
| 18 | Job cost vs. actuals reconciliation | Professional Services |
Once scored, sort descending by total. Your top three to five workflows form your first-wave scope. Flag any workflow scoring 1 on data availability regardless of total score - those require a data readiness step before automation planning begins.
Two Worked Examples: One That Scored Well, One That Did Not
Example 1 - Freight Invoice Reconciliation (11/12)
*Illustrative example.* A logistics company suspected it was being overcharged by carriers but had no reliable mechanism to verify it. Every carrier sent invoices in a different PDF layout, with different line-item conventions and surcharge definitions. Reconciliation happened manually and infrequently.
| Dimension | Score | Reasoning |
|---|---|---|
| Data availability | 2 | Invoices are digital PDFs but each carrier uses a different layout - parseable with format-specific logic, not a single universal template |
| Repetitiveness | 3 | Multiple invoices weekly across five carrier partners |
| Error cost | 3 | Overcharges accumulate silently; in this illustrative case, parsing six sample invoices across five partners surfaced a 2.86x surcharge overcharge that had gone entirely undetected |
| Business impact | 3 | Direct cost recovery at scale; automation also creates a net-new capability - systematic carrier performance benchmarking that did not previously exist |
| **Total** | **11/12** | **High priority** |
This is the shape of a strong first-wave candidate: imperfect but parseable data, high frequency, real financial error cost, and an upside that extends beyond time saving into a new operational capability.
Example 2 - Weekly Reporting Assembly (7/12, Stalled)
*Illustrative example.* A 60-person professional services firm wanted to automate its weekly revenue pipeline report. The operations lead spent three hours every Friday pulling figures from the project management tool, the CRM, and two account manager spreadsheets, then assembling them into a slide deck for the Monday leadership meeting. The workflow felt automatable: repetitive, predictable output, clear audience.
| Dimension | Score | Reasoning |
|---|---|---|
| Data availability | 1 | Data lives in four tools with no consistent project or client ID linking them; CRM and project management tool use different naming conventions; the spreadsheets are freeform with no schema |
| Repetitiveness | 3 | Weekly, without exception |
| Error cost | 1 | Leadership treats the numbers as directional; no binding decisions are made from this report alone, and errors are noticed at the meeting itself |
| Business impact | 2 | Three hours recovered on a Friday is meaningful but not strategic; no new capability is unlocked |
| **Total** | **7/12** | **Investigate before committing** |
The 7 score places this workflow in the medium band. The data availability score of 1 is the key signal. Automating this report as-is requires solving a data integration problem first - standardizing identifiers across four systems or building a single source of truth. That infrastructure work is valuable for other reasons, but it means what appears to be an automation project is actually a data infrastructure project in disguise. Organizations that scope it as a simple automation and discover the requirement mid-build commonly see timelines and budgets expand substantially before a working prototype exists.
The correct sequence: standardize project and client identifiers across systems, then automate the assembly step. Once the data model is fixed, the reporting automation becomes a one-week effort rather than a multi-month engagement.
UK GDPR note: if the pipeline report includes personal data from the CRM - contact names or deal values linked to identifiable individuals - any automated pipeline pulling that data also requires a data minimization review before it ships. What appears to be a purely operational project may carry a compliance obligation that is cheaper to resolve at design stage than to retrofit during testing.
How to Run This Audit in a Single Day
Morning - inventory (two to three hours)
Pull the last three months of calendar records, task lists, and team standup notes. List every recurring manual task your team performs. Group by the person who performs the work, not by department - the org chart often obscures who actually touches a workflow. Aim for 22-25 candidates before scoring; you will trim to 15-18 after removing one-off or genuinely infrequent tasks.
For each candidate, document: what triggers it, where the input data comes from, what the output looks like, who performs it, and how long it takes per instance. This step matters more than the scoring itself - knowing the actual data source determines the data availability score more reliably than intuition does.
Afternoon - scoring and ranking (two to three hours)
Score each workflow using the rubric. Apply conservative judgement on data availability - teams consistently overestimate how clean their data is until they try to export a sample. If uncertain, pull 20 rows from the relevant system and count how many require manual correction before an automated process could use them.
Sort by total score, descending. Flag every workflow scoring 1 on data availability as requiring a prerequisite data readiness step - those should not enter the automation backlog until the input problem is resolved.
For Canadian manufacturing and professional services organizations, the data inventory conducted at this stage partially satisfies the first step of a PIPEDA accountability documentation exercise when workflows in scope handle customer personal information - a useful secondary benefit from a single day's work.
Output: a ranked list of 15-18 workflows, scored, with data availability blockers flagged, and a clear first-wave scope. That list is your automation roadmap.
What Comes After the Checklist
A completed automation audit answers the diagnostic question - which workflows should we automate - but not the implementation question: with what tools, at what cost, in what order.
The tooling decision depends on what the top-scored workflows actually require. Standard workflow automation platforms handle scheduled, rule-based processes reliably. AI agent frameworks - including n8n AI agents, which orchestrate multi-step, judgment-intensive tasks across multiple systems in a single run - are better suited to workflows that involve reading unstructured inputs or making conditional decisions before acting. The right tool differs by workflow type, not by organizational size.
For a US wholesale distributor or 3PL operator, the highest-scoring workflows (freight reconciliation, purchase order entry, inventory alerts) typically fall into the standard workflow automation category. They need reliable data pipelines more than intelligence. For a professional services firm or ecommerce operator, reporting workflows that require interpreting figures rather than assembling them push into AI agent territory and require a different design approach.
For teams evaluating automation platforms, Power Automate vs n8n covers the enterprise trade-offs in detail. How to connect AI workflow automation to Power BI covers the reporting integration layer - relevant once you have automation outputs you want to surface in dashboards. For the cost-benefit framework that sits alongside your ranked checklist, the AI automation business case for finance leaders covers the quantification approach in full.
If your automation audit surfaces three or more workflows scoring 10 or above and you want a concrete build sequence with firm cost estimates, our AI readiness assessment (fixed price, 5 days) converts your ranked checklist into a scoped implementation plan - delivered in five working days at a fixed price.
---
About Lets Viz: Lets Viz has delivered automation audits and analytics implementations for operations teams in US wholesale distribution, UK professional services, Canadian manufacturing, and global ecommerce since 2020. With a 5.0 Clutch rating across fixed-price engagements, every project is scoped in writing before work begins - you know the cost and the deliverable on day one.