Use Cases for Big Data in Distribution: Pick Your First Win
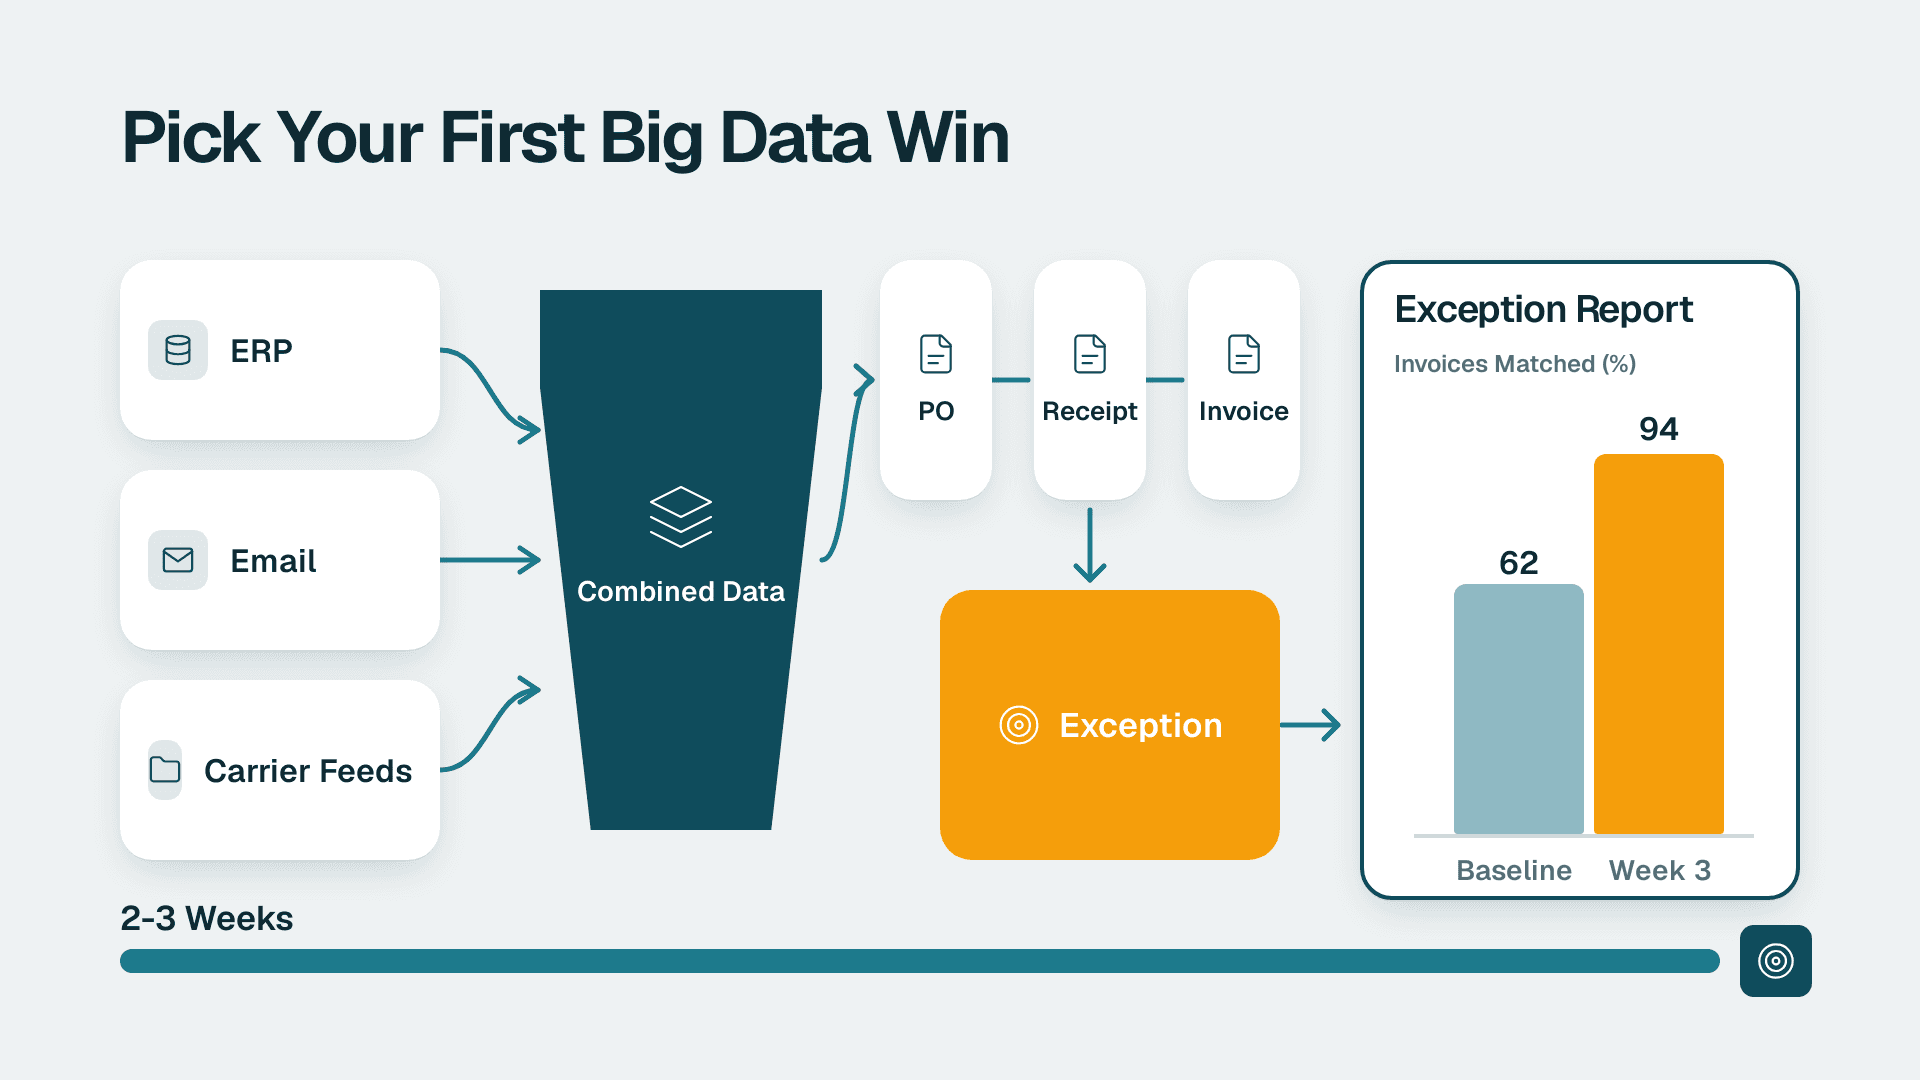
The best use cases for big data in a distribution or 3PL back office are measurable workflows like PO-to-invoice matching, and you can pick, build and test your first one in two to three weeks. It runs on combined data from your ERP, email and carrier feeds. Realistically it takes two to three weeks for a first working report, with roughly 6 to 10 hours of your own time per week.
Key Takeaways
- Pick one workflow, not three. A single owner and a single measurable goal beat a broad platform project.
- Score every candidate on volume, variety and cost of an error, then choose the top row you can actually get data for.
- Start with three-way match (PO, receipt, invoice) or the order-entry exception queue, because both have a clear before-and-after measure.
- Set a 1 percent price tolerance at first. Zero tolerance floods the queue with rounding noise.
- Measure against the Step 1 baseline after two full weeks, using minutes per document and errors found after posting.
What Counts as Big Data in a Distribution Back Office?
For a 20 to 200 person distributor, big data means the volume and mess of order lines, PO lines, invoices, EDI files and carrier updates that no single spreadsheet or system can hold and reconcile any more. It does not mean a data lake the size of a country. The use cases worth doing are the ones that stop people re-keying the same document into three places. This guide covers back-office and data workflows only, not warehouse robotics.
What Do You Need to Start?
You need one accountable person, read access to your order data and a small toolset, and none of it requires a large budget. Gather the following before Step 1:
- A named workflow owner. One person (operations director, supply-chain lead or controller) who can say what "correct" looks like for orders, POs and invoices.
- Read access to your ERP or order system. The ERP is the system of record for orders, inventory and accounting. You need a read-only database login, or the ability to schedule a CSV export, from it.
- Sample data. At least 3 months of order lines, PO lines and vendor invoices, as CSV or Excel if you cannot get a direct connection yet.
- Power BI Desktop (free) and a Power BI Pro licence. Pro is $14 per user/month at list price since 1 April 2025 (Microsoft Power BI pricing, 2025). You need it to publish and share the result.
- A Microsoft Fabric workspace (optional for the first pass). Only needed once you outgrow a single dataset. See the Microsoft Fabric architecture guide for how the pieces fit.
- A spreadsheet for scoring ideas. Plain Excel or Sheets is fine.
- Two hours with the people who do the re-keying. Their knowledge of exceptions matters more than any tool.
Step 1: Where Is Every Document Re-Keyed?
Use cases for big data start as complaints, not as technology, so the first job is an inventory of every place a human retypes data. Do this before you open any tool.
1. Open a blank spreadsheet and create the columns Document, Source system, Destination system, Who re-keys it, Minutes per document, Documents per week, Error type.
2. Sit with the order-entry clerk, the AP clerk and the dispatcher for 30 minutes each. Ask them to show you the last five documents they handled, not describe the process.
3. Add one row per hand-off. Typical rows for a distributor:
- Customer PO arrives by email as a PDF, then is typed into the ERP as a sales order.
- Vendor PO is created in the ERP, then re-sent by email and tracked in a separate spreadsheet.
- Vendor invoice arrives by email, then is keyed into accounting and matched by eye against the PO and receiving record.
- Carrier or broker status updates are copied into a customer email or a shared tracker.
- Weekly open-order and aged-invoice reports are rebuilt by hand from three exports.
What you should see: a list of 8 to 20 rows, with a rough weekly minutes figure for each (minutes per document multiplied by documents per week). If no one can estimate the time for a row, mark it "unknown" and leave it. Do not guess.
Step 2: Which Use Cases for Big Data Should You Pick First?
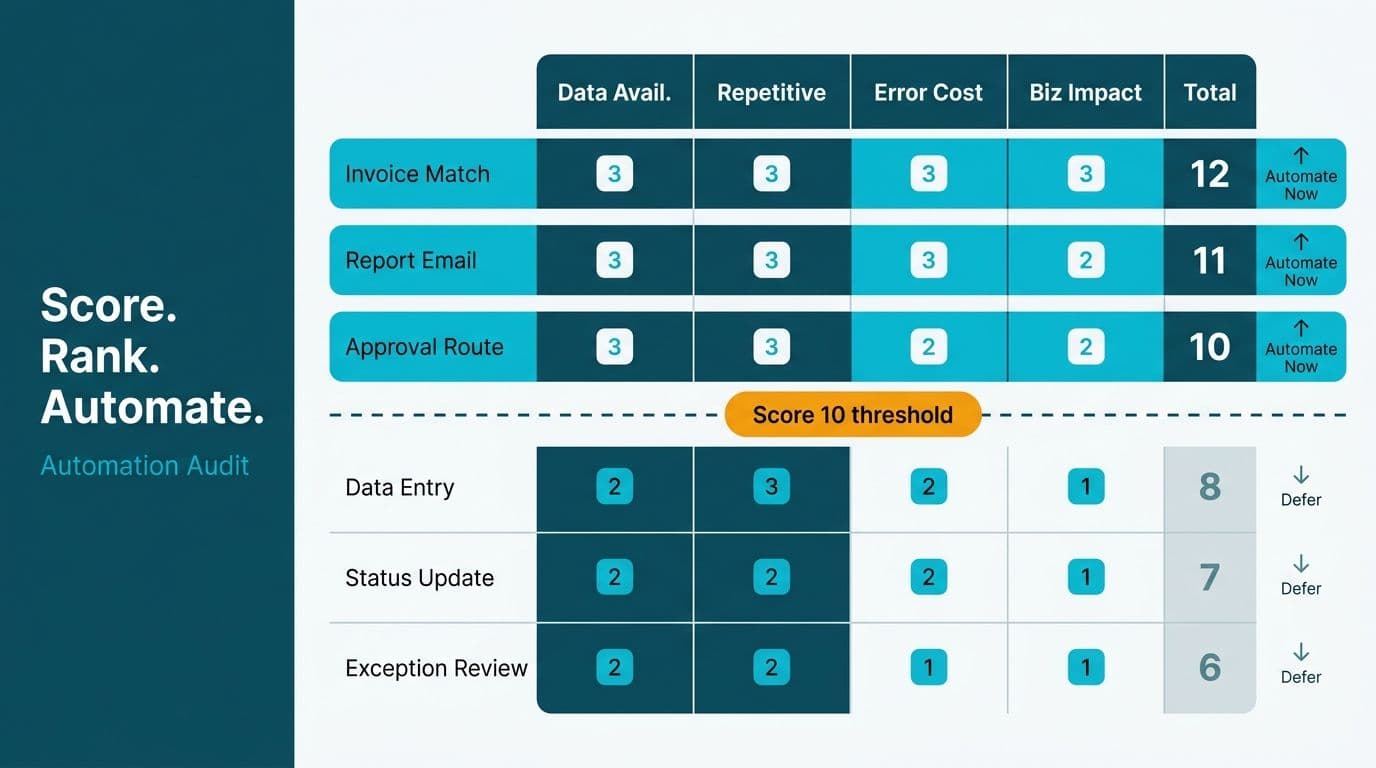
Pick the row that scores highest on volume, variety and cost of an error, and that has an owner and accessible data this month. A row becomes a big data use case when it involves volume (hundreds or thousands of lines), variety (more than one source or format) and a decision or reconciliation that is currently done by eye.
1. Add three columns to your sheet: Volume (1-5), Variety (1-5), Cost of an error (1-5).
2. Score each row. Variety is 1 for one clean system and 5 for PDFs plus EDI plus email plus the ERP.
3. Add a Total column with the formula `=SUM(H2:J2)` (adjust the column letters to your layout) and sort descending.
4. Pick the top row that also has a willing owner and data you can get access to this month.
Four use cases tend to come out on top for distributors, 3PLs and freight brokerages:
| Use case | Data sources | Typical owner | Before/after measure |
|---|---|---|---|
| Three-way match (PO, receipt, invoice) | ERP PO lines, receiving records, vendor invoices | Controller or AP lead | Minutes per invoice; errors found after posting |
| Order-entry exception queue | Customer POs, price list, item and ship-to masters | Order-entry or customer service lead | Orders corrected after entry; minutes per order |
| Late-shipment and dwell-time reporting | Carrier status feeds, order system | Dispatch or logistics manager | Late loads flagged before the customer calls |
| Margin leakage by customer and lane | Invoices, landed cost, accessorial charges | Finance or sales operations lead | Margin recovered on flagged lanes and accounts |
If you are choosing between them, start with three-way match or the order-entry exception queue. For the payback arithmetic, the order entry automation ROI formula is the one to use.
What you should see: one highlighted row with a written one-sentence goal, for example: "Show every vendor invoice line where billed unit price differs from PO unit price by more than 1 percent, within one day of invoice receipt." If you cannot write the goal in one sentence, the scope is still too wide.
Step 3: How Do You Pull the Source Data into One Place?
You connect the three source tables in Power BI Desktop, then clean the keys so they match. This is where big data becomes practical: getting the sources side by side.
Connect to the data
1. Open Power BI Desktop. On the Home ribbon, select Get data.
2. For a database connection, choose SQL Server (or the connector that matches your ERP's database) and enter the server and database names. For exports, choose Text/CSV or Excel workbook instead.
3. In the Navigator window, tick your three tables: PO lines, receipts and invoice lines. Select Transform Data, not Load.
What you should see: the Power Query Editor opens with your tables listed under Queries on the left, and a preview of rows in the centre.
Clean the keys
Most matching failures come from keys that look the same but are not.
1. Select the PO number column in each table. On the Transform tab, set Data Type to Text for all three.
2. With the column still selected, use Transform > Format > Trim, then Format > Uppercase. Do the same for the SKU or item number column.
3. If invoices carry the PO number with a prefix (for example "PO-"), use Transform > Replace Values to remove it so the keys match.
4. Select Home > Close & Apply.
What you should see: three tables in the Data pane on the right, with no warning bars in the Power Query preview. Pause if row counts look far lower than the ERP shows, because a filter or permission is hiding rows.
If the data will grow past a few million rows or comes from files and APIs as well as the ERP, move this step into Fabric: in your workspace choose New item, then Lakehouse, and load files with a Dataflow Gen2 or a pipeline Copy data activity.
Step 4: How Do You Build the Match Logic with DAX?
You write the matching rule as three calculated columns, so the definition of "matches" is written down and testable.
1. Switch to Model view (the third icon in the left rail). Drag PO Number from the PO lines table onto PO Number in the invoice lines table to create a relationship. Set Cardinality to Many to one and Cross filter direction to Single.
2. If your tables have no clean one-to-one key, add a calculated column. In Table view, select the invoice lines table, then choose Table tools > New column.
3. Pull the PO unit price onto each invoice line with `LOOKUPVALUE`:
```
PO Unit Price =
LOOKUPVALUE (
'PO Lines'[UnitPrice],
'PO Lines'[PONumber], 'Invoice Lines'[PONumber],
'PO Lines'[SKU], 'Invoice Lines'[SKU]
)
```
4. Add a second column for the price variance:
```
Price Variance % =
DIVIDE (
'Invoice Lines'[UnitPrice] - 'Invoice Lines'[PO Unit Price],
'Invoice Lines'[PO Unit Price]
)
```
5. Add a third column that classifies each line:
```
Match Status =
SWITCH (
TRUE (),
ISBLANK ( 'Invoice Lines'[PO Unit Price] ), "No PO line",
ABS ( 'Invoice Lines'[Price Variance %] ) > 0.01, "Price exception",
"Matched"
)
```
What you should see: in Table view, each invoice line shows a PO price, a variance and a status. Spot-check ten lines against the paper documents. `LOOKUPVALUE` returns a blank when no row matches and raises an error if several rows match the same key pair. So "No PO line" points to a key problem, and an error means the PO has duplicate SKU lines. Duplicates need either a line number in the match or a grouped table.
Step 5: What Should the Exception Report Show?
It should answer one question: what needs a human today? A use case only counts if the person doing the re-keying uses the output.
1. Return to Report view. From the Visualizations pane, add a Table visual.
2. Drag these fields into Columns: Vendor, Invoice Number, PO Number, SKU, PO Unit Price, Invoice Unit Price, Price Variance %, Match Status.
3. Drag Match Status into the Filters on this visual area, choose Basic filtering, and untick Matched.
4. Add a Card visual with a count of exceptions. Create it with Home > New measure:
```
Exception Lines =
COUNTROWS (
FILTER ( 'Invoice Lines', 'Invoice Lines'[Match Status] <> "Matched" )
)
```
5. Add a second Card showing the share of lines that match first time:
```
First-Pass Match Rate =
DIVIDE (
COUNTROWS ( FILTER ( 'Invoice Lines', 'Invoice Lines'[Match Status] = "Matched" ) ),
COUNTROWS ( 'Invoice Lines' )
)
```
6. Add a Slicer for Vendor and one for invoice date. Use Format > Cell elements > Conditional formatting on the Variance column so anything above your threshold turns red.
What you should see: one page with two cards and a short exception table. If it has more than about 40 rows on a normal day, your tolerance is too tight. Raise the threshold or add a quantity tolerance before you show the report to anyone. If your use case is carrier and load data instead, the page on Power BI consulting for logistics companies shows the typical data model.
Step 6: How Do You Publish, Refresh and Measure Against Your Baseline?
Publish to your Pro workspace, schedule a daily refresh, then compare results with the Step 1 baseline after two full weeks.
1. On the Home ribbon, select Publish, then choose the workspace your team uses. Sign in with the Pro account when prompted.
2. In the Power BI service, open the workspace, find the semantic model, and select Schedule refresh (under the ellipsis menu, then Settings, then Refresh).
3. Switch Keep your data up to date to On. Set the frequency to Daily and add a time before your team starts work, for example 6:30 AM local time.
4. If the data source is on-premises, install and register an on-premises data gateway first and map it under Gateway and cloud connections. Without it the refresh will fail.
5. Tick Send refresh failure notifications to the semantic model owner.
6. After two full weeks, compare minutes per document, documents handled per week, and errors found after posting against the Step 1 baseline.
What you should see: the Refresh history link shows a green "Completed" entry after the first manual refresh. For more on cadence and avoiding broken reports, see how to set up a Power BI data refresh schedule.
After two weeks, decide with numbers. If the exception queue has saved real time and the team trusts it, pick the next row from your scored list in Step 2. If you now want many such reports with shared definitions and governance, that is the point to consider a proper lakehouse design.
Common Mistakes
- Starting with the tool instead of the re-keying list. Teams buy a platform and then look for something to put in it. Fix: complete Step 1 and score the rows before connecting anything.
- Matching on raw keys. PO numbers with trailing spaces, mixed case or prefixes cause hundreds of false "No PO line" results. Fix: apply Trim and Uppercase in Power Query on every key column, as in Step 3.
- Setting the tolerance at zero. A zero-percent price tolerance floods the exception queue with rounding differences, and the team stops reading it. Fix: start at 1 percent and a small absolute dollar floor, then tighten it once volume is manageable.
- Scoping three use cases at once. Order entry, invoice matching and carrier tracking each have different owners and data. Fix: ship one, measure it, then start the next.
- Skipping the baseline. Without the minutes-per-document figures from Step 1, you cannot show payback. Fix: write the baseline down before the first refresh runs.
Troubleshooting
- Symptom: `LOOKUPVALUE` returns an error instead of a value. Likely cause: more than one PO line shares the same PO number and SKU. Add the line number as a third key pair, or aggregate the PO table to one row per PO and SKU in Power Query.
- Symptom: scheduled refresh shows "Failed" with a credentials message. Likely cause: the data source credentials were not set in the service after publishing, or the gateway is offline. Open Settings > Data source credentials, sign in again, and confirm the gateway status is online.
- Symptom: the report matches everything and shows no exceptions. Likely cause: the relationship or filter is hiding unmatched rows. Check the relationship direction in Model view and re-test with one invoice line you know has the wrong price.
If you want a second pair of eyes on which use case to build first and what your data can support, book the AI readiness assessment (fixed price, 5 days).
---
About Lets Viz: Lets Viz has been a data analytics consultancy since 2020, building Power BI, Microsoft Fabric and Zoho solutions for finance, healthcare, logistics and distribution teams. We hold a 5.0 Clutch rating from client reviews, and we write guides like this one from hands-on delivery work.