How to Measure ROI of AI Analytics Tools: A CFO's Framework
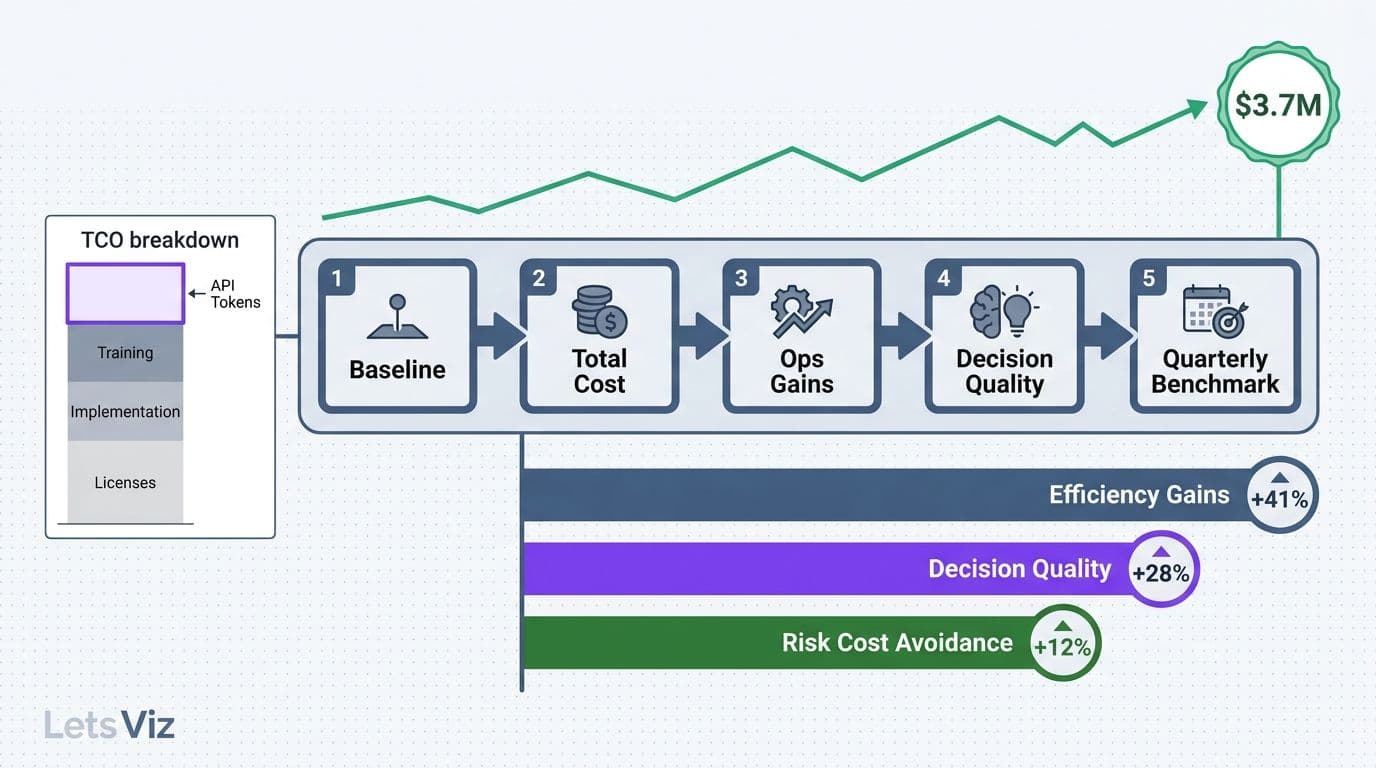
Measuring the ROI of AI analytics tools requires tracking three value layers - efficiency gains, decision quality improvements, and risk cost avoidance - against total cost of ownership that now includes token-based API billing. For finance and operations leaders, a five-step framework applied before and after deployment produces the only numbers that hold up at CFO budget review: baseline documentation, total cost mapping, operational gain quantification, decision quality valuation, and quarterly benchmarking.
Key Takeaways
ROI measurement for AI analytics requires a documented pre-deployment baseline; without one, attribution is guesswork at every budget review.
Token-based billing creates unpredictable cost spikes that can erode or eliminate projected ROI if not budgeted separately from license fees.
Finance and healthcare teams need distinct ROI metrics - reporting cycle time and forecast accuracy for finance; denial rate reduction and cost-per-encounter accuracy for healthcare.
Your data infrastructure readiness determines your ROI ceiling before any AI tool is deployed.
Operational ROI typically emerges at 6-9 months; strategic decision value takes 12-18 months to demonstrate reliably.
Lets Viz builds custom AI automation solutions that cut manual processing time by 40-60% within 90 days -- across finance, healthcare, and operations workflows.
Why Standard ROI Formulas Fail for AI Analytics Tools
Standard ROI formulas - Net Gain minus Total Cost, divided by Total Cost - were built for capital investments with predictable costs and measurable, isolated outputs. AI analytics tools break both assumptions. On the cost side, usage-based token billing means monthly invoices scale with query volume, not with the license count your procurement team approved. On the gain side, better decisions are diffuse: a more accurate cash flow forecast does not produce a line-item "decision improvement" on the income statement.
According to Future Market Insights, the AI consulting services market reached USD 11.07 billion in 2025 and is on track to surpass USD 14 billion in 2026, en route to the projected USD 90.99 billion by 2035 (26.2% CAGR, as of 2026). That growth rate signals enterprise adoption is accelerating far faster than the ROI frameworks most finance leaders inherited from SaaS software evaluations. The teams that deployed AI analytics tools in 2025-2026 are now the source of budget horror stories circulating in CFO forums: unbounded LLM query volumes generating invoices two to four times higher than the initial contract estimate.
The fix is a component-based ROI model that separates costs by type and gains by category, then tracks each independently on a quarterly cadence. For healthcare and financial services teams building out AI analytics capabilities for healthcare finance, the failure mode is consistent: overcount headline time savings, undercount infrastructure and token costs, and miss decision-quality gains entirely.
How to Measure ROI of AI Analytics Tools: A 5-Step Framework
Each step produces a number that feeds directly into a defensible ROI model. Run them in sequence - skipping steps is how ROI cases collapse under CFO scrutiny.
Step 1 - Establish a Pre-AI Baseline
Before any tool goes live, document current performance across four dimensions: average hours spent on manual reporting cycles per month, error or revision rates in financial closes, time-to-insight from data availability to decision, and fully-loaded cost per report. This baseline becomes the denominator for every efficiency claim you will make at the 6-, 12-, and 18-month reviews. Teams that skip this step cannot distinguish between AI-driven improvement and improvements from concurrent operational changes made during the same period.
If your team is learning how to automate report generation with AI, the baseline documentation simultaneously reveals which workflows are ready for automation and which need data cleanup first - a sequencing decision that can shift break-even timelines by months.
Step 2 - Map Total Cost of Ownership
List every cost component before and after deployment: software licenses (per-seat and per-workspace), token or API consumption (variable, by feature), data infrastructure upgrades required to support the AI tool, integration and development costs, training and change management, and ongoing support or managed services. Assign a monthly run rate to each. Token billing deserves its own dedicated line item with a monitored cap.
Enterprise teams in 2025-2026 consistently report that unbounded natural language query features - where users type questions directly into AI-powered dashboards - generate API call volumes 200-400% above initial estimates. Budget accordingly from day one, not after the first invoice arrives.
Step 3 - Quantify Operational Gains
Convert time recovery to dollars using fully-loaded labor rates including benefits. An analyst recovering eight hours per month on reporting cycle tasks represents roughly eight times their hourly blended cost in direct savings per month. Applied across a team of ten analysts, that compounds to material annual value. Operations teams tracking performance through dashboards - including shipping and logistics dashboards built in Power BI - apply identical logic: cycle time reduction times labor rate times monthly volume equals quantified dollar value.
Account for both direct time savings and avoided costs from error reduction. Manual financial close processes with 2-3% revision rates generate hidden rework costs that AI-assisted data validation can eliminate entirely.
Step 4 - Value Decision Quality
Most ROI models stop at time savings. Decision quality is where AI analytics tools generate disproportionate value - and where finance leaders in healthcare and financial services leave the most money unmeasured.
Assign probability-weighted values to decisions improved by AI-generated insights. If an AI anomaly detection flag surfaces a revenue cycle issue 45 days earlier than manual review would have, and that early detection enables a payer contract renegotiation worth $500,000, that value belongs in your ROI model with an appropriate probability weighting. Use conservative estimates. A 30% probability on a $500,000 decision improvement yields $150,000 of risk-adjusted value - still material, and far more defensible than leaving it out entirely.
Step 5 - Benchmark Quarterly, Not Annually
AI tool performance drifts as vendor models update, data pipelines change, and user behavior evolves. A quarterly benchmark against your Step 1 baseline catches value erosion before it compounds. Teams that review ROI only at annual budget cycles consistently discover that value leakage has been building for six to nine months by the time it surfaces at the review meeting.
Set a standing quarterly review: refresh the baseline metrics, recalculate TCO with actual token invoices, and compare operational gains to the previous quarter. Any quarter-over-quarter decline triggers a root cause review before the next billing cycle.
| ROI Component | Measurement Method | Typical Annual Value Range |
|---|---|---|
| Reporting cycle time recovered | Hours saved x labor rate x frequency | $15,000 - $80,000 per team |
| Decision speed improvement | Days accelerated x probability-weighted outcome value | $25,000 - $200,000 |
| Error rate and rework reduction | Error cost x frequency reduction | $10,000 - $60,000 |
| Token and API overage exposure | Unbounded query cost vs. capped contract estimate | ($20,000) - ($150,000) risk |
| Risk event early detection | Probability-weighted avoidance value | $50,000 - $500,000+ |
What Metrics Reliably Capture AI Analytics ROI in Finance and Healthcare?
Finance and healthcare have structurally different ROI denominators. Using the same metric set for both functions understates value in one and overstates it in the other.
According to Market Research Future, the Healthcare Financial Analytics Market is growing at an 8.58% CAGR through 2035, with 2026 deployment rates confirming the acceleration driven by value-based care models that require far more granular cost and outcome tracking than traditional fee-for-service environments supported (as of 2026). For healthcare finance teams, ROI metrics center on the revenue cycle because that is where each improvement point has a direct, auditable dollar value.
Financial services and corporate finance ROI metrics:
Reporting cycle time: Days from period close to board-ready report. Each day saved has measurable value in executive opportunity cost.
Forecast accuracy: Percentage variance between AI-assisted forecast and actuals, trended across quarters.
Analyst capacity recovered: Hours freed for modeling, scenario analysis, and strategic work that previously could not get scheduled.
Audit trail completeness: Documented data lineage that reduces external audit costs and regulatory exposure under SOX and similar frameworks.
Healthcare-specific ROI metrics:
Claim denial rate: Each percentage point of denial rate improvement translates directly to recovered revenue scaled by payer contract volume.
Cost-per-encounter accuracy: Better cost allocation reduces surprise variances in department P&Ls and strengthens managed care contract negotiations.
Compliance cost avoidance: Governed analytics infrastructure reduces audit exposure and legal cost. For the governance layer that protects this ROI, HIPAA-compliant analytics dashboard best practices covers the specific access control and audit requirements.
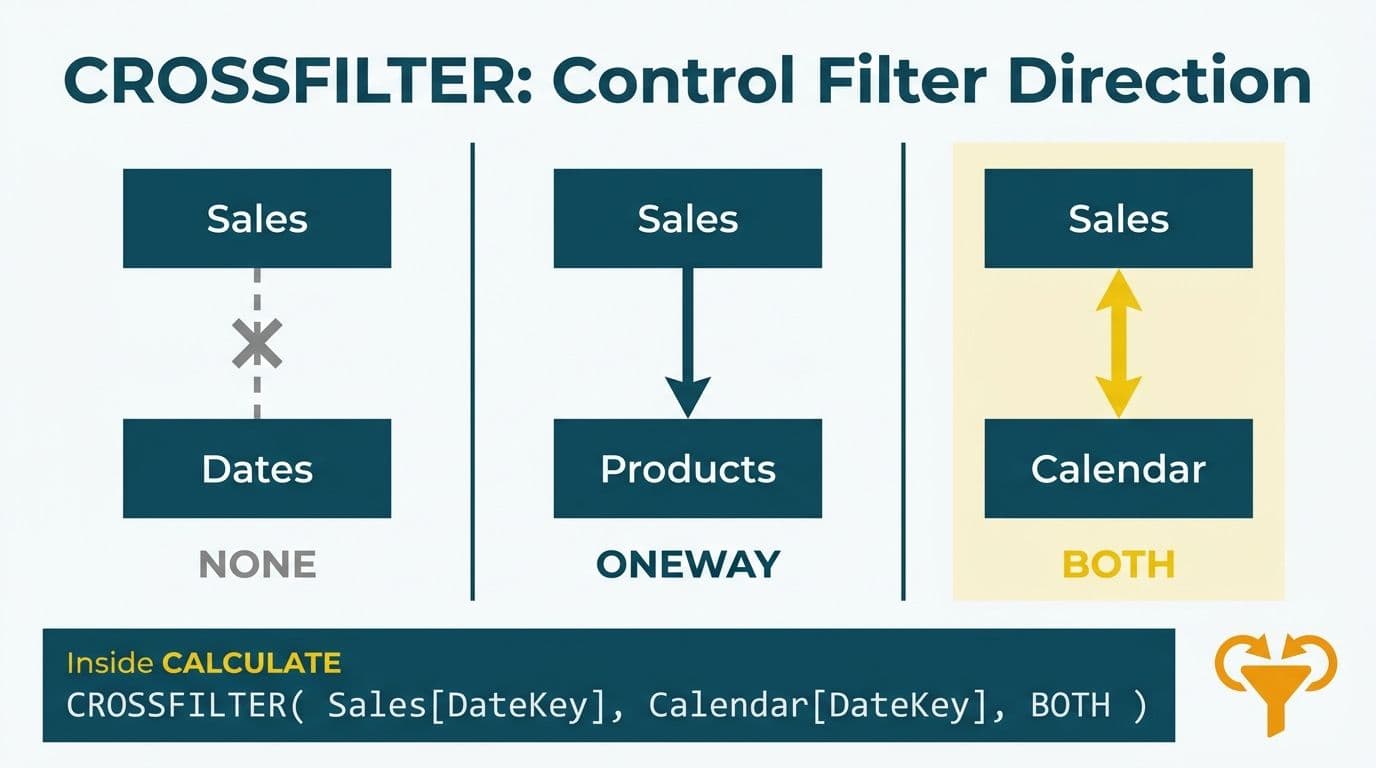
A technical note for Power BI implementations tracking these metrics: the choice between SUMX and SUM functions directly affects accuracy. SUMX iterates row by row and handles complex conditional aggregations correctly; SUM aggregates a column directly without row context. Using SUM where SUMX is required produces incorrect aggregation totals - a data modeling error that can materially misstate the ROI numbers your entire framework depends on.
How Do You Solve the Token-Billing Problem Before It Kills Your ROI Case?
The pattern that emerged across enterprise AI deployments in 2025-2026 is consistent and costly: finance teams approved AI analytics tools based on per-seat or per-workspace license estimates, then received month-two or month-three invoices two to four times higher. The driver is token consumption from LLM-powered features that were not budgeted separately. Natural language queries, automated report narrative generation, AI-assisted anomaly detection, and copilot-style interactions all generate API calls that accumulate fast when usage is unbounded.
Three structural controls prevent token billing from eroding your ROI case before it has a chance to develop:
Negotiate a consumption cap before signing. Most enterprise AI vendors will accept tiered pricing with hard monthly caps in 2025-2026 procurement cycles. Treat this as a non-negotiable contract term, not an afterthought for the legal team to add later.
Audit feature usage at 90 days. Enterprise teams consistently use 20-30% of AI features regularly after the novelty period fades — and in 2026 deployments, natural language query features show the steepest drop-off, frequently falling to under 15% of licensed seats generating meaningful query volume after the initial enthusiasm period. Identifying unused LLM-heavy features and disabling them reduces token consumption without reducing the operational value your ROI model is tracking. A mid-market finance team that ran this audit at 90 days and disabled an AI narrative-generation feature used by fewer than two of twelve analysts cut their monthly token costs by over 60%.
Model query volume from your baseline. Use your Step 1 data to estimate monthly query volume. If your finance team runs 400 report-related queries per month, multiply by the vendor's per-call rate to produce a realistic monthly consumption estimate before any contract is signed.
For teams managing Power BI environments, a CFO-level AI risk checklist for Power BI surfaces the pre-deployment governance questions that catch billing surprises before they appear on an invoice your board sees.
AI Reporting Readiness Checklist for Finance Teams
An AI reporting readiness checklist for finance teams determines whether your ROI model will be credible before a single tool is deployed. Poor data infrastructure inflates the cost side - remediation is expensive and time-consuming - while simultaneously deflating the gain side, because AI tools generate unreliable outputs on inconsistent or incomplete data.
Run this checklist before any AI analytics procurement decision:
[ ] Data completeness: All source systems are feeding clean, complete records into your data warehouse or semantic model with no silent gaps or truncation.
[ ] Refresh latency: Data is refreshing at the cadence the AI tool requires. Real-time anomaly detection needs near-real-time pipelines; weekly cash flow forecasting can tolerate daily refreshes.
[ ] Definition standardization: Key metrics are defined identically across all source systems. Revenue, cost, and margin mean the same thing everywhere the AI model reads data.
[ ] Access control: The AI tool can be restricted to appropriate data subsets for different user roles - essential for HIPAA compliance in healthcare and SOX segregation in financial services.
[ ] Baseline documentation: Pre-AI performance metrics are documented as described in Step 1 of the framework above.
[ ] Consumption monitoring: An API billing alert is configured and tested before any LLM-powered features are enabled for end users.
[ ] Output review process: A defined process exists for human review of AI-generated insights before they inform operational or financial decisions.
Teams that deploy without completing this checklist typically realize 40-60% lower first-year ROI because data cleanup costs and output unreliability consume the efficiency gains the tool was purchased to generate.
The readiness checklist also applies when building an AI analytics strategy for a mid-market company, though the priority order shifts: mid-market organizations more often need data governance remediation first, while enterprise teams more often need to rationalize tool sprawl before adding AI layers on top of overlapping systems.
When Should Finance and Ops Leaders Expect Positive ROI from AI Analytics?
Operational ROI - time saved on reporting cycles, error rates reduced, analyst hours recovered - typically becomes measurable at 6-9 months when data infrastructure is ready at deployment. Strategic ROI - better decisions, risk event avoidance, regulatory cost reduction - requires 12-18 months of operation before the statistical signal is strong enough to attribute to AI rather than to market conditions or management changes happening concurrently.
Teams that report ROI at 90 days are measuring novelty-driven usage patterns, not sustained value creation. A quarterly benchmarking cadence produces the first defensible ROI data point at month six and a statistically grounded business case by month twelve - the two milestones that matter most at budget cycle.
One leading indicator that often precedes measurable ROI: voluntary adoption by analysts. When finance or operations team members replace manual processes with AI-assisted alternatives without management prompting, that behavioral shift is a reliable signal of genuine time value. Forced adoption with low voluntary use rates is equally reliable as a predictor of first-year ROI disappointment.
A 2025 WEF report drawing on over 100 experts across more than 50 financial services organizations identified decision-support quality - not processing speed - as the primary driver of long-term AI analytics ROI in regulated industries (as of 2026, this finding has been corroborated by independent surveys across North American and European finance teams deploying second-generation AI analytics tools). One regional bank cited in the study attributed $2.3 million in avoided credit losses to AI-flagged early warning signals — value that would have registered as zero in an efficiency-only ROI framework. The implication for your measurement model is direct: if you only track time savings, you are likely under-capturing 30-40% of the value your AI analytics tools are generating. Build the decision quality column in from day one, even if the first defensible numbers take 12 months to emerge.
---
If your team is preparing an AI analytics ROI case or evaluating tools under budget scrutiny, Custom AI automation and consulting provides the framework, infrastructure assessment, and quarterly review cadence that turns a theoretical ROI model into a CFO-approved business case.
---
About Lets Viz: Lets Viz has partnered with finance and healthcare organizations since 2020 to design, deploy, and measure analytics infrastructure across Power BI, AI-assisted reporting, and data strategy engagements. Our consultants bring domain expertise in financial services compliance and healthcare regulatory environments, working alongside CFOs, operations leaders, and data teams to build ROI measurement frameworks that hold up to audit scrutiny and deliver quantifiable returns.