How to Build an AI Analytics Strategy for a Mid-Market Company
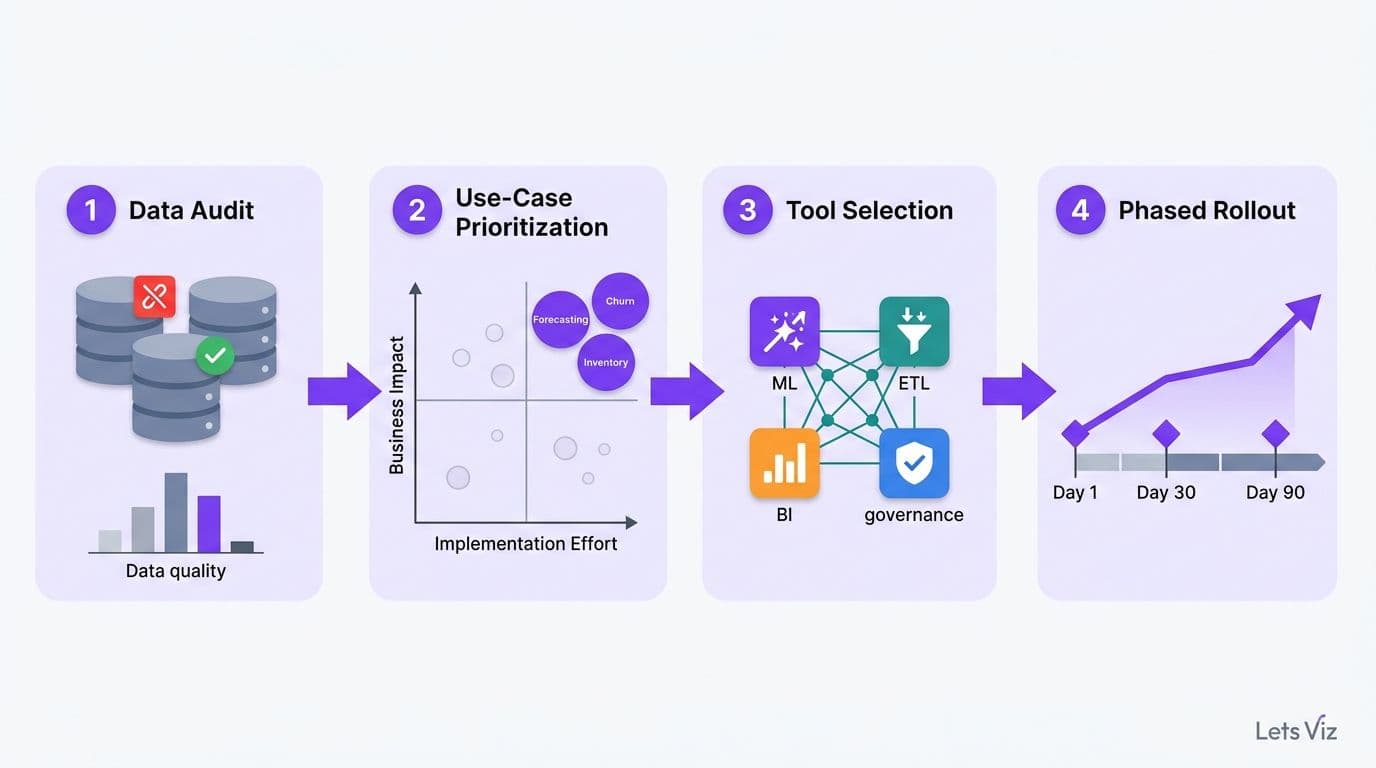
Building an AI analytics strategy for a mid-market company comes down to four sequential steps: a data audit, use-case prioritization, tool selection, and a phased rollout. Companies that execute this framework systematically can identify measurable ROI within the first 90 days - without hiring a dedicated data science team or replacing existing infrastructure.
Key Takeaways
A structured data audit reveals data quality gaps and governance obligations before any AI tool is deployed, saving time and avoiding costly compliance exposure.
Prioritize two or three use cases with high business impact and high data readiness - revenue forecasting and claims denial analysis are the strongest starting points for finance teams.
AI capabilities embedded in tools your team already licenses reduce integration friction and accelerate time-to-insight without new procurement cycles.
A 90-day phased rollout creates measurable decision gates that sustain executive buy-in and limit implementation risk.
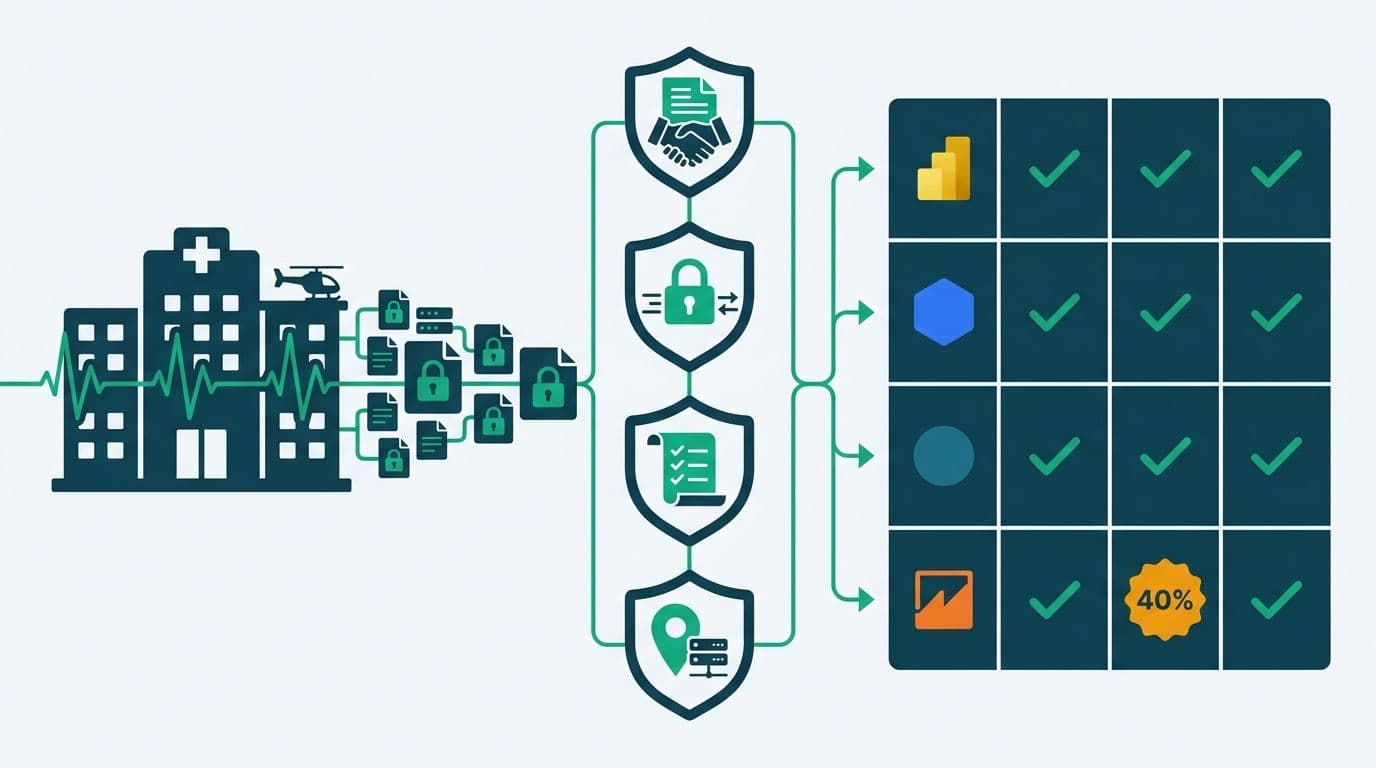
In financial services and healthcare, compliance and data privacy controls must be designed into the strategy from the outset, not bolted on after deployment.
What Is an AI Analytics Strategy and Why Does Mid-Market Adoption Lag Enterprise?
An AI analytics strategy is a documented plan that aligns your data assets, chosen tools, and business priorities into a sequence of measurable initiatives. For mid-market companies - typically those with 100 to 2,000 employees and revenue between $50 million and $1 billion - the challenge is not ambition. It is resourcing. These organizations face the same competitive pressure as enterprise peers to generate faster, more accurate insight from data, but without the dedicated AI and data engineering teams that large enterprises field.
According to Future Market Insights (2026), the AI consulting services market reached an estimated USD 13.9 billion in 2026—up from USD 11.07 billion in 2025—and is projected to expand to USD 90.99 billion by 2035 at a compound annual growth rate of 26.2%. That expansion is being driven largely by mid-market demand - organizations that need structured guidance precisely because they cannot build specialist capability internally at enterprise scale.
The gap between what enterprises deploy and what mid-market firms have implemented is closing. Companies that establish a coherent strategy now will operate at a measurable analytical advantage over competitors who still treat AI as a future-state initiative rather than a present operational investment. For a view of how specialist partners approach this challenge in regulated industries, see AI services and consulting for finance and healthcare leaders.
Step 1: How Do You Conduct a Data Audit Before Deploying AI?
A data audit is a structured inventory of every data source your organization uses - financial systems, EHRs, CRMs, spreadsheets, and third-party feeds - evaluated for completeness, accuracy, accessibility, and governance obligations. AI models amplify what is already in your data; they do not fix it. Deploying AI on top of inconsistent or incomplete data produces outputs that erode trust faster than a failed pilot and are significantly harder to walk back.
Recent market research (Yahoo Finance, 2026) projects the global AI consulting and support services sector to expand at a 33.4% CAGR through 2030 - a figure revised upward as mid-market adoption accelerates faster than analysts projected, reflecting just how urgently organizations in financial services and healthcare are competing to close the data readiness gap that currently blocks AI value realization.
The audit produces three deliverables:
Data Map
Document where data lives - on-premise ERP, cloud data warehouse, SaaS platforms, or analyst-maintained spreadsheets - who owns each source, and how frequently it updates. For a healthcare finance team, this typically includes a billing platform, a payer contract database, and a general ledger: three systems that rarely share a common patient or account identifier without manual reconciliation.
Quality Scorecard
Score each data source on three dimensions: completeness (what percentage of fields are populated), consistency (do the same concepts appear under different labels across systems?), and latency (how stale is the data at the point of use?). A simple 1-to-5 scale per dimension is sufficient. Sources that score below 3 on completeness are not candidates for Phase 1 AI deployment, regardless of their business relevance.
Governance and Compliance Map
Identify where HIPAA, SOC 2, GDPR, or SEC recordkeeping obligations apply to each data source. In regulated industries, governance gaps found during the audit are significantly cheaper to resolve before tool selection than after. A misconfigured data pipeline that routes protected health information into an AI model's training process is a material compliance risk, not a technical footnote. Review what metrics a financial reporting dashboard should include to identify which data sources must meet the highest quality and access-control threshold from day one.
Practical tip: Assign the audit to an internal finance or operations analyst, not the IT department. Business owners understand the data's meaning, its quirks, and its known inconsistencies better than any technical team can infer from schema documentation alone.
Step 2: How Should You Prioritize AI Use Cases Without a Data Science Team?
Use-case prioritization is where strategy becomes actionable. The objective is to identify two or three initiatives that combine high business impact with high data readiness. This combination delivers fast, credible results rather than prolonged experiments that exhaust organizational patience before producing the evidence base that justifies continued investment.
Use a prioritization matrix to map candidate use cases against these two axes:
| Use Case | Business Impact | Data Readiness | Recommended Phase |
|---|---|---|---|
| Revenue forecasting (rolling 13-week) | High | Medium | Phase 1 |
| Claims denial rate analysis | High | High | Phase 1 |
| Headcount cost variance detection | Medium | High | Phase 1 quick win |
| Patient readmission prediction | High | Low | Phase 2 |
| Supplier spend analytics | Medium | Medium | Phase 2 |
| Market expansion modeling | High | Low | Phase 3 |
For financial services teams, the highest-priority use cases center on revenue forecasting, working capital optimization, and portfolio risk flagging. For healthcare finance teams, claims denial analysis and cost-per-episode benchmarking against payer contracts consistently deliver the fastest return. A detailed view of which financial KPIs deserve first attention is available in 5 Key Financial KPIs Every CFO Should Track.
The rule of two: Approve no more than two active AI initiatives simultaneously. Spreading data and analytical effort across five concurrent projects means none of them accumulates the evidence base needed to justify the next investment cycle. In practice, mid-market finance teams that attempt three or more concurrent AI pilots typically see all of them stall at the stakeholder review stage: no single initiative has enough clean data, dedicated analyst time, or consistent executive attention to produce a result within 90 days — and the entire program loses credibility before any use case crosses the finish line.
According to MedInsight (2026), the three dominant themes in healthcare analytics through 2027 are value-based care performance measurement, AI-driven analytics, and payer analytics innovation - a shortlist that maps directly to the high-impact, high-readiness quadrant for most healthcare finance departments. Organizations deploying structured analytics specifically against claims denial — the highest-readiness use case in this list — report denial rate reductions of 15–25% within the first 90 days, translating directly to recovered revenue without additional headcount.
Step 3: How Do You Select the Right AI Analytics Tools for Mid-Market Operations?
Tool selection is where mid-market organizations most frequently make costly decisions. The failure modes are symmetric: purchasing a standalone AI platform that requires integration and engineering work the team cannot staff, or underestimating the AI capabilities already embedded in platforms they license and use today.
Three variables drive the decision:
Stack compatibility. If your finance team already operates in Power BI, the AI capabilities embedded in the platform - natural language query, anomaly detection, and Copilot-assisted report generation - can deliver material value without additional procurement or vendor negotiation. For a practical, tested assessment of which features produce results in production environments, see the Power BI AI features that are actually worth using.
Data science dependency. Some AI analytics tools require a data engineer to maintain pipelines and retrain models as data drifts. For ops and finance leaders without that resource, low-code AI tools with pre-built connectors and automated retraining cycles are the pragmatic choice. They trade maximum model performance for consistent, maintainable results that a non-technical team can own and explain to auditors.
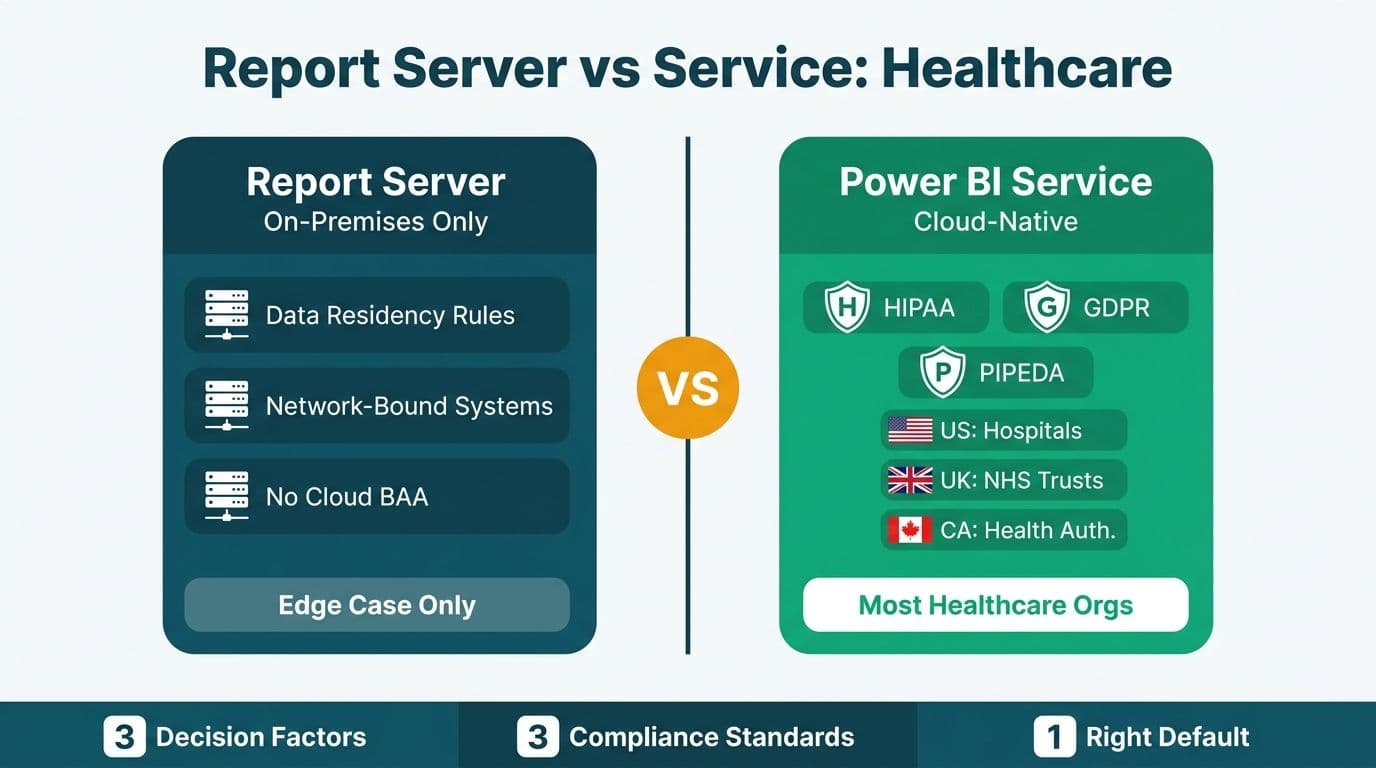
Compliance posture. Tools used in healthcare must satisfy HIPAA's minimum necessary standard and generate auditable logs of every data access event. In financial services, tools used in client-facing or regulatory reporting face SEC, FINRA, or FCA scrutiny depending on jurisdiction. AI analytics data privacy risks for healthcare organizations are routinely underestimated at the selection stage: a third-party integration that routes query data through a vendor's model training pipeline can expose protected health information without triggering an obvious system alert. According to the World Economic Forum (2026), over 90 major financial services organizations now have formal AI governance frameworks in place—a figure that accelerated sharply after the EU AI Act entered its first enforcement phase in mid-2026, and as regulators in the UK and US have signaled that voluntary frameworks will give way to mandatory requirements by 2027. Mid-market firms that defer governance until a regulatory deadline face both remediation costs and the reputational risk of a reactive posture.
For organizations evaluating AI analytics consulting versus building an in-house data team, outsourced financial analytics services examines the trade-offs in depth - including how to structure an engagement so institutional knowledge transfers back to internal analysts over time.
Step 4: What Does a Phased AI Rollout Look Like for a Mid-Market Finance Team?
A phased rollout structures deployment into 90-day sprints, each with a defined success metric, a named business owner, and a go/no-go decision gate before the next phase begins. This structure keeps the initiative accountable without the rigidity of a plan that cannot absorb mid-course learning.
Phase 1: Proof of Value (Days 1 to 90)
Deploy a single AI use case against data that cleared the governance review during the audit. Target one KPI: forecast accuracy, claims denial reduction rate, or variance detection speed. The objective is not a perfect model - it is a result credible enough to present to a CFO or COO as evidence that the investment is working.
Phase 2: Scale and Integrate (Days 91 to 180)
Expand the Phase 1 use case to additional data sources or business units. Onboard the second priority use case from the prioritization matrix. Establish a monthly review cadence with stakeholders who have authority to redirect resources if results plateau. This phase is also when to build the reporting layer that surfaces AI outputs in standard dashboards rather than a separate analytical environment.
Phase 3: Embed and Govern (Days 181 to 270)
Transition from project mode to operational mode. AI outputs become part of standard management reporting, not a parallel analytical track. Governance checkpoints - model performance reviews, data drift monitoring, and bias audits - are scheduled quarterly and assigned to named owners accountable within your existing financial control structure.
According to Market Research Future (2026), the Healthcare Financial Analytics Market is projected to expand at a 9.2% CAGR from 2026 to 2036, driven substantially by organizations graduating from proof-of-concept pilots to enterprise-scale operational deployment. The organizations moving fastest share one characteristic: they used a structured phased rollout to build internal capability and stakeholder confidence in parallel rather than attempting both simultaneously. For healthcare organizations building the reporting foundation within this rollout, how to build a Power BI financial dashboard for healthcare provides a technical blueprint for Phase 1 and Phase 2 deliverables.
How Do You Measure the ROI of AI Analytics Tools After Deployment?
Understanding how to measure ROI of AI analytics tools is not optional - it is the mechanism that sustains organizational commitment and budget authorization beyond the first year of deployment.
Establish a pre-deployment baseline for every KPI the AI initiative targets. In financial services, common baselines include: days to close monthly reporting, forecast error percentage against actuals, and false positive rate on risk or fraud flags. In healthcare finance: average claims processing time, denial rate by payer, and cost-per-episode variance against benchmark contracts.
Measure the same KPIs at 30, 60, and 90 days post-deployment. Translate the delta into a dollar value - reduced analyst hours, recovered denied claims revenue, avoided cost overruns, or lower error-correction costs - and aggregate these into a return calculation. The ROI calculator for AI automation provides a structured methodology that applies directly to analytics deployments, including how to account for data preparation costs on the investment side of the equation.
Three ROI measurement errors to avoid:
Counting projected savings before the model has completed a full business cycle
Benchmarking AI-assisted output against a manual process that was never actually performed at scale in practice
Excluding data preparation and governance costs from the investment denominator
---
About Lets Viz: Lets Viz is a data analytics and business intelligence consultancy with over ten years of experience helping financial services and healthcare organizations build AI-ready analytics infrastructure - from initial data audits through to production-grade reporting environments. Our team has designed and delivered analytics strategies for mid-market clients across the UK, US, and India, with particular depth in regulated industries where compliance and analytical rigor must coexist.
To move from audit to execution, Managed Power BI services from Lets Viz provide a structured engagement model built for ops and finance teams that need fast, defensible results without establishing a dedicated data science function.