Healthcare Data Model for Power BI: Star Schema Guide
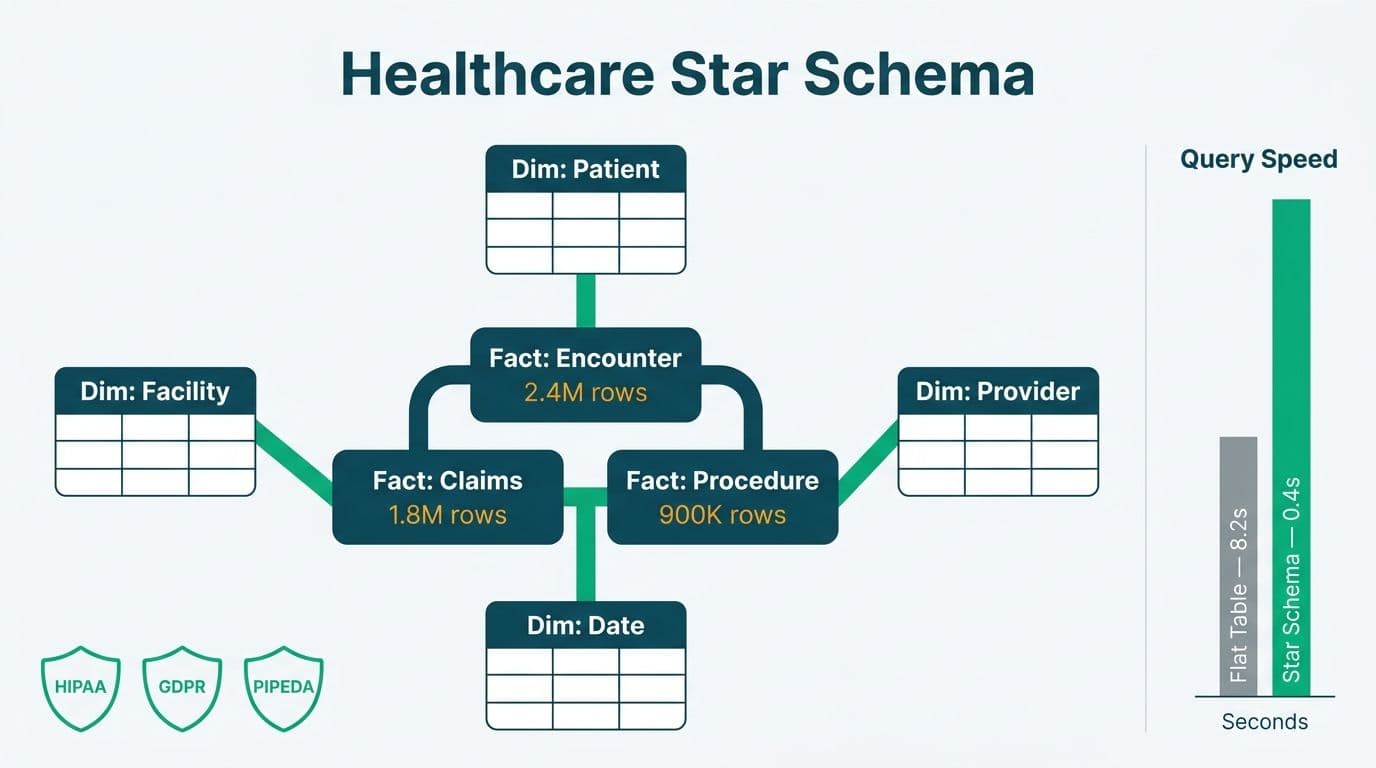
A well-designed healthcare data model for Power BI reporting centers on a star schema with three core fact tables - encounter, claims, and procedure - joined to patient, provider, and facility dimensions. This structure supports sub-second DAX queries across millions of clinical records while enabling the granular row-level security that HIPAA, GDPR, and PIPEDA each require.
Key Takeaways
- Star schema with encounter, claims, and procedure fact tables outperforms wide flat tables for clinical analytics at scale
- Patient, provider, and facility dimensions should carry Slowly Changing Dimension Type 2 history for audit compliance
- HL7 v2.x messages and FHIR R4 resources require normalization to relational form before landing in Power BI
- Role-based row-level security scoped to NPI or facility ID satisfies HIPAA's minimum-necessary standard
- Composite models combining Import and DirectQuery let live EHR feeds coexist with warehoused claims history
What Is a Healthcare Data Model for Power BI Reporting?
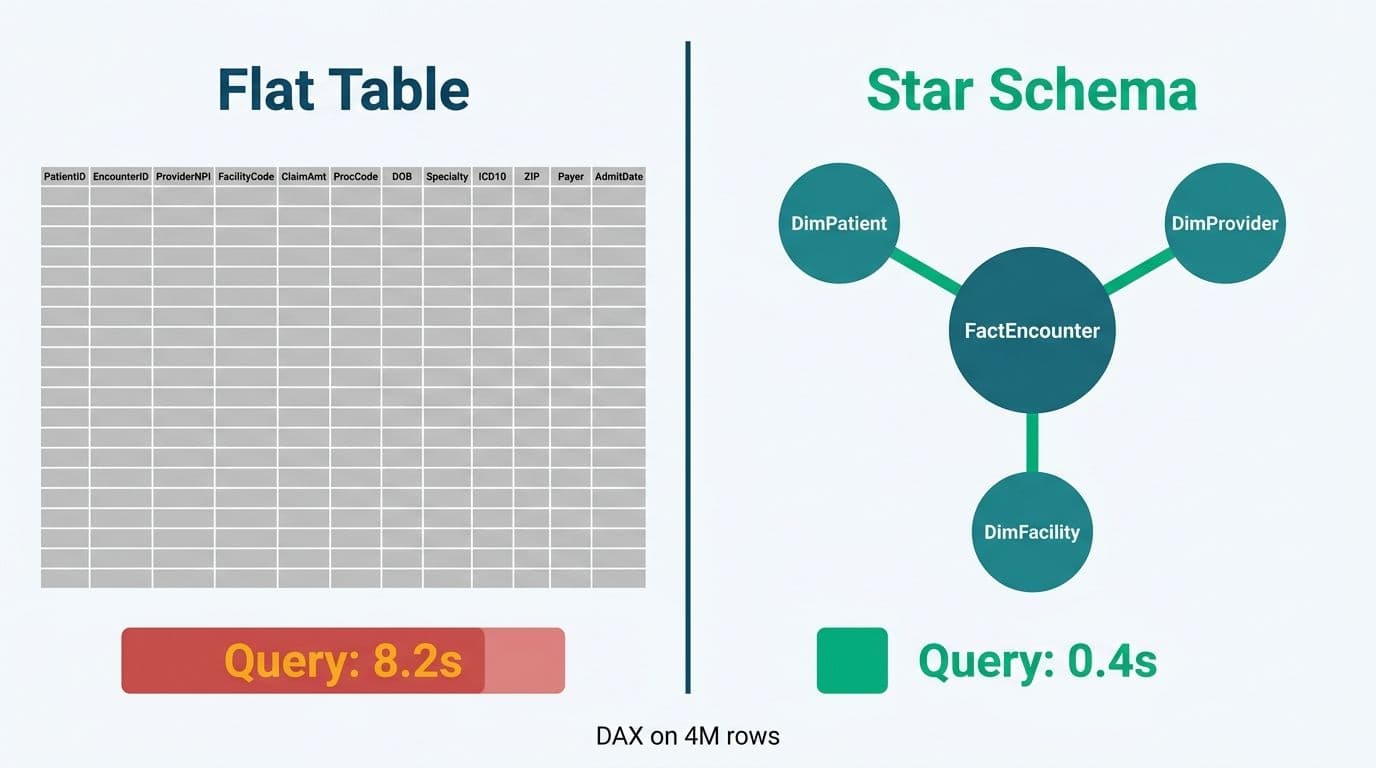
A healthcare data model for Power BI reporting is a structured schema that translates raw clinical and administrative records into a form Power BI's Vertipaq in-memory engine can compress, index, and query efficiently. The dominant pattern is the star schema: a central fact table surrounded by conformed dimension tables connected by integer surrogate keys. This architecture minimizes DAX complexity, supports faster report load times, and makes it straightforward to apply row-level security across organizational boundaries.
Healthcare data is inherently complex - a single patient encounter can spawn dozens of procedure codes, multiple claims adjustments, and parallel HL7 messages from different systems. Flattening this into a single wide table creates column cardinality problems in Power BI and makes HIPAA-compliant data masking impractical. The star schema separates concerns: facts store measurable events, dimensions store descriptive attributes, and relationships govern access.
Teams building Managed Power BI for healthcare teams at this level of complexity typically start by mapping their source systems - EHR, practice management, claims clearinghouse, and billing platform - before a single table is designed. That mapping exercise also reveals which systems require real-time DirectQuery access and which can be warehoused for Import mode, a decision that shapes the entire semantic model architecture.
How Do You Structure the Core Fact Tables?
The three fact tables that anchor most US hospital analytics environments are encounter, claims, and procedure. All three share a Date dimension table - marked as a Date Table in Power BI under Table Tools - because time intelligence functions such as DATEADD, SAMEPERIODLASTYEAR, and DATESYTD only work correctly when a proper Date Table exists in the model. Build that Date dimension with both calendar-year and fiscal-year attributes; many US health systems run Oct-Sept fiscal years that differ from the calendar year, and Power BI's automatic date hierarchy cannot accommodate custom fiscal periods.
Encounter Fact Table
The encounter fact table is the highest-grain event store in the model. Each row represents one clinical visit, admission, or telehealth session. Key measures include length of stay (in hours), discharge status code, DRG weight, readmission flag (30/60/90-day window), and admission source code. Foreign keys connect to PatientKey, ProviderKey, FacilityKey, DiagnosisKey, and DateKey at minimum.
Keep encounter-level diagnosis codes in a separate DiagnosisBridge table using a many-to-many bridge pattern. A single encounter can carry a primary ICD-10 code plus several secondary diagnoses; storing all of them in the fact table as nullable columns inflates the row width and destroys Vertipaq compression ratios.
Claims Fact Table
The claims fact table operates at line-item grain: one row per claim line, not per claim header. Measures include billed amount, allowed amount, paid amount, adjustment reason code, and denial flag. The gap between billed and allowed amounts is the contractual adjustment - the single most-watched metric for revenue cycle teams at US health systems and NHS-contracted providers in the UK alike.
Procedure Fact Table
The procedure fact table captures CPT/HCPCS codes (or SNOMED CT/OPCS-4 for UK/EU environments) at the individual procedure grain. Linking it to the encounter fact via EncounterKey enables cross-fact analysis - for example, calculating the average number of procedures per high-DRG encounter to identify outlier efficiency opportunities. This table is also the natural home for clinical trial data reporting in Power BI, where each protocol procedure needs traceability back to trial arm and enrollment date.
How Do You Design Patient, Provider, and Facility Dimensions?
Dimension design in healthcare carries compliance weight that most other industries do not face. All three dimensions are conformed - shared across the encounter, claims, and procedure fact tables - so that a single patient, provider, or facility record drives consistent filtering regardless of which fact table powers the visual.
Patient Dimension
The patient dimension must comply with HIPAA's Safe Harbor de-identification standard (45 CFR § 164.514(b)) for any report accessible outside the treating organization. In practice, this means storing a surrogate PatientKey in the fact tables and restricting the MRN-to-surrogate mapping table to a secure, access-controlled workspace. For UK NHS deployments, NHS Number must be treated as special-category data under UK GDPR Article 9. Canadian organizations using provincial health card numbers fall under PIPEDA's sensitivity provisions.
Apply Slowly Changing Dimension Type 2 (SCD2) to the patient dimension so that changes in address, insurance plan, or contact information create a new versioned row rather than overwriting history. This preserves audit lineage - critical when a compliance review asks what coverage a patient held at the time of a specific admission.
Provider Dimension
Attributes include NPI (National Provider Identifier for US providers), specialty code, tax ID, network status (in/out of network), and care team role. The NPI is the natural business key for US reporting; UK providers map to ODS codes, and Canadian billing uses provincial billing numbers. Use the NPI as the RLS grain so that a physician or department head sees only their own patient panel when opening a shared Power BI healthcare dashboard.
Facility Dimension
Attributes include facility NPI, CMS certification number (CCN), address, bed count, facility type (acute, ambulatory, long-term care), and accreditation body. For multi-site health systems, a FacilityHierarchy bridge table adds region and market to enable rollup reporting without duplicating rows in the base dimension.
How Do HL7 and FHIR Data Land in Power BI?
HL7 and FHIR are the two dominant interchange standards for clinical data, and neither lands in Power BI natively - both require a transformation layer before they match your star schema grain.
> HL7/FHIR Ingestion Patterns
>
> HL7 v2.x messages arrive as pipe-delimited text. Parse them in Azure Data Factory, AWS Glue, or a Python-based ETL using a v2 parser library before writing normalized rows to staging tables. Key message types to capture: ADT^A01 (admission/discharge/transfer), ORU^R01 (lab results), and DFT^P03 (charge/procedure posting).
>
> FHIR R4 exposes clinical data as RESTful JSON resources. Microsoft Azure Health Data Services connects to a Synapse Analytics pipeline via FHIR-to-Parquet export, landing normalized Parquet files in an ADLS Gen2 container. Power BI then connects via a Dataflow Gen2 or a certified connector. The FHIR R4 specification (HL7 International) defines canonical resource shapes; always validate source data against published profiles before ingestion.
>
> In both cases the target is identical: normalized, surrogate-keyed relational rows that match the star schema grain defined above.
Timestamps from both standards arrive in UTC. Convert them to local time zones in the transformation layer - not in DAX - to avoid query-time performance degradation. For Canadian organizations subject to provincial data-residency requirements, ensure Parquet files land in a Canadian Azure region (Canada Central or Canada East) before any Power BI import. For UK NHS organizations, cross-border transfers of patient data must comply with UK GDPR Chapter V restrictions on international data flows.
How Do You Implement Power BI Row-Level Security for Healthcare?
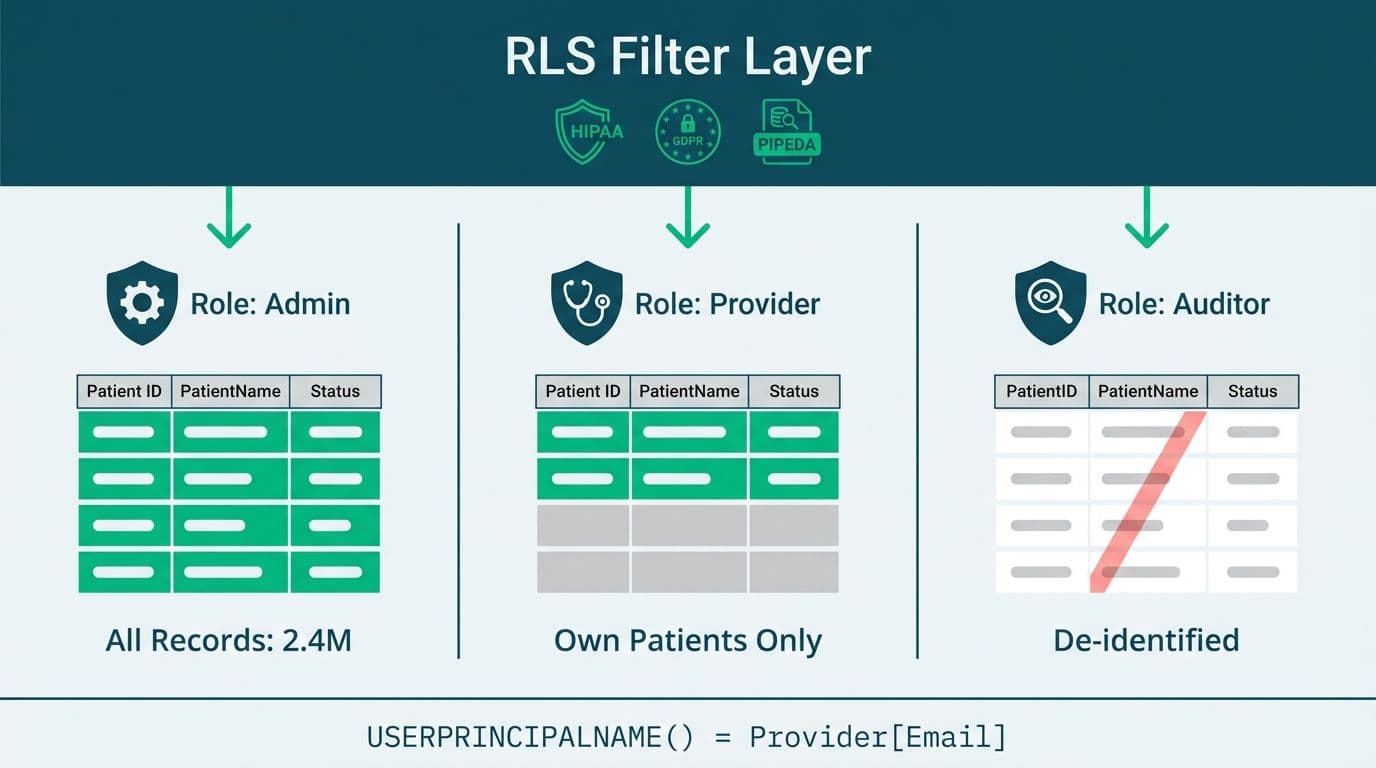
Power BI row-level security (RLS) in healthcare maps directly to HIPAA's minimum-necessary standard: each user sees only the patient records relevant to their care role or administrative scope.
The standard approach uses a dynamic RLS DAX filter on the provider or facility dimension:
```
[NPI] = USERPRINCIPALNAME()
```
This evaluates at query time against the signed-in user's Azure AD UPN, filtering the provider dimension to a single NPI and cascading the filter through all related fact tables. A department-level variant replaces NPI with a DepartmentCode column joined to a SecurityMap table that lists which UPNs map to which departments.
| RLS Pattern | Filter Grain | Typical Use Case |
|---|---|---|
| NPI-level filter | Individual provider | Physician portal, personal quality scorecard |
| Facility-level filter | Facility NPI or CCN | Regional administrator, site CFO |
| Role-based group filter | Department or specialty | Department heads, care team leads |
| Break-glass override | No filter (admin role) | Compliance officer, audit team |
Apply Object Level Security (OLS) alongside RLS to hide PHI columns - date of birth, SSN, MRN - from report-level users who do not need them. OLS is configured in Tabular Editor or the Power BI Service dataset settings (Microsoft Power BI documentation, 2025). During development, use the "View as roles" feature in Power BI Desktop to verify that each RLS role returns only the expected records before publishing to production.
For a practical side-by-side comparison of RLS across legacy BI platforms and Power BI, the Cognos Security Model vs Power BI RLS guide is useful for teams migrating from enterprise platforms. UK NHS trusts face additional IG Toolkit requirements alongside UK GDPR Article 5 data-minimisation obligations; the HIPAA compliant BI tools guide covers the overlap between US and UK regulatory requirements in detail.
What Does a Power BI Healthcare Dashboard Template Look Like in Practice?
A Power BI healthcare dashboard template built on the star schema above typically organizes into three report layers, each with different refresh requirements.
Operational layer - refreshed every 15-30 minutes via DirectQuery or Streaming Dataset: ED wait times, bed availability, and current census. The Hospital Patient Flow and Bed Capacity Dashboard guide covers this layer in detail, including threshold alerting and nurse-to-patient ratio visuals.
Clinical quality layer - daily refresh via Import mode: readmission rates by DRG, HCAHPS scores, length-of-stay benchmarks, and risk-stratified patient panels. A US health system might compare 30-day readmission rates by facility against CMS national benchmarks; a Canadian hospital might track ALC (Alternate Level of Care) days against provincial targets; an NHS trust in England monitors RTT (Referral to Treatment) waiting-time trajectories against the 18-week constitutional standard.
Revenue cycle layer - daily or weekly refresh: claim denial rates by payer, days in accounts receivable, net revenue per adjusted discharge. This layer connects to the claims fact table and is the most sensitive from a HIPAA minimum-necessary standpoint - apply the strictest RLS roles here and audit membership in break-glass roles at least quarterly.
Composite models let all three layers coexist in one .pbix file: the operational layer connects via DirectQuery to an Azure SQL or Synapse endpoint, while the clinical quality and revenue cycle layers use Import mode from the same warehouse. Microsoft's composite model documentation (2025) confirms that relationships between Import and DirectQuery tables are supported when the DirectQuery source is accessed through a supported gateway.
Star Schema vs. Flat Table: Which Performs Better for Healthcare Analytics?
This decision comes up whenever teams migrate from EHR-native reporting tools or legacy platforms that export wide CSVs.
| Dimension | Star Schema | Wide Flat Table |
|---|---|---|
| DAX query speed | Fast - low-cardinality FK joins | Slower - high column count, poor compression |
| RLS implementation | Clean - filter on dimension table | Complex - filter on repeated text columns |
| SCD2 history | Native - versioned dimension rows | Requires row duplication or complex DAX |
| Vertipaq storage | Compact - integer FKs compress well | Inflated - text values repeat across rows |
| FHIR/HL7 mapping | Natural - resources map to dimensions | Manual flattening required every ETL cycle |
| Schema maintenance | Add dimension attributes independently | Column changes ripple across all rows |
The star schema outperforms on every axis for healthcare-scale data volumes. The practical exception is small departmental reports: if a single clinical department needs a five-column table with fewer than 100,000 rows and no cross-user RLS requirements, a flat Power Query table is faster to deliver and easier to maintain. At hospital system scale - tens of millions of encounter rows spanning multi-year claims history - the star schema is not optional; it is the architecture that makes sub-second Power BI report performance achievable and HIPAA-compliant access control manageable.
---
About Lets Viz: Lets Viz is a data analytics consultancy serving US healthcare systems, UK fintech firms, Canadian manufacturing companies, and global SaaS businesses since 2020. The team holds a 5.0 Clutch rating and specializes in governed Power BI environments, HIPAA- and GDPR-aligned data architecture, and clinical analytics at scale.
If your team is designing or rebuilding a clinical data model and needs an architecture review, an RLS audit, or end-to-end delivery, explore Managed Power BI for healthcare teams.