DAX CALCULATE Function: Finance Examples for FP&A
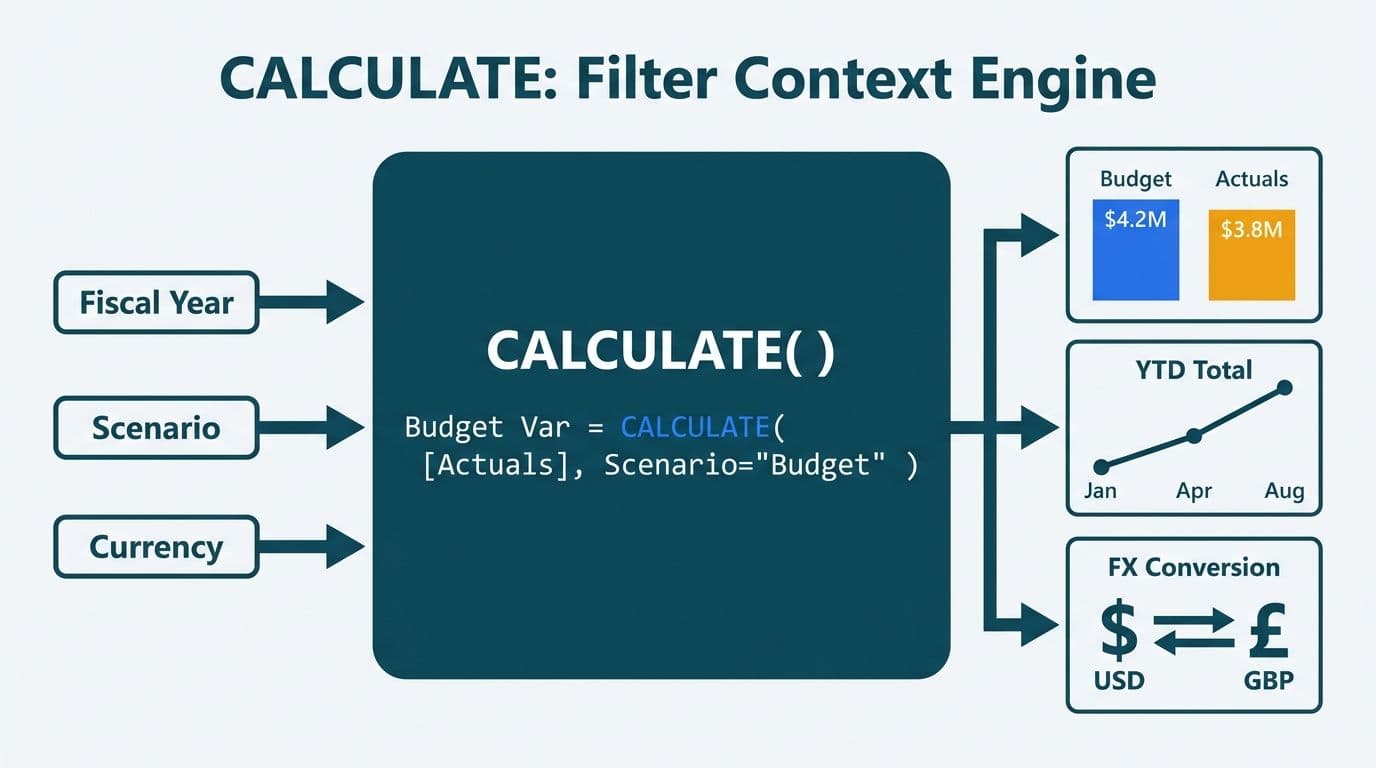
The DAX CALCULATE function modifies filter context - swapping, adding, or removing filters - so a single measure can compare budget to actuals, compute YTD totals, or convert currencies without duplicating data models. For CFOs and FP&A teams, it is the core engine behind every meaningful variance report in Power BI. Mastering context modification unlocks fiscal-year-aware finance reporting across US, UK, and Canadian calendar conventions.
Key Takeaways
- CALCULATE wraps any DAX expression in a new filter context, making it the foundation for budget-vs-actuals, YTD, and currency measures.
- The DATESYTD and TOTALYTD helper functions are shortcuts built on CALCULATE - understanding CALCULATE first makes them predictable.
- Fiscal-year end dates differ by region: April 5 in the UK, March 31 in Canada (federal), and varied across US industries - your date table must encode this.
- Multi-currency reporting requires a separate exchange-rate table; CALCULATE filters it by currency code and date to avoid cross-filtering errors.
- CALCULATE can transition row context to filter context inside calculated columns - the EARLIER function in DAX is the alternative when the outer row value must be preserved.
What Does CALCULATE Do to Filter Context?
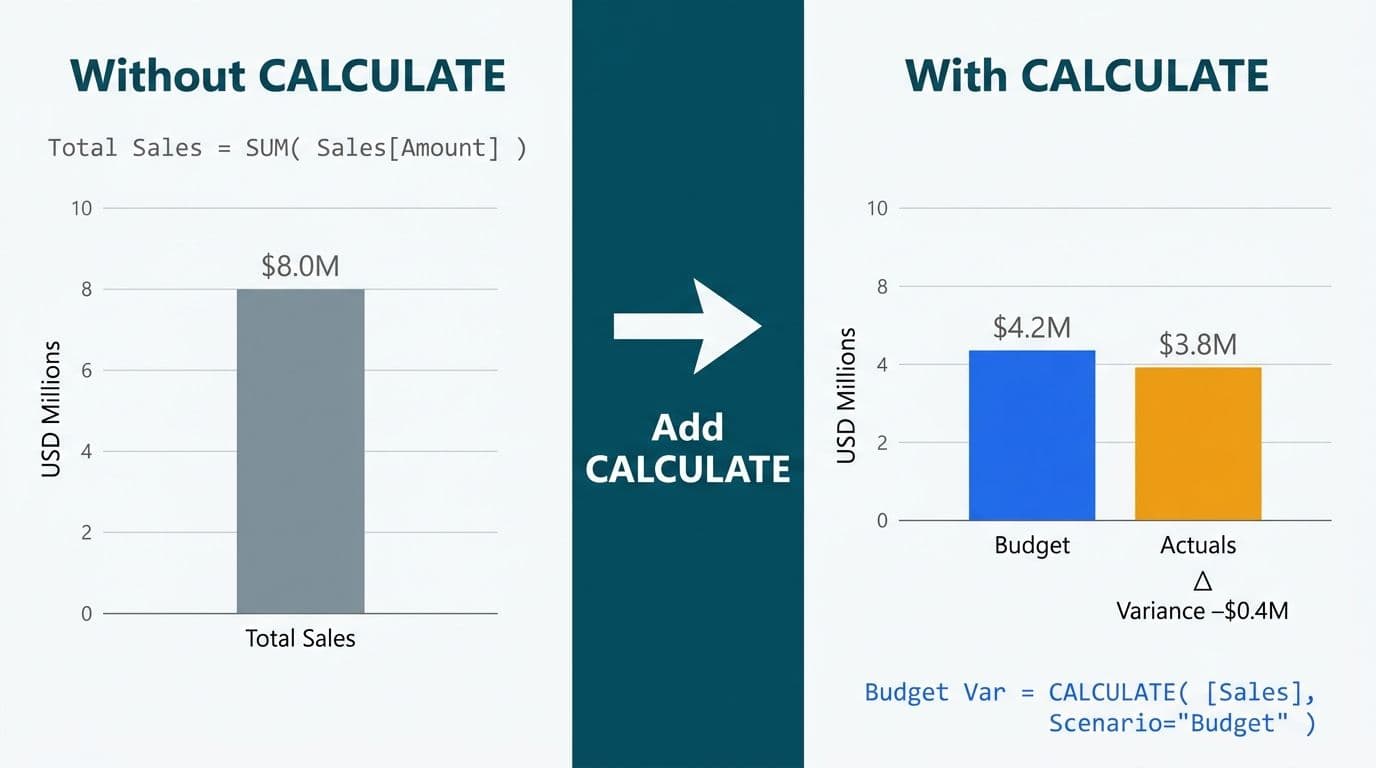
CALCULATE evaluates any DAX expression after replacing or layering new filter conditions over the current evaluation context. According to Microsoft's DAX reference documentation (2025), CALCULATE is the only function that can transition row context to filter context - a distinction that separates well-performing models from ones that silently produce wrong numbers.
Every row in a Power BI visual creates a filter context: the product row filters to that product, the month column filters to that month. CALCULATE intercepts that context and can add filters, remove them with ALL, or restrict them further with KEEPFILTERS. The three patterns finance teams use most often are budget comparison, time intelligence, and currency conversion.
Power BI for SaaS finance teams depends on all three; a well-structured semantic model separates budget and actuals into distinct fact tables sharing a common date and cost-center dimension.
How Do You Build a Budget-vs-Actuals Measure with DAX CALCULATE Function Finance Examples?
A budget-vs-actuals comparison needs two core measures - one for actuals, one for budget - and a variance measure. CALCULATE makes the budget measure reliable even when budget and actuals live in separate tables.
```dax
Actuals Revenue =
SUM( FactActuals[Amount] )
Budget Revenue =
CALCULATE(
SUM( FactBudget[Amount] ),
ALL( FactActuals ) // clear filter bleed from the actuals side
)
Revenue Variance =
[Actuals Revenue] - [Budget Revenue]
Revenue Variance % =
DIVIDE( [Revenue Variance], [Budget Revenue], BLANK() )
```
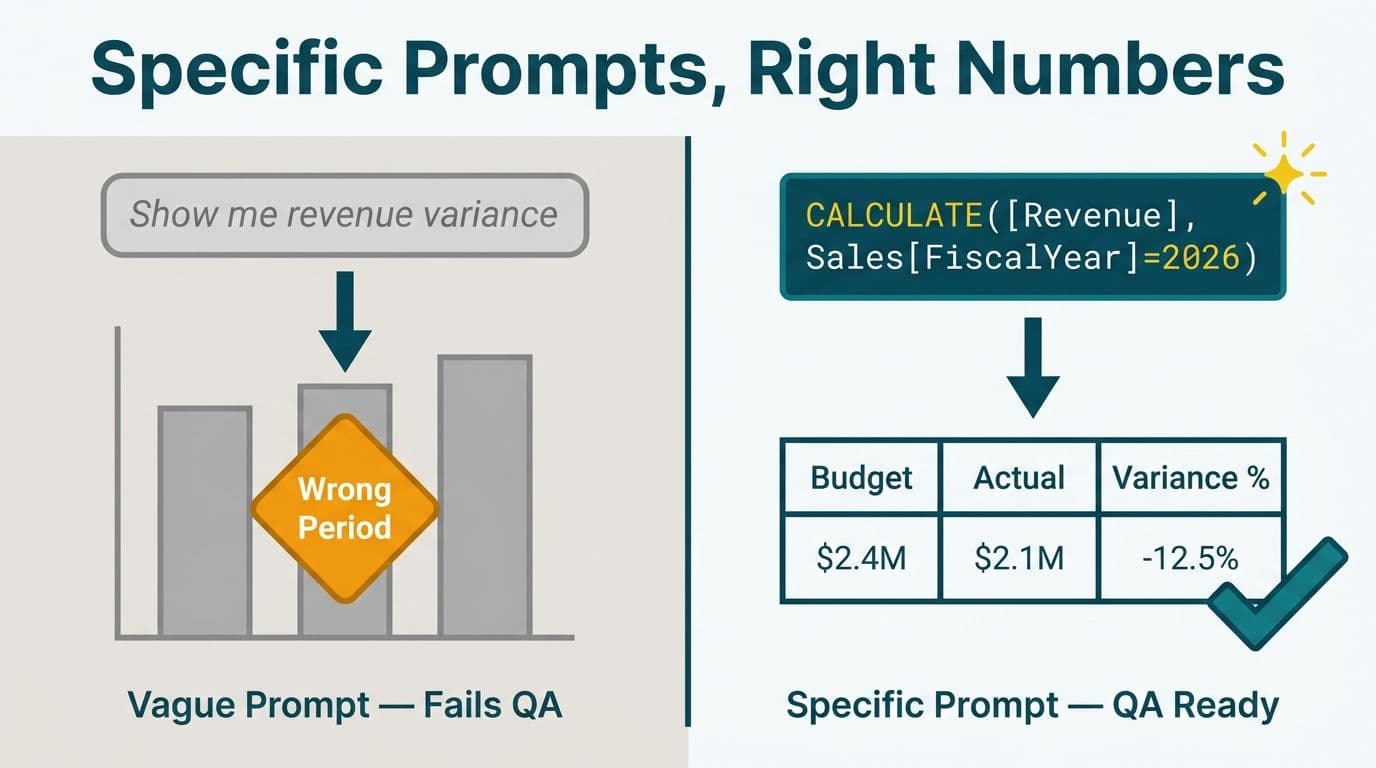
The ALL( FactActuals ) argument clears filters that bleed across relationships when both tables share a cost-center or department dimension. Without it, a cost-center slicer can silently suppress budget rows that have no matching actuals entry. DIVIDE is preferred over the "/" operator because it returns BLANK instead of an error when the denominator is zero - important in the first weeks of a fiscal year when budget entries may not yet be loaded.
A US SaaS finance team on a January-to-December fiscal year can drop these measures directly into a matrix visual with months on columns and departments on rows. For scenarios that need prior-period actuals alongside current-year budget, explore the CROSSFILTER DAX patterns used when your model applies bidirectional relationships between dimension tables.
How Do You Write YTD Totals with CALCULATE and DATESYTD?
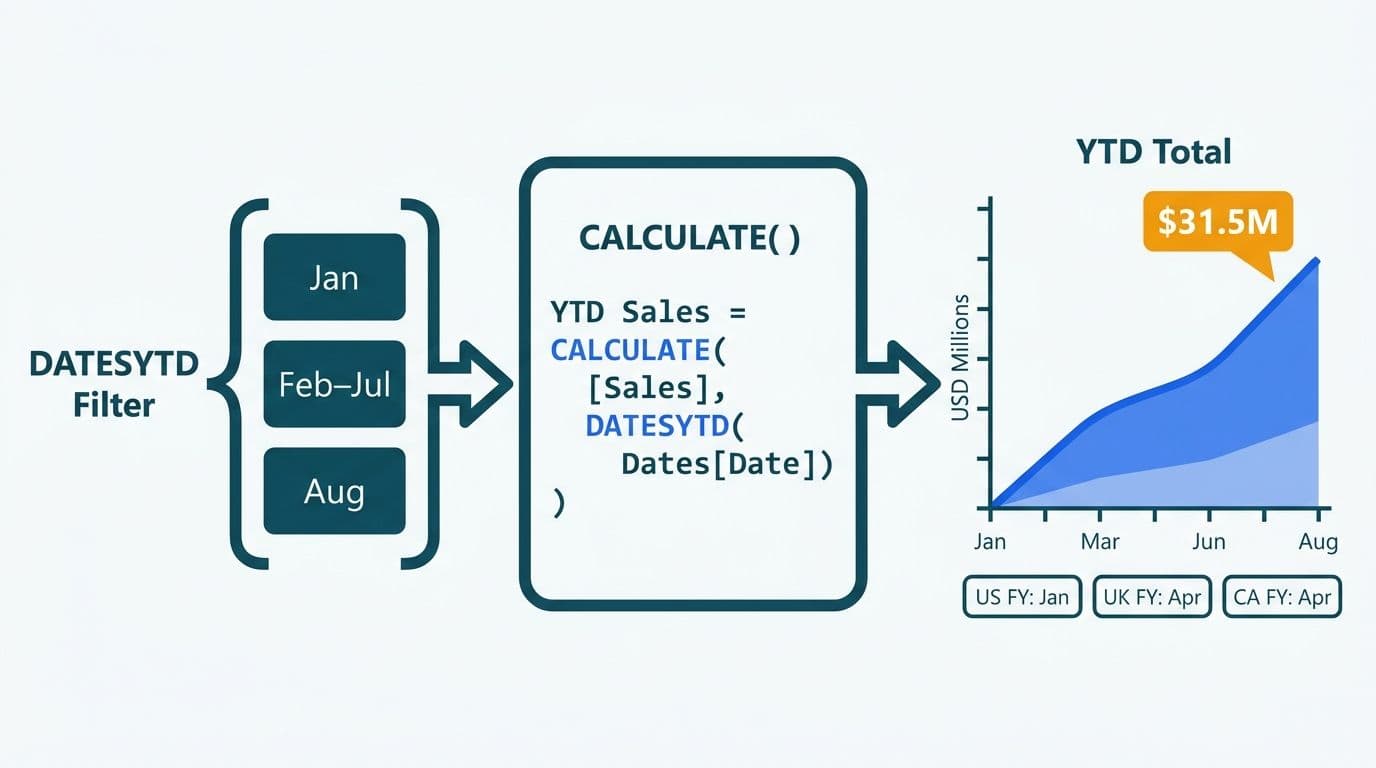
Year-to-date totals expand the date filter backward from the last visible date to the fiscal year's start. CALCULATE achieves this with DATESYTD as its filter argument. DATESYTD accepts an optional year-end date in "MM/DD" format, which is where fiscal-year variation is encoded:
```dax
// US default - calendar year
Revenue YTD =
CALCULATE( [Actuals Revenue], DATESYTD( 'Date'[Date] ) )
// UK fiscal year ending April 5
Revenue YTD UK =
CALCULATE( [Actuals Revenue], DATESYTD( 'Date'[Date], "4/5" ) )
// Canada federal fiscal year ending March 31
Revenue YTD Canada =
CALCULATE( [Actuals Revenue], DATESYTD( 'Date'[Date], "3/31" ) )
// Prior-year YTD for variance
Revenue YTD PY =
CALCULATE( [Revenue YTD], SAMEPERIODLASTYEAR( 'Date'[Date] ) )
YTD Growth % =
DIVIDE( [Revenue YTD] - [Revenue YTD PY], [Revenue YTD PY], BLANK() )
```
Rather than hardcoding year-end dates, many FP&A teams store the fiscal year end in a model parameter and reference it inside DATESYTD. This makes the semantic model portable across entities - useful for Canadian enterprise groups where a parent uses a December year-end but subsidiaries report on a March fiscal close.
The EARLIER function in DAX calculated columns provides an alternative for running totals computed at data-refresh time. In FP&A practice, measures outperform calculated columns because they respond to slicer context; calculated columns are static until the next refresh. The EARLIER function in DAX is a deliberate tool for specific column-based row comparisons, not a substitute for time intelligence measures.
How Do You Handle Multi-Currency Measures with CALCULATE?
Multi-currency reporting requires a separate exchange-rate fact table keyed on CurrencyCode and Date. The CALCULATE inside SUMX narrows that table to a single rate before VALUES extracts it:
```dax
Revenue USD =
SUMX(
FactActuals,
FactActuals[Amount]
- CALCULATE(
VALUES( FactExchangeRates[Rate] ),
FILTER(
FactExchangeRates,
FactExchangeRates[CurrencyCode] = FactActuals[CurrencyCode]
&& FactExchangeRates[Date] = FactActuals[TransactionDate]
)
)
)
```
Without the inner CALCULATE, the row-iteration context from SUMX does not automatically propagate to FactExchangeRates when the tables share no direct relationship.
UK fintech teams and EU subsidiaries reporting under IFRS typically require average monthly rates for P&L items and spot rates for balance-sheet items. That means two exchange-rate measures: one filtering to month-end dates, one using AVERAGEX across the month. CALCULATE handles both - the filter argument simply changes. For organizations managing FP&A across geographies, the Fabric Lakehouse Finance Analytics guide covers centralizing exchange-rate tables in a lakehouse so multiple semantic models draw from a single authoritative source.
How Do You Adapt CALCULATE for Fiscal-Year Variations in the US, UK, and Canada?
The fiscal calendar is the most common source of confusion when deploying CALCULATE-based time intelligence across regions. The table below maps the most common configurations:
| Region | Fiscal Year End | DATESYTD Parameter | Common Industries |
|---|---|---|---|
| US (most SaaS / tech) | December 31 | (omit - default) | Software, cloud, VC-backed |
| US (retail / federal) | September 30 | "9/30" | Retail, US federal agencies |
| UK (listed companies) | March 31 | "3/31" | Banking, listed firms |
| UK (personal / HMRC) | April 5 | "4/5" | SMEs, advisory firms |
| Canada (federal) | March 31 | "3/31" | Government, crown corporations |
| Canada (corporate common) | December 31 | (omit - default) | Manufacturing, enterprise SaaS |
The cleanest implementation encodes fiscal-year membership directly in the date table as a calculated column:
```dax
// Add to your date dimension table
Fiscal Year =
"FY" &
IF(
'Date'[Month Number] >= [FiscalYearStartMonth],
'Date'[CalendarYear] + 1,
'Date'[CalendarYear]
)
```
Replace `[FiscalYearStartMonth]` with a what-if parameter or config table value. This lets a UK fintech entity and a Canadian manufacturing subsidiary share one semantic model by switching a single parameter rather than maintaining separate PBIX files per geography.
For GDPR-sensitive UK and EU environments, the compliance concern is which transaction records flow into the model upstream - not the date table itself. Finance teams handling GDPR reporting obligations should review the AI Automation Compliance Checklist for Finance Teams before deploying automated refresh pipelines pulling from ERP or payroll systems. Canadian organizations subject to PIPEDA should apply the same scrutiny to any model aggregating employee or customer financial data.
What Is the Difference Between CALCULATE and CALCULATETABLE?
CALCULATE returns a scalar value. CALCULATETABLE returns a filtered table. The filter arguments work identically; the difference is what the calling expression expects. In finance DAX, CALCULATETABLE appears most often inside SUMX or AVERAGEX where a table must be pre-filtered before iteration:
```dax
// Budget rows for one cost center, iterated by SUMX
Engineering Budget =
SUMX(
CALCULATETABLE( FactBudget, FactBudget[CostCenter] = "Engineering" ),
FactBudget[Amount]
)
```
Use CALCULATE when the caller expects a number; use CALCULATETABLE when the caller expects a table (SUMX, AVERAGEX, COUNTROWS, and similar iterators).
Common CALCULATE Mistakes Finance Teams Make
1. Missing ALL() on cross-table filters. When budget and actuals share a dimension, filters bleed across relationships. Wrapping the non-target table with ALL() isolates the calculation and prevents slicers from suppressing budget rows that lack matching actuals.
2. CALCULATE in calculated columns. A CALCULATE column evaluates once at refresh and ignores slicers. The EARLIER function in DAX calculated columns is the right tool when a column needs to reference an outer row's value during iteration. For anything slicer-responsive, write a measure.
3. Hardcoded fiscal year end dates. A model locked to "3/31" breaks the moment a newly acquired subsidiary operates on a different calendar. Parameterize from the start.
4. Ignoring blank propagation. CALCULATE can suppress BLANK rows in certain filter combinations. Test every measure against date ranges with no transactions - the expected result for FP&A measures is BLANK(), not zero. Zero instead of blank misleads budget owners about whether data is absent or spend was genuinely nil.
5. Overusing KEEPFILTERS. KEEPFILTERS adds a filter on top of existing context rather than replacing it - useful for row-level security, but capable of unexpected intersections in budget matrices. Always profile with Performance Analyzer before deploying it on large finance models.
Consistent measure naming, certified measure libraries, and access-control policies reduce the risk of CALCULATE being implemented inconsistently across a finance report estate. The Power BI Governance Best Practices 12-Point Checklist covers all three.
---
About Lets Viz: Lets Viz has delivered Power BI and analytics solutions to finance and operations teams since 2020, serving US healthcare organizations, UK fintech firms, Canadian manufacturing groups, and global SaaS companies. The practice holds a 5.0 Clutch rating, with engagements spanning semantic model design, DAX measure libraries, and FP&A dashboard delivery for mid-market and enterprise clients.
The Power BI for SaaS finance teams service page covers how Lets Viz structures semantic models, measure libraries, and fiscal-calendar configurations for FP&A teams that need reliable budget-vs-actuals and multi-currency reporting across multiple geographies.