AI Automation ROI for Business Operations: 2026 Benchmarks
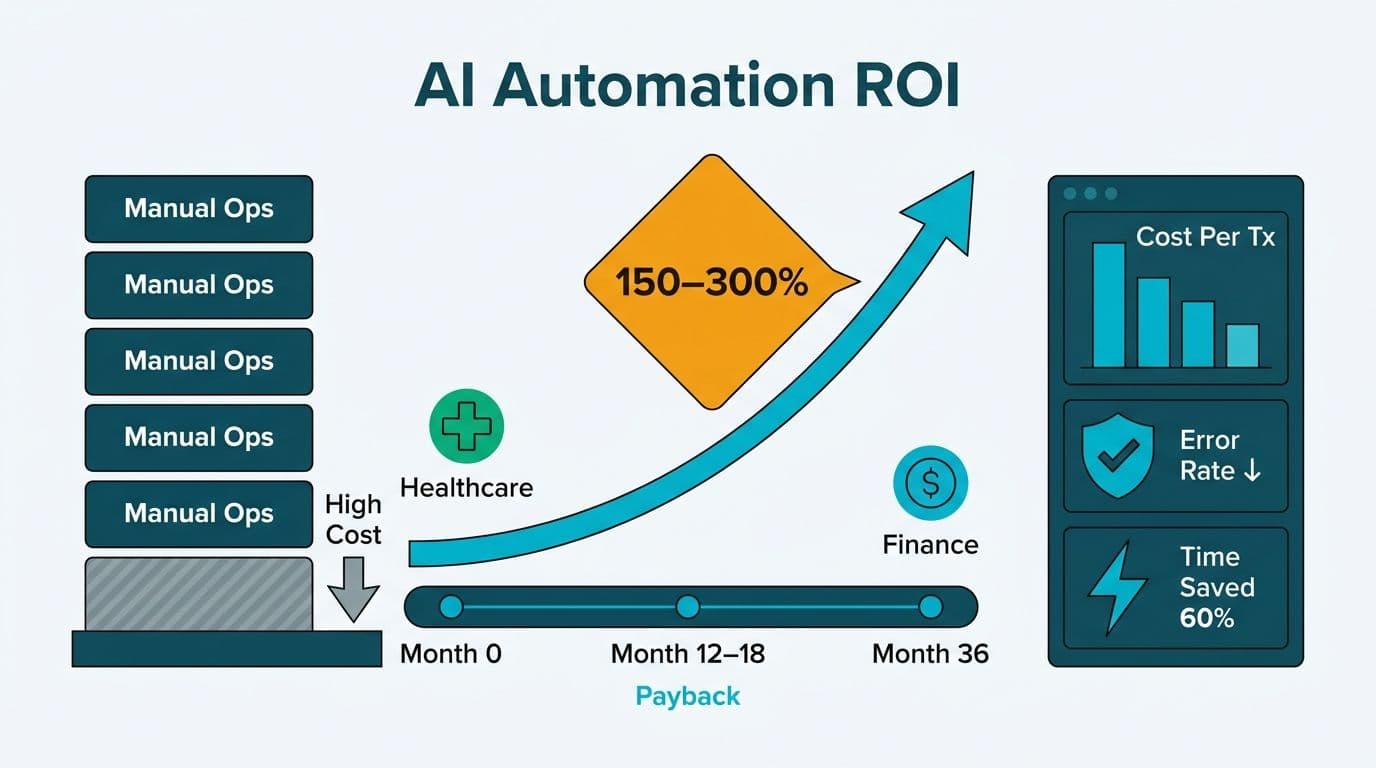
AI automation delivers measurable returns on investment for business operations when implementations are scoped to high-volume, rule-based processes with clear inputs and outputs. Mid-market organisations in healthcare and financial services typically recover implementation costs within 12 to 18 months, with three-year ROI ranging from 150% to 300%. The strongest returns come from time savings on manual workflows, error reduction in data-intensive processes, and lower cost per transaction as volume scales.
Key Takeaways
Mid-market companies typically achieve AI automation payback in 12-18 months for high-volume processes
Healthcare prior authorisation and claims workflows see 60-85% reductions in manual handling time
Finance reconciliation automation reduces errors by 40-70% in most mid-market implementations
Cost per automated process drops sharply once monthly transaction volume exceeds 5,000 units
Compliance architecture - HIPAA for US healthcare, GDPR for UK and EU, PIPEDA for Canada - adds upfront design cost but protects against regulatory penalties that far exceed implementation spend
What Is a Realistic ROI Benchmark for AI Automation in Business Operations?
Realistic ROI benchmarks for AI automation in business operations depend on three variables: process volume, the proportion of transactions that can be handled end-to-end without human intervention, and the baseline cost of the manual alternative. For mid-market organisations (250 to 2,500 employees), a well-scoped programme targeting repeatable, data-heavy workflows typically delivers 150% to 300% ROI over 36 months.
Enterprise demand for implementations that produce auditable returns - not just proof-of-concept pilots - is what drives consulting engagement at this scale. Engaging an AI automation consulting practice with documented industry benchmarks accelerates time-to-value by grounding process selection and tooling decisions in comparable outcomes rather than vendor projections.
The difference between the high and low ends of the ROI range typically comes down to data quality at the point of ingestion. Organisations with well-structured source data - consistent field formats, low null rates, validated reference data - see exception rates below 10% and land at the top of the time-saving range. Organisations with legacy data quality issues typically start at the lower end and improve as automation systems are tuned over their first six to twelve months of operation.
Benchmark ROI by process type:
| Process Type | Time Saving | Error Reduction | Payback Period |
|---|---|---|---|
| Invoice processing | 70-85% | 60-75% | 9-14 months |
| Claims adjudication (healthcare) | 60-80% | 50-65% | 12-18 months |
| Financial reconciliation | 55-70% | 40-70% | 10-16 months |
| Compliance reporting | 50-65% | 55-80% | 14-20 months |
| Customer onboarding | 45-65% | 35-55% | 12-24 months |
These ranges reflect full-loop automation - ingestion, transformation, decision routing, and exception flagging - rather than partial workarounds that still require substantial manual oversight at each stage.
How Do Healthcare Organisations Measure AI Automation ROI?
Healthcare organisations measure AI automation ROI through administrative cost reduction, denial rate improvement, and clinician time recapture. The administrative layer - billing, prior authorisation, scheduling, and compliance reporting - represents the highest concentration of automatable volume in most health systems and the clearest baseline cost to benchmark against.
Organisations that pair analytics capability with workflow automation see compounding returns: cleaner data reduces exception rates, which reduces manual review time, which lowers cost per claim processed.
A US hospital network processing 50,000 claims per month at an average manual handling cost of USD 4.50 per claim carries a baseline annual spend of USD 2.7 million for that process alone. Automating 75% of those claims at a system cost of USD 0.80 per transaction reduces annual spend by approximately USD 1.05 million - before accounting for denial rate reduction or faster reimbursement cycles.
HIPAA compliance is a non-negotiable design constraint for US healthcare automation. Any workflow tool handling protected health information (PHI) must operate within HIPAA-compliant infrastructure. Teams evaluating n8n HIPAA compliant workflow automation face a genuine architectural decision: n8n self-hosted vs cloud compliance is not interchangeable. Self-hosted deployments give IT teams full control over PHI data residency, while cloud-hosted configurations require a reviewed Business Associate Agreement (BAA) and careful assessment of data processing boundaries before any PHI flows through the system.
For a broader view of automation ROI across healthcare and financial services functions, AI analytics use cases in healthcare finance covers the full range of process categories where analytics-driven automation creates measurable value.
What Does AI Automation ROI Look Like in Financial Services?
In financial services, AI automation ROI concentrates in three process categories: reconciliation, regulatory reporting, and client onboarding. Each is characterised by high transaction volume, strict audit requirements, and significant manual intervention under current operating models.
Research from the World Economic Forum (2026), drawing on input from over 100 experts representing more than 50 financial services organisations, identifies automation of compliance and risk workflows as the highest near-term ROI category - ahead of customer-facing AI applications. The reasoning is straightforward: compliance errors carry regulatory penalties that typically dwarf automation implementation costs.
Mid-market financial services automation ROI is also consistently underestimated in initial business cases because calculations focus on direct labour cost avoidance while omitting downstream effects - faster month-end close enabling earlier management decisions, lower audit preparation costs from cleaner transaction trails, and reduced regulatory remediation work from more consistent rule application.
Fintech teams running daily multi-currency reconciliation across multiple ledger systems consistently find that automating the matching and exception-flagging steps delivers some of the strongest payback periods in financial services. A mid-size UK fintech processing 90,000 daily FX transactions across four ledger systems reduced reconciliation from a six-person manual team to two oversight analysts after automation, dropping cost per matched transaction from GBP 1.40 to GBP 0.11 and reaching payback in under 11 months - a result that holds across similar implementations because the process logic is well-defined enough to keep exception rates below 8%.
GDPR compliance shapes automation architecture for UK and EU organisations in ways that directly affect long-term ROI. Data minimisation requirements mean automation pipelines must avoid retaining personal data beyond its processing window - adding design complexity upfront but reducing breach exposure over the system's lifetime. Fines under GDPR can reach 4% of global annual turnover, making compliance investment a form of risk management that pays measurable dividends.
For Canadian financial services firms, PIPEDA is now being superseded by the Consumer Privacy Protection Act (CPPA), which came into force in 2026 and imposes stricter consent requirements and mandatory breach notification timelines. A Canadian wealth management firm automating client suitability reporting needs to ensure that data flows between systems carry appropriate consent records - a requirement that is most cost-effective when built into the automation architecture from the start rather than retrofitted after deployment.
The best AI tools for finance professionals vary by use case, but the ROI calculation across reconciliation, forecasting, and reporting follows the same logic: volume multiplied by manual cost per transaction multiplied by reduction percentage, minus automation implementation and operating cost.
How Do You Calculate Cost Per Automated Process?
Cost per automated process is the most actionable metric for comparing automation investments across different workflows. The formula:
Cost per automated process = (Annual system cost + Annual maintenance cost) / Annual transaction volume
A finance team running 60,000 monthly invoice matches through an n8n workflow automation setup - self-hosted on existing infrastructure - might carry total annual system costs of USD 18,000 in licensing, hosting, and maintenance. At 720,000 annual transactions, that is USD 0.025 per transaction, compared to a manual cost of USD 2.80 per invoice match. The ROI arithmetic is unambiguous.
The calculus changes for lower-volume, higher-complexity processes. A compliance reporting workflow handling 200 submissions per month at USD 18,000 annual system cost runs to USD 7.50 per submission - which may still justify automation if the manual alternative costs USD 35 to USD 60 per submission in senior analyst time.
Three factors that shift cost per process significantly:
Integration depth: Workflows spanning five or more systems cost more to build and maintain than single-system automations. Factor this into baseline cost estimates before committing to scope.
Exception rate: If 20% of transactions require human review, effective automation coverage is 80% - and cost per fully automated transaction rises accordingly.
Tooling choice: Understanding how to build AI agents with n8n enables intelligent routing and conditional logic that reduces per-process cost. n8n workflow automation for digital agencies and mid-market finance teams offers a favourable cost structure relative to enterprise-licensed alternatives, particularly at volumes below 500,000 monthly transactions.
For a structured comparison of build vs buy tradeoffs across automation tooling, the open source AI workflow automation tools guide evaluates total cost of ownership at mid-market scale.
What Time Savings Can Mid-Market Companies Expect from AI Automation?
Time savings from AI automation are most reliably measured at the process level, not the headcount level. Projecting headcount reduction overstates short-term ROI and understates actual value, which is capacity reallocation toward higher-value analytical and decision-support work.
A US SaaS finance team that automates its monthly close process - reconciliation, intercompany eliminations, and variance commentary - typically recaptures 60 to 80 analyst hours per close cycle. Those hours are redirected toward forward-looking analysis, producing faster close cycles and higher-quality management reporting from the same team. ROI shows up in decision speed and analytical depth, not only cost avoidance.
In healthcare, the time savings calculus is more acute. Prior authorisation workflows at a mid-size US health system can consume 20 to 30 minutes of clinical or administrative staff time per request. Automating data gathering, eligibility checking, and initial routing reduces that to 3 to 5 minutes of review time. At 500 requests per week, that is 125 to 225 hours per week recaptured - the equivalent of three to five full-time positions redirected to patient-facing care.
Time savings benchmarks across industries:
| Industry | Process | Manual Time | Automated Time | Saving |
|---|---|---|---|---|
| Healthcare (US) | Prior authorisation | 20-30 min | 3-5 min | 80-85% |
| Finance (US/CA) | Monthly reconciliation | 4-8 hrs/cycle | 30-60 min | 85-90% |
| Fintech (UK/EU) | Regulatory report assembly | 6-10 hrs | 45-90 min | 85-88% |
| Healthcare (CA) | Patient record updates | 8-12 min each | 1-2 min each | 80-85% |
| Finance (US) | Invoice matching | 2-4 min each | under 5 seconds | 97-99% |
When Should You Review and Recalibrate Your AI Automation ROI?
ROI from AI automation is not static. Process volumes change, exception rates shift as models are tuned, and integration maintenance costs evolve as upstream systems are updated. Best practice is a quarterly review of cost per process and a formal annual ROI assessment against the original business case.
Three signals that automation ROI has degraded:
1. Exception rate rising above 25%: Indicates the underlying data or process logic has drifted from the automation's baseline assumptions, requiring model or rule updates.
2. Integration maintenance consuming more than 15% of annual system cost: Points to fragile automation architecture that is absorbing upstream system changes inefficiently.
3. Time-to-resolution for failed transactions increasing: Suggests a gap in exception-handling design that is creating manual bottlenecks downstream of the automated step.
Recalibration reviews should also capture regulatory changes. For US healthcare organisations, HIPAA enforcement priorities shift periodically. For Canadian organisations, the CPPA's stricter breach notification and consent portability requirements - now in effect as of 2026 - mean automation architectures designed with compliance adaptability built in from the start are significantly less costly to update than those where compliance was retrofitted.
One practical approach is to instrument automation pipelines from day one with monitoring dashboards that track exception rates, processing times, and error flags in real time. This converts ROI measurement from a periodic manual exercise to a continuous operational signal - making recalibration decisions faster and more defensible when presenting to finance or operations leadership.
Before finalising any automation programme, the AI workflow automation mistakes pre-launch checklist identifies the most common design and governance errors that erode ROI before a system reaches full production volume.
Ready to build an automation programme grounded in real industry benchmarks? Lets Viz designs and implements AI automation systems for healthcare and financial services organisations across North America and the UK. Explore AI automation consulting to see how we scope, build, and measure automation ROI for mid-market teams.
---
About Lets Viz: Lets Viz has delivered data analytics and AI automation engagements for US healthcare systems, UK fintech firms, and Canadian manufacturing and financial services organisations since 2020. With a 5.0 Clutch rating and deep expertise across HIPAA, GDPR, and PIPEDA-regulated environments, our consultants bring the compliance rigour and industry benchmarks that mid-market automation projects require to deliver auditable, lasting returns.