What Is Population Health Analytics for Hospitals?
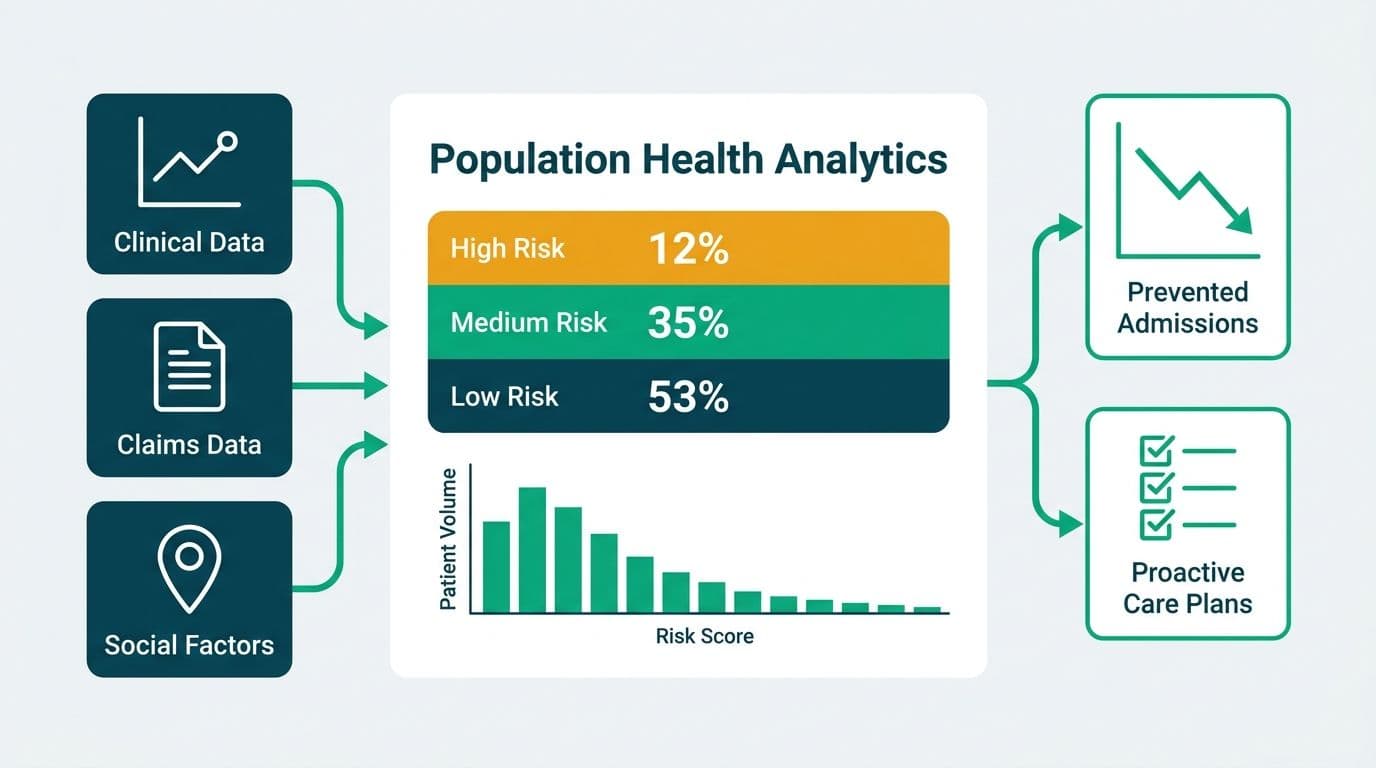
Population health analytics for hospitals is the systematic collection, integration, and analysis of clinical, administrative, and socioeconomic data across defined patient populations to identify risk, reduce preventable admissions, and improve chronic disease outcomes. Rather than treating patients individually, it enables healthcare organisations to act on patterns across entire cohorts - identifying high-risk patients and intervening before a preventable hospitalisation occurs.
Key Takeaways
- Risk stratification segments patients by hospitalisation probability, letting care teams prioritise outreach before a preventable admission occurs.
- Preventable admission rates and 30-day readmission rates are the primary value-based care contract metrics that population health dashboards are built to move.
- Chronic disease prevalence mapping across diabetes, hypertension, COPD, and congestive heart failure cohorts drives resource allocation and disease management programme design.
- Real-world deployments at NHS England and the US Veterans Health Administration demonstrate that interoperable data pipelines - connecting EHR, claims, and social determinants data - are the technical foundation.
- HIPAA-compliant role-based access control, audit logging, and Business Associate Agreements are non-negotiable prerequisites for any US hospital deployment.
What Is Population Health Analytics and Why Do Hospitals Need It?
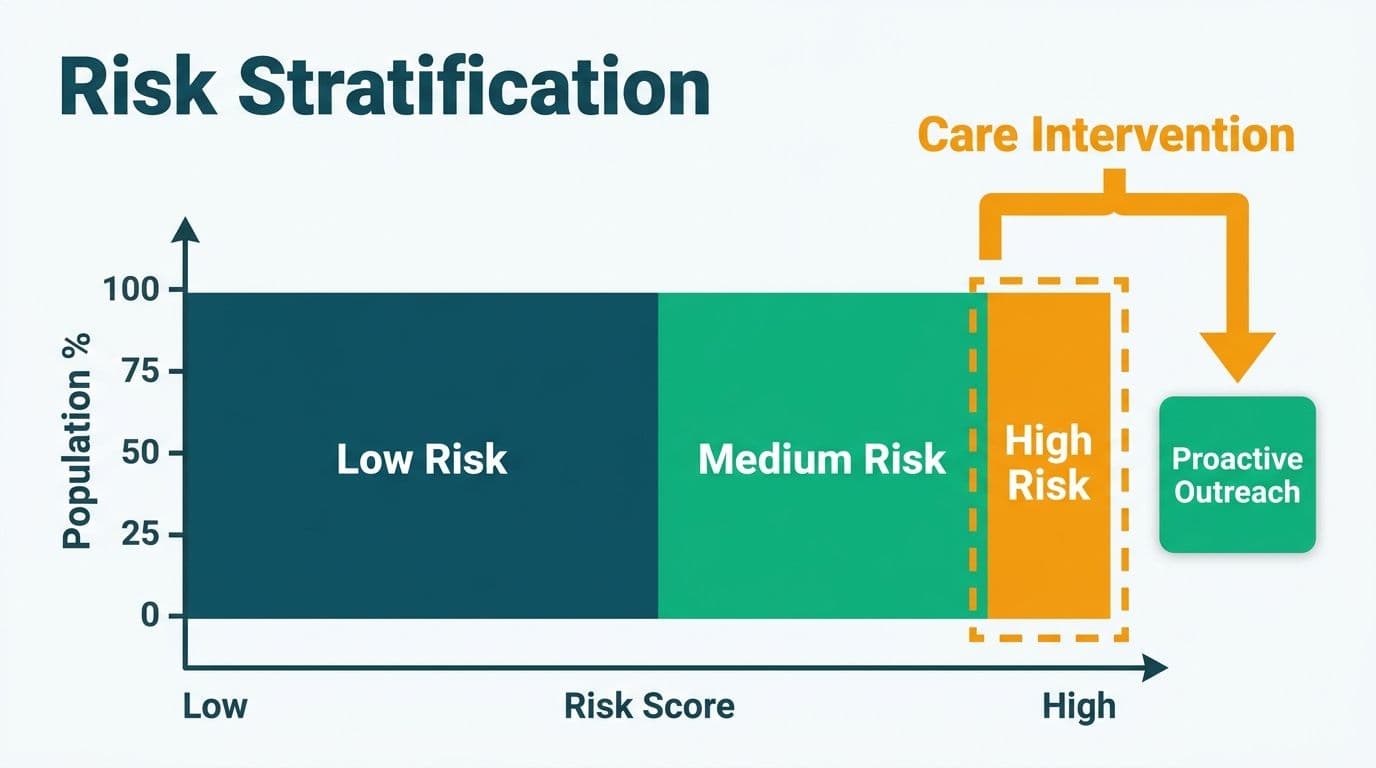
Population health analytics is the discipline of using aggregated patient data to understand health patterns, predict risk, and design interventions at a group level rather than at an individual clinical encounter level. For a hospital system, this translates to three core capabilities: risk stratification (ranking patients by likelihood of hospitalisation or deterioration), chronic disease prevalence reporting (understanding what share of a patient panel carries active diabetes, hypertension, COPD, or CHF diagnoses), and preventable admission rate tracking (measuring the share of admissions that could have been avoided with earlier primary care or care coordination).
The shift from fee-for-service to value-based care contracts - including CMS's Medicare Shared Savings Program in the US and NHS Integrated Care System block contracts in England - has made population health analytics commercially essential, not merely aspirational. A hospital that cannot measure preventable admission rates cannot negotiate accountable care contracts with confidence.
Managed Power BI for healthcare teams is one deployment model that allows health systems to build these dashboards on infrastructure they already control, without replacing their existing EHR.
What Are the Core Metrics in a Population Health Analytics Dashboard?
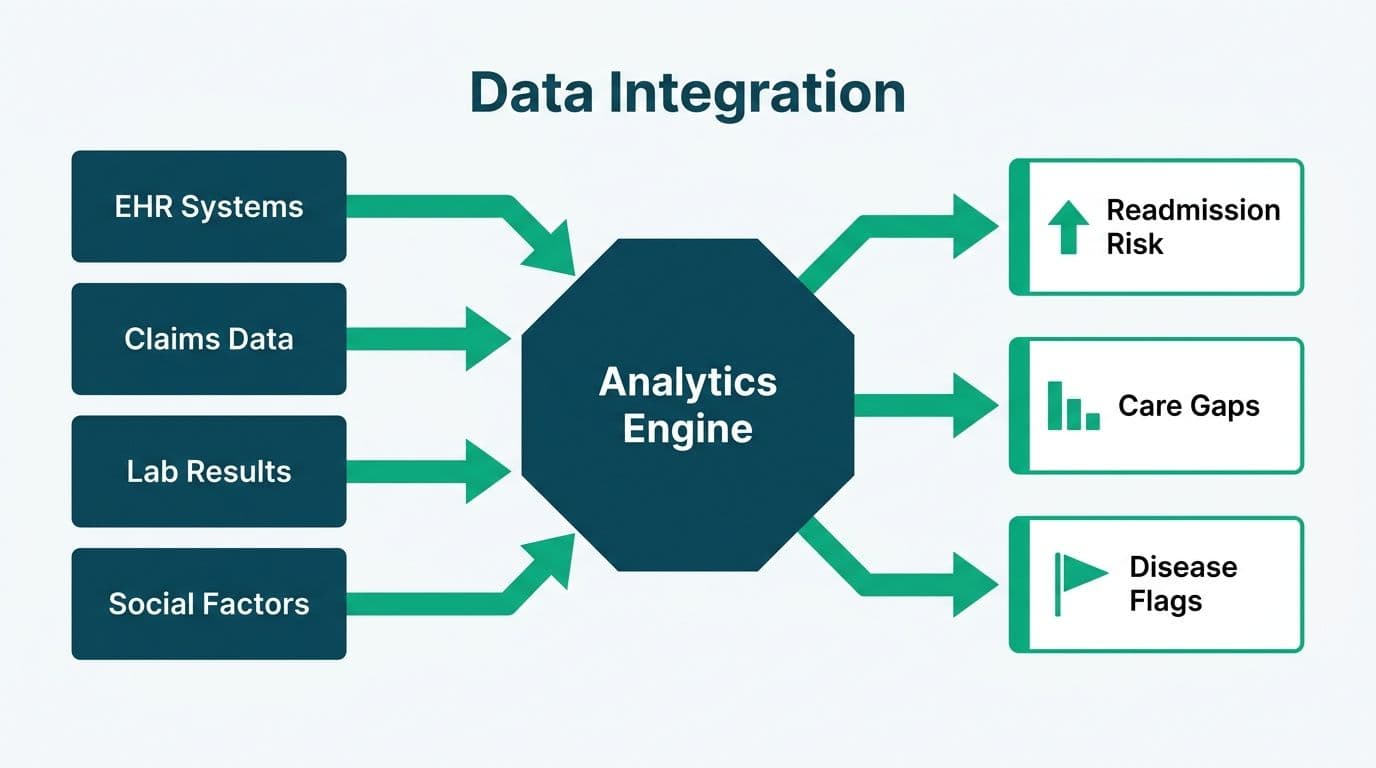
A population health dashboard surfaces six categories of metrics, each mapping to a specific operational or contractual outcome:
| Metric | Definition | Why It Matters |
|---|---|---|
| Risk Stratification Score | Composite predictive score from claims and EHR data ranking hospitalisation probability | Directs care management outreach to highest-need patients first |
| Preventable Admission Rate | Percentage of admissions classified as avoidable per AHRQ Prevention Quality Indicators | Primary VBC contract KPI; CMS tracks this for penalty calculations |
| Chronic Disease Prevalence | Percentage of patient panel with active DM, HTN, COPD, or CHF diagnosis | Drives disease management programme sizing and staffing models |
| 30-Day Readmission Rate | Percentage of patients readmitted within 30 days of index discharge | CMS Hospital Readmissions Reduction Program penalty trigger |
| Medication Adherence Rate | Percentage of patients filling prescriptions on schedule (PDC threshold: above 80%) | Leading indicator for chronic disease deterioration risk |
| ED Wait Time | Minutes from patient arrival to first provider contact | Throughput metric linked to patient satisfaction scores and diversion rates |
For hospitals extending this reporting into financial performance, the related guide on revenue cycle management dashboard metrics covers the billing and collections layer that sits alongside population health data.
How Do NHS England and the Veterans Health Administration Use Population Health Analytics?
NHS England - Integrated Care Systems
NHS England's Integrated Care System (ICS) framework, formalised under the Health and Care Act 2022, requires ICS boards to produce population health management plans for their geographic footprints. NHS trusts aggregate GP records, secondary care data, and community health data into unified population dashboards. NHS England's General Practice Extraction Service feeds anonymised primary care data into stratification tools that rank patients into risk tiers - typically using validated actuarial models - to identify patients appropriate for virtual ward or enhanced primary care intervention. All data processing falls under UK GDPR and the NHS Data Security and Protection Toolkit requirements.
US Veterans Health Administration
The VHA operates one of the largest integrated health systems in the United States and uses population health analytics through its Corporate Data Warehouse (CDW). Its HEDIS-aligned dashboards track preventive care gaps - mammograms, colorectal cancer screenings, and HbA1c testing for diabetic patients - across its enrolled veteran population. The VHA's Care Assessment Need (CAN) score is a validated risk stratification algorithm that predicts 90-day and 1-year hospitalisation risk for each enrolled patient. All VHA data handling complies with HIPAA and VA-specific privacy rules under 38 CFR Part 1.
Canadian Provincial Health Systems
In Canada, provincial health authorities such as Ontario Health operate population health registries that feed regional analytics platforms. A hospital in Ontario might draw on ICES (Institute for Clinical Evaluative Sciences) linked datasets to track chronic disease burden by Local Health Integration Network geography - informing where diabetes prevention or cardiac rehabilitation programmes should be expanded. Canadian health data is governed by PIPEDA at the federal level and by provincial health privacy statutes such as Ontario's Personal Health Information Protection Act (PHIPA).
For more on how public health agencies visualise population-level data, the article on data visualisation examples in public health from WHO, CDC and NHS documents the dashboard design patterns these agencies use at scale.
How Do You Connect Clinical Data Sources to a Population Health Dashboard?
The biggest implementation challenge in population health analytics is not dashboard design - it is data integration. Most US hospitals operate Epic or Oracle Health (formerly Cerner) as their EHR, each of which exposes data through HL7 FHIR R4 APIs under the ONC 21st Century Cures Act information blocking rules that took effect in 2023. Connecting an HL7 FHIR API to Power BI requires an OAuth 2.0 authentication flow, a Power Query custom connector or an intermediary such as Azure API Management, and a semantic model that maps FHIR resources to the flat tables that DAX calculations expect.
The detailed guide on connecting EHR data to Power BI via Epic, Cerner and FHIR covers the technical steps in full. For population health use cases, the key FHIR resources are:
- Patient - demographics, insurance coverage, and primary care attribution
- Condition - active problem list entries that map to chronic disease prevalence cohorts
- MedicationRequest and MedicationDispense - the data foundation for medication adherence analytics dashboards in Power BI
- Encounter - admission, discharge, and transfer records used for preventable admission rate calculation
- Observation - lab results such as HbA1c and blood pressure readings used in clinical risk stratification models
HIPAA compliance in this pipeline requires Business Associate Agreements with all cloud vendors (Microsoft's BAA covers Azure and Power BI Premium), end-to-end encryption in transit and at rest, and row-level security in the semantic model so that a care manager in nephrology cannot query cardiology's patient panel.
What Does a Healthcare Analytics Implementation Roadmap Look Like?
A healthcare analytics implementation roadmap for hospitals follows five phases regardless of vendor or EHR platform:
Phase 1 - Assess (weeks 1 to 4): Inventory existing data sources including EHR, claims adjudication systems, ADT feeds, and Health Information Exchange connections. Identify which population health metrics are contractually required versus aspirational. Define HIPAA data classification tiers across the full dataset.
Phase 2 - Connect (weeks 4 to 10): Build FHIR API connections or HL7 v2 interface engine pipelines. Establish a clinical data repository or extend an existing enterprise data warehouse. In Microsoft environments, Azure Health Data Services provides a managed FHIR server that feeds directly into Microsoft Fabric or Power BI Dataflows.
Phase 3 - Model (weeks 8 to 14): Develop the population health semantic model - patient attribution logic, risk stratification algorithm, and chronic disease cohort definitions. This phase intersects clinical informatics expertise with BI development and is where most projects encounter scope creep.
Phase 4 - Visualise (weeks 12 to 18): Build role-specific dashboards: a Chief Medical Officer view showing system-wide preventable admission rates, a care manager view showing attributed patients ranked by risk score, and an ED charge nurse view surfacing real-time emergency department wait time analytics.
Phase 5 - Govern (ongoing): Implement data quality checks, audit logging, BAA renewals, and a quarterly metric review cycle. Attribution logic in particular requires monthly recalibration as patients change primary care providers or insurance coverage.
How Do Social Determinants of Health Fit Into a Hospital Analytics Dashboard?
Social determinants of health (SDOH) - income, housing stability, food security, transportation access, and education level - are recognised as significant drivers of health outcomes, particularly for chronic disease control and preventable admission rates. A social determinants of health analytics dashboard for a hospital typically integrates three data layers:
1. Patient-level SDOH screening data from tools such as PRAPARE or AHC-HRSN screens administered within the EHR, flagging individual patients with food insecurity, housing instability, or transportation barriers.
2. Census tract-level social vulnerability data from the CDC Social Vulnerability Index (for US hospitals) or the UK's Index of Multiple Deprivation (for NHS trusts), identifying geographic areas where clinical interventions alone are unlikely to move population outcomes.
3. Community resource referral outcomes tracking whether patients screened positive for SDOH needs were successfully connected to food banks, housing navigators, or transportation benefit programmes.
Incorporating SDOH data into risk stratification models improves prediction accuracy in validated research contexts. A patient with controlled HbA1c but documented food insecurity carries a materially different readmission risk profile than the clinical record alone would suggest. CMS quality measure frameworks increasingly create payer incentives for hospitals to screen for and act on this data.
What Operational Metrics Extend Population Health Analytics?
Population health reporting does not exist in isolation from hospital operations. Several adjacent dashboards feed into or complement it directly:
Operating room utilisation analytics: An operating room utilisation analytics dashboard tracks block utilisation rates, case cancellation rates, and turnover times. For hospitals managing large chronic disease cohorts - such as a diabetic population with elevated lower-extremity surgical intervention rates - OR capacity planning must account for the procedural demands those cohorts generate.
Emergency department wait time analytics: ED crowding is both a symptom and a driver of poor population health outcomes. A well-designed emergency department wait time analytics dashboard shows door-to-provider time, left-without-being-seen rates, and boarding hours - metrics that reveal how effectively upstream care management programmes are keeping high-risk patients out of the emergency department.
Patient satisfaction analytics: HCAHPS scores are tied to CMS value-based purchasing payment adjustments. A patient satisfaction analytics dashboard for a hospital should segment scores by care setting, service line, and patient cohort - revealing whether satisfaction gaps align with the same high-risk populations driving preventable admissions.
Medication adherence analytics in Power BI: Non-adherence is one of the most actionable leading indicators in population health. A medication adherence analytics dashboard in Power BI can track proportion of days covered (PDC) by drug class, flag patients falling below the 80% threshold, and trigger outreach through Power Automate workflows connected to the EHR's care management task queue.
Healthcare supply chain analytics: High-volume chronic disease populations drive predictable supply consumption patterns - insulin, glucose monitoring strips, and wound care materials. A healthcare supply chain analytics dashboard aligned to population health cohort data lets materials management anticipate demand cycles rather than react to stock-outs after the fact.
For a deeper look at how payer and ACO organisations layer these metrics into financial performance tracking, the population health management dashboard guide for payers and ACOs covers the actuarial and contractual dimensions in detail.
---
About Lets Viz: Lets Viz has delivered analytics solutions for US healthcare organisations, UK fintech firms, Canadian manufacturers, and global SaaS businesses since 2020, and holds a 5.0 Clutch rating. The team specialises in HIPAA-compliant Power BI deployments, EHR data integration, and population health dashboard design for hospital systems, NHS trusts, and Canadian provincial health organisations.
If your hospital is ready to move from fragmented reporting to a unified population health analytics programme, explore Managed Power BI for healthcare teams to see how Lets Viz structures the engagement from data assessment to governed production dashboards.