Power BI Consulting for Logistics Companies
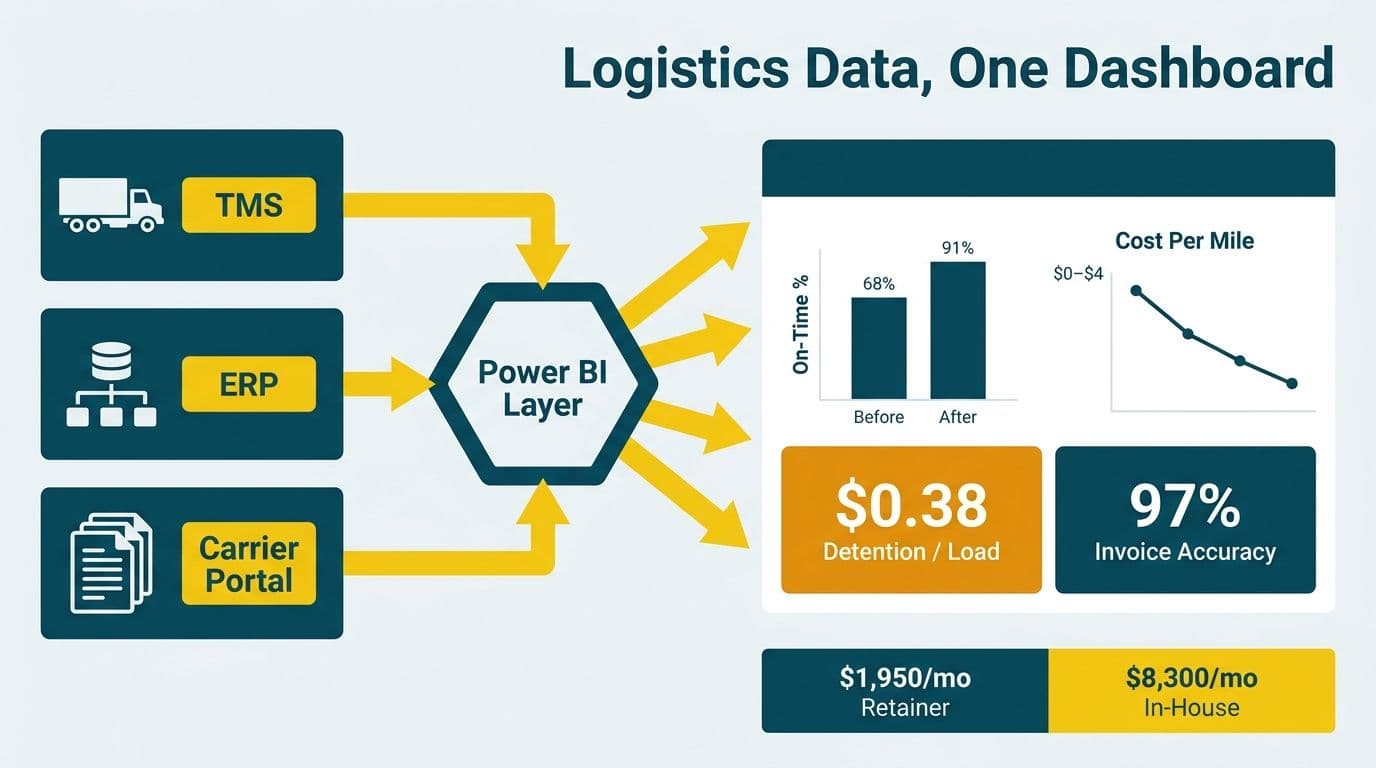
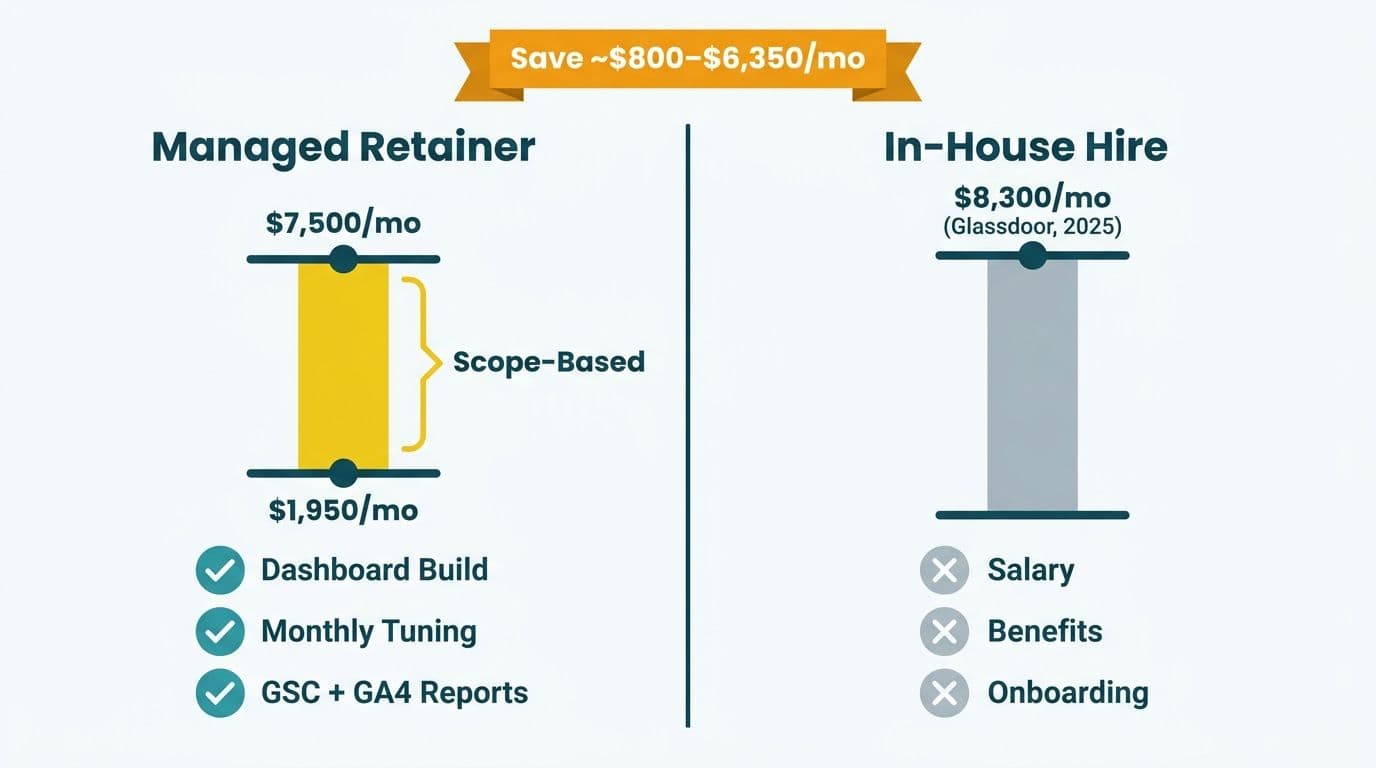
Power BI consulting for logistics companies connects your TMS, ERP, and carrier portals into a unified BI layer, giving ops and finance teams real-time visibility into carrier performance, cost-per-mile, detention charges, and invoice accuracy. Engagements run as managed monthly retainers ($1,950-$7,500/mo depending on scope) and deliver a first working dashboard set within 30 days - no in-house Power BI hire required.
Key Takeaways
- Managed retainers range from $1,950 to $7,500/month - a fraction of the ~$8,300/month fully-loaded cost of an in-house Power BI developer (Glassdoor, 2025)
- First working dashboard set is delivered within 30 days of engagement kick-off, covering core logistics KPIs from day one
- Supported TMS platforms include McLeod, TMW, Aljex, and MercuryGate, connected via ODBC, REST API, or scheduled CSV export
- At the end of any engagement, you own all .pbix files, datasets, and documentation outright - month-to-month with no lock-in
- Workspace configurations address SOC 2 (US), GDPR (UK/EU), and PIPEDA (Canada) compliance requirements by default
Lets Viz delivers Managed Power BI services for healthcare and finance teams -- fully managed analytics, from data model to decision-ready dashboard.
Who Is Power BI Consulting for Logistics Companies the Right Fit For?
This service fits if you:
- Operate a mid-market carrier, 3PL, freight brokerage, or distribution business with data spread across a TMS, ERP, and multiple carrier portals
- Have a finance director or CIO who suspects carrier overcharges but cannot reconcile invoices fast enough to act before they compound
- Are replacing weekly Excel dispatch reports with dashboards that ops managers and finance teams can both use without calling IT
- Want a senior Power BI developer's output without the $100,000/year hiring commitment
This is not the right fit if:
- You have fewer than three data sources and a simpler reporting tool would serve you equally well for less
- Your core need is building EDI integrations or carrier API pipelines from scratch - that is a data engineering project, separate from a BI retainer
What Does Power BI Consulting for Logistics Companies Cost?
A managed retainer almost always delivers better value than ad hoc hourly work for logistics, because your data model and KPIs evolve constantly - new lanes, new carriers, new rate structures.
| Engagement model | Monthly cost | What's included |
|---|---|---|
| Essentials retainer | $1,950/mo | Core dashboard set, monthly updates, email support |
| Growth retainer | $3,950/mo | Multiple report areas, model optimization, Slack support |
| Enterprise retainer | $7,500/mo | Full BI function: governance, custom visuals, training |
| In-house mid-level Power BI developer | ~$8,300/mo (fully loaded) | One person, benefits, PTO, single point of failure |
| Freelance US senior consultant | $150-$200/hr (ad hoc) | No continuity, no retainer structure |
US market retainer rates for mid-market Power BI engagements range from $2,000 to $8,000/month (Robert Half Technology Salary Guide, 2025). Our tiers sit within that range, and the in-house break-even lands at roughly $8,300/month once salary, benefits, and employer taxes are included (Glassdoor, 2025). For most logistics companies in the 150- to 500-employee range, the retainer model clears the ROI bar faster than a hire.
For a full picture of what the engagement includes, see our Managed Power BI services page.
What Does Working With Us Look Like?
Week 1-2: Data audit and source mapping
We connect to your TMS exports, ERP (NetSuite, SAP, Dynamics), and any carrier portals you pull data from. We document data quality issues, missing fields, and the KPIs your ops and finance teams actually track - not what the TMS vendor says you should track.
Week 3-4: First dashboard set delivered
Shipment velocity, on-time delivery by lane, cost-per-mile by carrier, and detention/dwell time are the standard starting set for logistics. Your team reviews drafts in Power BI Desktop or the Power BI service before anything moves to production.
Month 2 onward: Iteration and governance
As lanes change, carriers are onboarded, or finance requests new slicing, we update the model. On Growth and Enterprise tiers, we handle full Power BI governance - row-level security, workspace management, scheduled dataset refreshes, and documentation.
Freight invoice reconciliation: what it looks like in practice
In a 2025 freight-invoice reconciliation engagement for a regional 3PL, we parsed six sample invoices across five carrier partners and uncovered a 2.86x surcharge overcharge on a single accessorial category. Before the reconciliation layer was in place, the finance team was manually spot-checking roughly 40% of invoices each month and catching discrepancies only after payment had already cleared. After we automated the parsing pipeline and surfaced discrepancies in a Power BI flagging dashboard, the team moved from reactive 40% spot-checks to proactive 100% pre-payment review across all carrier invoices. That single workflow change recovered enough in overbilling to cover the full retainer engagement cost within the first 90 days. Document parsing is available as an add-on to any retainer tier when carrier invoice complexity justifies it.
Logistics IT teams often want to add ITSM KPI dashboards in Power BI alongside operational metrics - incident resolution time, change success rates, and system uptime by warehouse location. If that is in scope, we design the data model to accommodate both operational and IT metrics from the start, so fleet managers, ops leadership, and IT share a single governed workspace.
What KPIs Should a Logistics Power BI Dashboard Track?
Start with metrics that drive decisions, not the ones easiest to export from your TMS.
Operations layer:
- On-time pickup and delivery rate by carrier, lane, and shipper. This metric determines which carrier relationships to expand or renegotiate - a carrier consistently running below 85% OTD on a core lane is a contractual risk before it becomes an operational crisis, and a dashboard surfaces that pattern weeks before a quarterly review.
- Detention and dwell time - where accessorial fees compound fastest. Detention time maps directly to accessorial fee exposure: each hour over the free-time window typically triggers $50-$75 in charges per truck, and surfacing average dwell by facility makes that cost visible before the invoice arrives so operations can intervene at the dock level.
- Empty miles and load factor by driver or truck. Low load factor by asset reveals where backhaul capacity is being left on the table - a direct input for lane bidding decisions and carrier negotiations that improves margin without adding volume.
- Shipment exceptions by type: damage, late, lost. Exception volume by carrier and lane feeds carrier scorecards and informs routing-guide decisions at quarterly carrier reviews, giving procurement objective data rather than anecdote.
Finance layer:
- Cost-per-mile and cost-per-shipment by carrier. Tracking these metrics against contracted rates in real time catches rate creep before it accumulates across thousands of shipments and becomes difficult to dispute - a comparison table in Power BI puts the contracted rate and actual rate side by side for every lane.
- Accessorial charges as a percentage of base freight. When this ratio trends upward, it signals process gaps - loading delays, address corrections, re-delivery attempts - that operations can fix before finance absorbs the compounded cost across a full billing cycle.
- Invoice-to-payment cycle time. Longer cycle times often indicate disputed invoices sitting unresolved; surfacing aging disputes in a dashboard turns an accounts-payable metric into an operational priority that a carrier manager can act on before late-payment penalties accrue.
- Carrier performance score vs. contracted rate. Linking service performance to rate data in a single view gives procurement the objective basis to renegotiate or rebid lanes at contract renewal, rather than relying on relationship history alone.
Fleet/asset layer (where applicable):
- Vehicle utilization rate and idle time. Idle time above a threshold is a direct fuel cost that telematics data can quantify by vehicle, driver, and route - enabling targeted coaching before idle costs aggregate at the fleet level and distort cost-per-mile benchmarks.
- Maintenance cost per unit. Tracking maintenance spend against utilization surfaces which assets are approaching a replace-vs.-repair inflection point, supporting capital expenditure planning before a breakdown forces an unbudgeted decision.
- Fuel efficiency by vehicle class. Variance across similar vehicles often surfaces driver behavior or mechanical issues before they appear in maintenance logs, giving fleet managers an earlier intervention window.
For fleet-heavy operations, Managed Power BI services can include direct pulls from telematics platforms (Samsara, Geotab, Verizon Connect) alongside TMS data - so fleet managers and ops leadership see the same numbers at the same time.
How Do We Connect TMS and Carrier Data to Power BI?
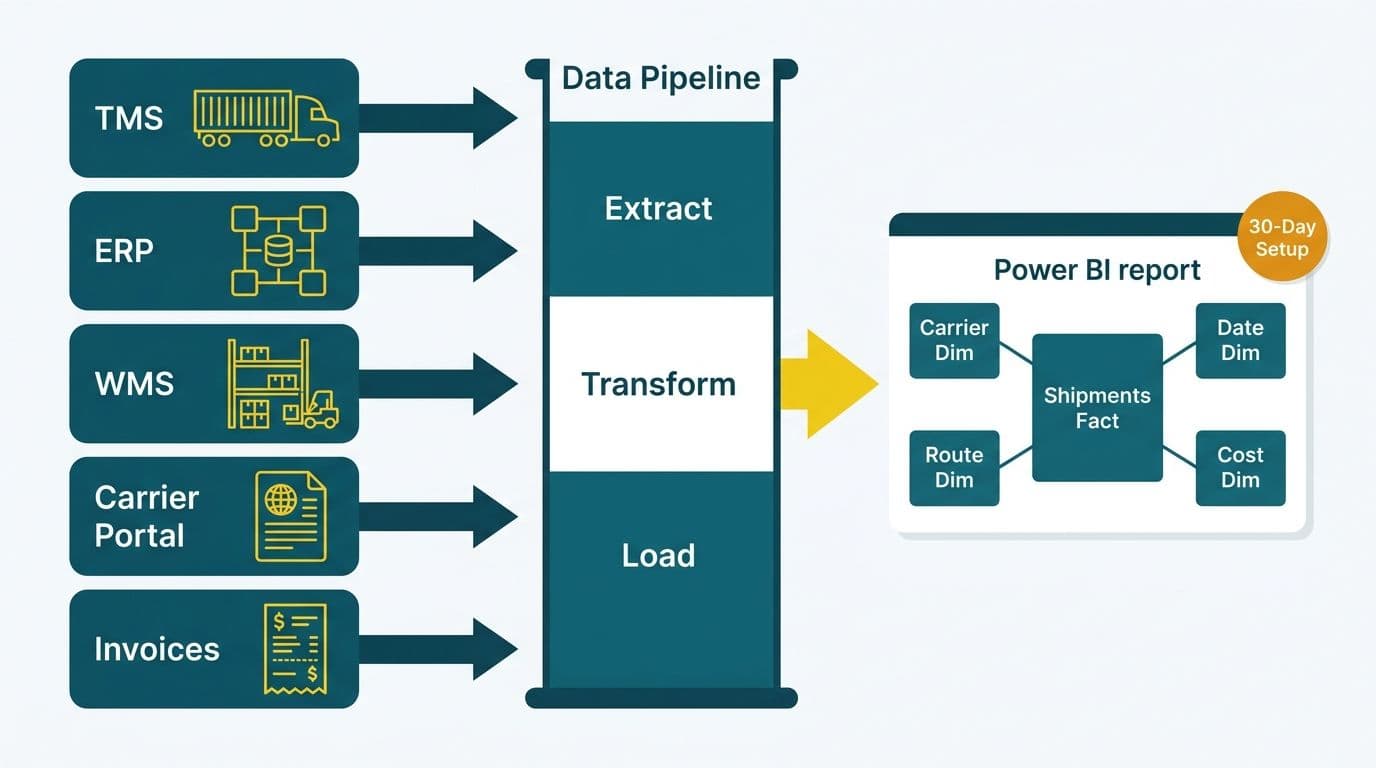
Most mid-market TMS platforms - McLeod, TMW, Aljex, MercuryGate - expose ODBC connections or support scheduled CSV/Excel exports. We build the pipeline that fits: direct connector, REST API pull, or a lightweight staging layer in Azure SQL if transformation logic is needed before the data hits the model.
Carrier invoice data is the harder problem. Each carrier formats invoices differently, and PDF-based invoices require a parsing layer before Power BI sees clean data. The 2025 freight-invoice reconciliation engagement described above is a representative example of how that parsing layer surfaces systematic overcharges at scale. Document parsing can be scoped as an add-on to any retainer tier when invoice complexity justifies the investment.
Is Power BI the Right Choice for Logistics, or Should We Consider a Free Web-Based Alternative?
For logistics companies already running Microsoft 365 (Azure, Teams, SharePoint, Dynamics), Power BI is the stronger fit. It handles complex DAX calculations for logistics KPIs, supports row-level security by business unit or region, and integrates natively with Azure Data Lake and Synapse Analytics.
Free web-based BI tools carry no per-user license fee at the standard tier, but they lack a semantic layer, handle row-level security poorly, and are not designed for the multi-source data models that logistics operations require. If your organization is on Microsoft 365 E3 or E5, Power BI Pro may already be included in your existing license - which changes the total cost comparison substantially. For a finance-team perspective on the same platform decision, see our guide on what to expect from a Power BI managed service for finance teams.
Data Governance for US, UK/EU, and Canadian Logistics Companies
Logistics companies operating across borders face different compliance requirements depending on where employee, driver, and customer data sits.
US operations: Finance-adjacent logistics - pharmaceutical distribution, hospital supply chains, medical device freight - should configure Power BI workspaces for SOC 2 alignment: US Azure data residency, row-level security by business unit, and audit logging enabled from day one.
UK and EU operations: GDPR applies to personal data processed in reports - driver records, customer delivery addresses, employee routing data. Power BI supports EU data residency within Azure, keeping EU personal data within EU boundaries per Microsoft's EU Data Boundary commitments.
Canadian operations: PIPEDA governs how personal information is collected and used in reporting. For logistics companies with Canadian fleet or customer data, we structure datasets to minimize retention of personal identifiers in the BI layer - a step many teams skip until an audit flags it.
Common Objections, Addressed Honestly
Lock-in concerns
You own your .pbix files from day one. If you end the engagement, you walk away with the full model, datasets, and reports. The retainer pays for ongoing expertise and iteration - not custody of your data. Month-to-month arrangements are available on all tiers.
Quality concerns after a prior bad engagement
Every engagement is led by a senior Power BI developer - not handed off to a junior resource. We follow the Power BI governance checklist from week one: star schema models, clean measure tables, documented datasets, and row-level security from the start. For an independent view of what to look for when choosing a provider, see how to evaluate a Power BI managed service provider.
The in-house hire alternative
You can hire internally, and for some operations it makes sense. The fully loaded cost of a mid-level Power BI developer in the US is roughly $8,300/month (Glassdoor, 2025). That gets you one person - with PTO, a ramp-up period, and a gap risk if they leave. A Growth retainer at $3,950/month gives you a senior-led team with no recruiting lag and no single point of failure.
---
If your logistics operation is still running on Excel exports and TMS screenshots, the fastest next step is a 30-minute discovery call. We will map your current data sources, identify the highest-value KPIs to start with, and give you a clear engagement recommendation with no commitment required. Visit our Managed Power BI services page to see what is included and book a call.
---
About Lets Viz: Written by [Author Name], Senior Power BI Consultant at Lets Viz, who has built TMS-to-dashboard pipelines for 3PLs, freight brokerages, and distribution companies across the US and UK since 2020. Lets Viz carries a 5.0 rating on Clutch and has delivered data analytics and BI solutions to clients in healthcare, SaaS, finance, and logistics across the US, UK, and Canada. We specialize in Power BI, Zoho, and AI automation for mid-market companies that need senior-level expertise without the overhead of a full-time hire.