Patient Satisfaction Analytics Dashboard: Hospital Survey Guide
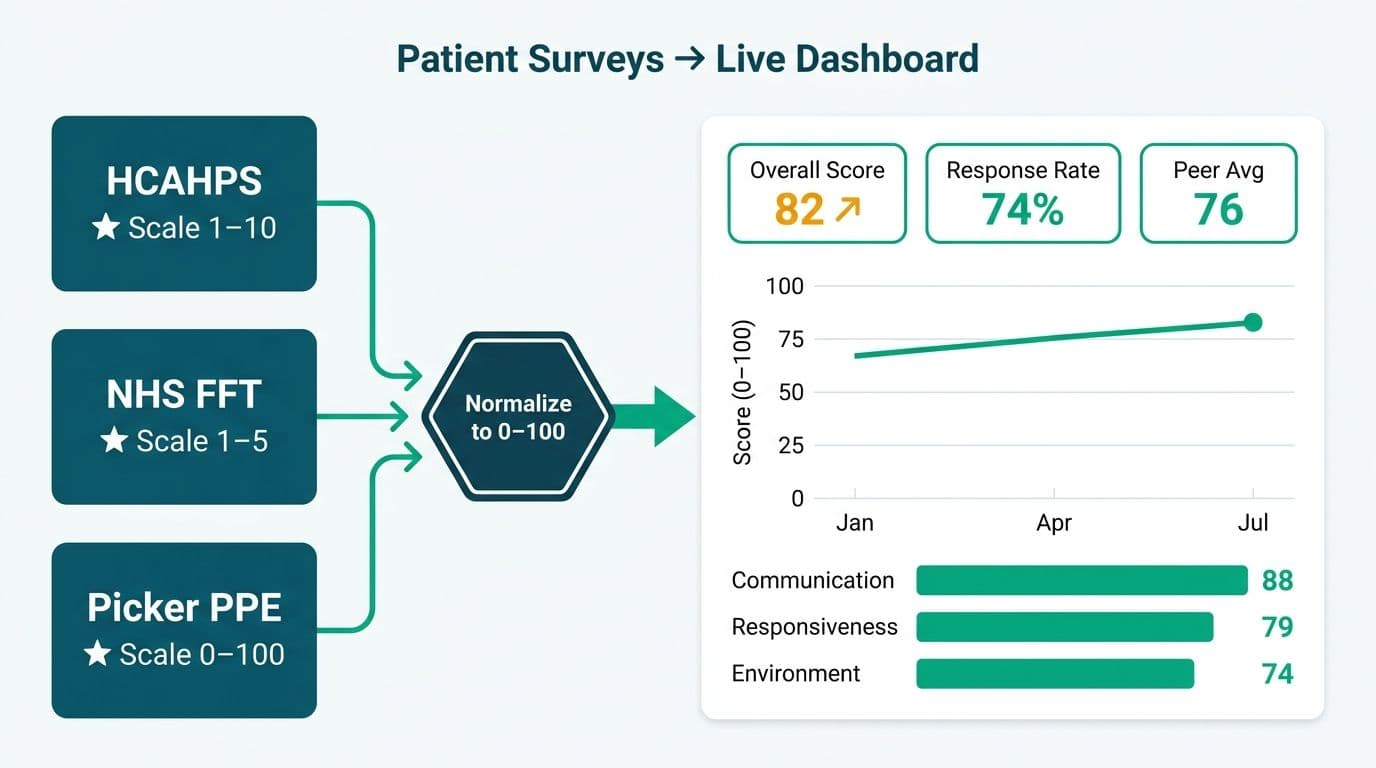
A patient satisfaction analytics dashboard for a hospital aggregates survey responses from instruments such as HCAHPS (US), the NHS Friends and Family Test (UK), and the Picker Patient Experience Questionnaire (Canada and UK) into a single, live reporting layer. Connected to Power BI or Looker Studio, the dashboard turns raw survey exports into trend lines, composite domain scores, and peer benchmarks that administrators can act on within days rather than months.
Key Takeaways
- HCAHPS, NHS FFT, and Picker use different scales and question sets; normalizing to a 0-100 index before loading is the safest cross-market comparison strategy.
- Automating score ingestion via flat-file drop zones or REST connectors eliminates the manual re-keying that introduces transcription errors in monthly reports.
- Power BI and Looker Studio both support patient satisfaction dashboards - each has distinct refresh, governance, and cost trade-offs covered below.
- HIPAA (US), GDPR (UK/EU), and PIPEDA (Canada) all treat survey response files as protected data; de-identification must happen before data leaves the vendor.
- A structured healthcare analytics implementation roadmap cuts dashboard go-live time by aligning survey vendor exports, EHR feeds, and BI licensing before build starts.
What Is a Patient Satisfaction Analytics Dashboard for Hospitals?
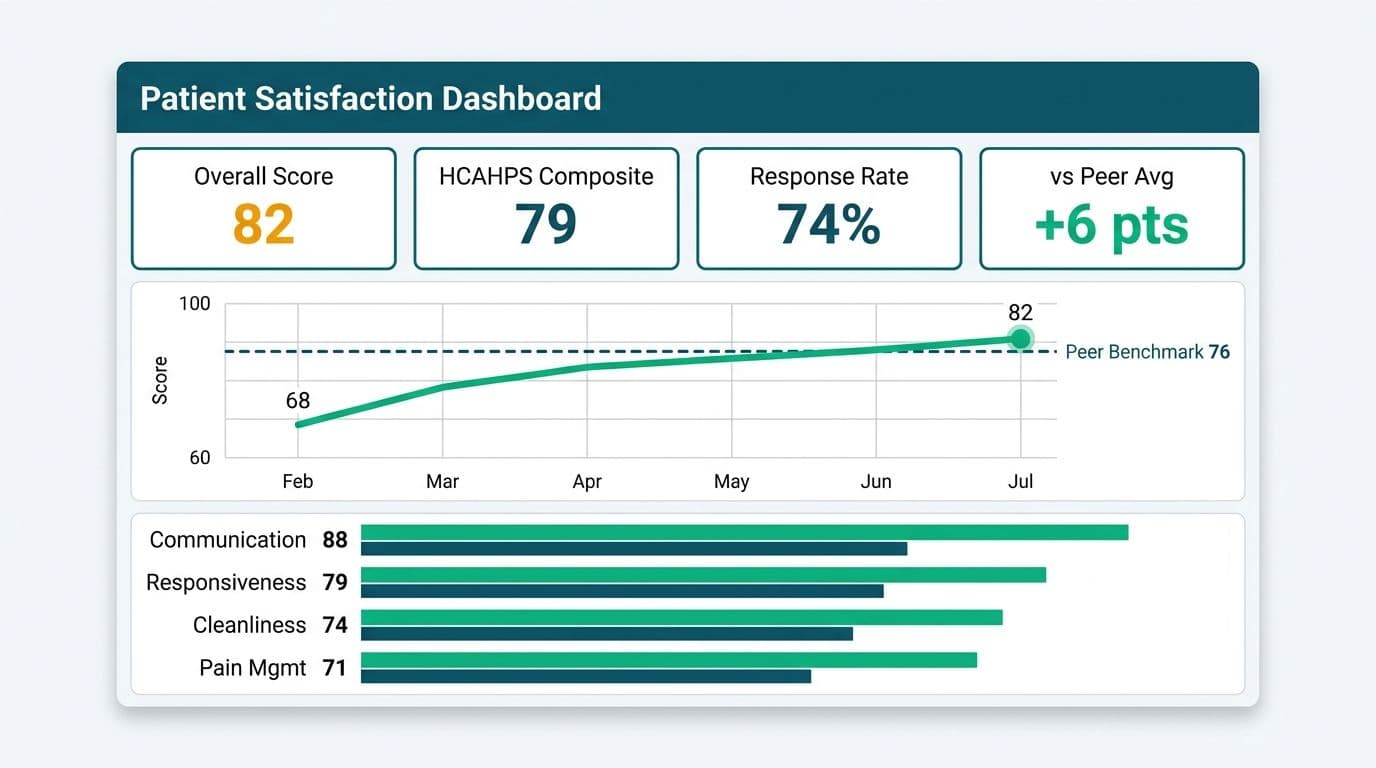
A patient satisfaction analytics dashboard centralizes survey scores, response rates, and verbatim comments from one or more measurement instruments so clinical leaders and administrators can monitor experience quality in near real time. Unlike static monthly PDF reports from survey vendors, a live dashboard in Power BI or Looker Studio supports filtering by service line, unit, physician, date range, and payer - the dimensions that matter for operational decisions.
For healthcare teams already managing clinical and financial data in a unified BI environment, Managed Power BI for healthcare teams provides the governed architecture needed to layer patient satisfaction data alongside readmission rates and revenue cycle metrics in a single executive scorecard.
The dashboard typically tracks:
- Composite domain scores (communication, responsiveness, environment, discharge)
- Top-box and bottom-box rates (percentage selecting the highest or lowest available rating)
- Response rate by unit and month
- Verbatim sentiment categories (positive, neutral, negative, escalation flag)
- Peer or national benchmark delta
How Do HCAHPS, NHS FFT, and Picker Surveys Compare?
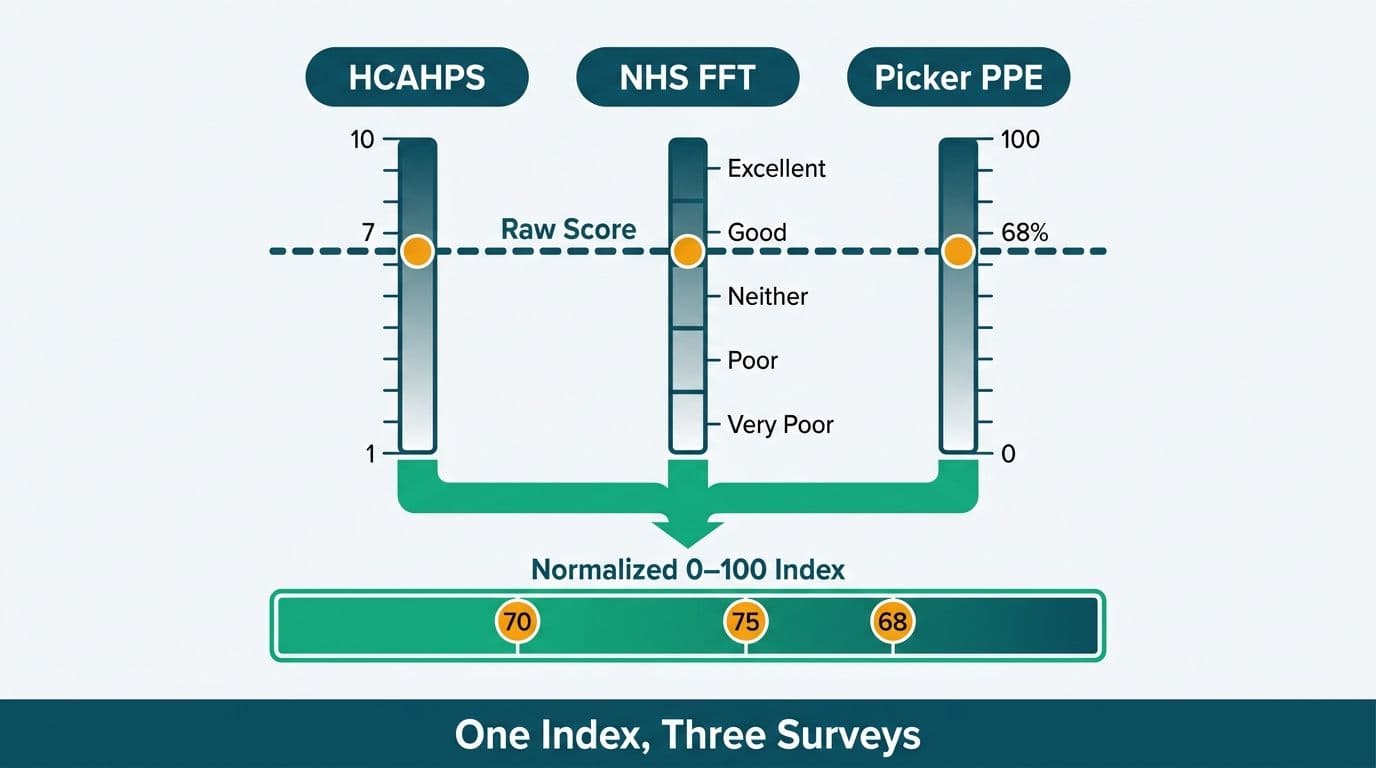
These three instruments share a common purpose - measuring patient experience - but differ in scale design, mandatory status, and domain coverage. Understanding those differences is essential before designing a schema that holds all three in a single fact table.
| Dimension | HCAHPS (US) | NHS FFT (UK) | Picker Survey (UK/Canada) |
|---|---|---|---|
| Full name | Hospital Consumer Assessment of Healthcare Providers and Systems | Friends and Family Test | Picker Patient Experience Questionnaire |
| Scale | 4-point Likert (Never to Always) | 6-point Likert (Extremely likely to Would not recommend) | Binary Yes/No per item |
| Composite domains | 7 (communication, responsiveness, pain, medication, discharge, environment, overall) | 1 (likelihood to recommend) plus free text | 8 (information, coordination, physical comfort, emotional support, family involvement, continuity, overall) |
| Mandatory status | Mandatory for CMS-reimbursed US acute care (CMS, 2024) | Mandatory for NHS England trusts (NHS England, 2024) | Voluntary; adopted in NHS Scotland, NHS Wales, and Canadian provincial health authorities |
| Reporting cadence | Monthly CMS submission; public Hospital Compare data | Monthly publication required | Varies; often quarterly |
| Benchmark source | National and peer-group via CMS HCAHPSonline.org (2024) | NHS England published trust-level data | Picker Institute Europe comparative data for member organizations |
| De-identification floor | Minimum 100 responses per rolling period (CMS, 2024) | Suppress cells under 10 (NHS England, 2024) | Suppress cells under 5 |
Normalizing Scores Across Instruments
Because HCAHPS uses a 4-point scale, NHS FFT uses a 6-point scale, and Picker uses binary items, direct comparison is misleading without transformation. The standard approach is to convert each instrument to a 0-100 index:
- HCAHPS: top-box rate (percentage selecting "Always" or "Usually") multiplied by 100, weighted by CMS case-mix adjustment where applicable.
- NHS FFT: percentage selecting "Extremely likely" or "Likely" (the two positive categories) out of all valid responses, multiplied by 100.
- Picker: percentage of positive responses per domain, aggregated to a domain score out of 100.
Loading these normalized scores into a single fact table with a `survey_instrument` dimension column is the cleanest schema for multi-market dashboards in either Power BI or Looker Studio.
How Do You Automate Score Ingestion for a Patient Satisfaction Dashboard?
Manual CSV downloads from survey vendor portals are the single biggest reliability risk in patient satisfaction reporting. A missed export or a column rename in the vendor UI means the dashboard shows stale data exactly when leadership needs current numbers.
The preferred automation path depends on what your vendor exposes:
REST API (most modern vendors): Poll the vendor API nightly, write responses to an Azure Blob Storage or Google Cloud Storage staging zone, then load via Power BI dataflow or Looker Studio's BigQuery connector. Store authentication tokens in Azure Key Vault - never embed API keys in the Power BI dataset connection string or a Looker Studio data source credentials field.
SFTP file drop: The vendor deposits a UTF-8 CSV or JSON file each night. An Azure Data Factory or Cloud Composer pipeline picks it up, validates the schema against a reference template, and appends to a staging table. This pattern works reliably when the vendor cannot support direct API calls.
Vendor-managed cloud data share: A small number of enterprise survey platforms support direct BigQuery or Snowflake sharing. If available, this is the lowest-maintenance path - your BI tool connects to the share with read-only credentials and the vendor handles the extract and refresh cycle.
For US hospitals, any file containing combinations of identifiers - such as unit plus admission date - that could re-identify individuals must be encrypted in transit and at rest under the HIPAA Security Rule. De-identification under the Safe Harbor or Expert Determination method should occur at the vendor before export files leave their environment. For UK NHS trusts, GDPR Article 9 classifies health data as special category and requires explicit data processing agreements with survey vendors. Canadian provincial health organizations under PIPEDA face equivalent obligations for personal health information. All three regimes reach the same practical conclusion: strip identifiers before data crosses organizational boundaries.
The same HL7 FHIR API patterns used for clinical data ingestion apply here - FHIR QuestionnaireResponse resources can carry patient-reported outcome data alongside clinical observations in a single pipeline. The guide to connecting EHR data to Power BI with Epic, Cerner, and FHIR covers the authentication and schema-mapping steps that transfer directly to survey ingestion pipelines.
How to Build a Patient Satisfaction Dashboard in Power BI
A well-structured patient satisfaction analytics dashboard in Power BI follows a three-layer model: a staging layer (raw vendor exports), a conformed layer (normalized 0-100 scores, date spine, unit hierarchy), and a semantic model (measures, roles, row-level security).
Data Model
The core fact table holds one row per survey response with these columns at minimum:
```
survey_id (PK), survey_instrument, facility_id, unit_id,
service_line, physician_id (nullable), response_date,
domain, normalized_score (0-100), top_box_flag, benchmark_score
```
Dimension tables: `dim_date`, `dim_unit`, `dim_physician`, `dim_instrument`.
Key DAX Measures
```
Top Box Rate =
DIVIDE(
COUNTROWS(FILTER('fact_survey', 'fact_survey'[top_box_flag] = 1)),
COUNTROWS('fact_survey')
)
Score vs Benchmark =
[Avg Normalized Score] - AVERAGE('fact_survey'[benchmark_score])
Rolling 12M Score =
CALCULATE(
[Avg Normalized Score],
DATESINPERIOD('dim_date'[Date], LASTDATE('dim_date'[Date]), -12, MONTH)
)
```
Row-Level Security for HIPAA Compliance
Apply Power BI row-level security so unit managers see only their unit's data, department heads see their service line, and executives see the full health system. Combine RLS with workspace-level access controls and audit logging in the Power BI admin portal. For US healthcare, document these controls as part of your HIPAA Technical Safeguard inventory.
A nightly scheduled refresh via Power BI Premium or Power BI Pro is sufficient for most patient satisfaction use cases and substantially cheaper than DirectQuery. For organizations evaluating whether Power BI or a purpose-built clinical analytics platform is the right fit, the Power BI vs. healthcare analytics software decision framework covers the build-versus-buy trade-offs in detail.
How to Build a Patient Satisfaction Dashboard in Looker Studio
Looker Studio is a practical alternative for smaller Canadian provincial health networks or UK NHS trusts already using Google Workspace and BigQuery, because the native BigQuery connector eliminates a separate BI licensing cost.
Connector Setup
1. Create a BigQuery dataset in your GCP project: `patient_experience.fact_survey`.
2. In Looker Studio, add a BigQuery data source pointing to that dataset.
3. Set credentials to a dedicated service account with `bigquery.dataViewer` permission on the dataset only - never use owner credentials in a shared report.
4. Set data freshness to 12 hours rather than the default "always fresh" setting, which issues a BigQuery query on every page load and generates unexpected costs at scale.
The Looker Studio data blending feature lets you join the survey fact table to a benchmark reference table or a unit hierarchy maintained in a Google Sheet, but blending has documented row limits and join restrictions. For patient satisfaction datasets with hundreds of thousands of responses, a pre-joined BigQuery view is more reliable than a runtime blend. The Looker Studio data blending limitations guide covers these constraints in detail.
Access Controls for GDPR and PIPEDA
Looker Studio does not natively enforce row-level security the way Power BI does. For UK NHS or Canadian health authority deployments where administrators must see only their organization's data, create separate data sources per organization that point to BigQuery views filtered by `facility_id`, and share each Looker Studio report only with the relevant Google Workspace group. Document this as your access control measure in GDPR Article 32 records or PIPEDA Schedule 1 compliance documentation.
What Does a Healthcare Analytics Implementation Roadmap Look Like for Patient Satisfaction?
A healthcare analytics implementation roadmap for patient satisfaction typically runs six to ten weeks for a single-instrument deployment and twelve to sixteen weeks when integrating multiple survey instruments across a health system.
Phase 1 - Discovery (weeks 1-2): Identify survey vendor API or file export capability, confirm de-identification SLA with vendor, map unit hierarchy to EHR facility codes, and confirm BI tool licensing. US teams: include a HIPAA Security Rule gap analysis. UK teams: confirm the data processing agreement with the vendor covers GDPR Article 9. Canadian teams: verify the PIPEDA consent chain for secondary use of survey data.
Phase 2 - Data Pipeline (weeks 3-5): Build staging ingestion (SFTP or API), implement schema validation, load to a cloud data warehouse, and establish nightly orchestration. Configure pipeline-failure alerts so the dashboard never silently serves stale data to unit managers or executives.
Phase 3 - Semantic Model (weeks 5-7): Build the conformed fact table, apply normalized score transformations for each instrument, define DAX or BigQuery SQL measures, and implement row-level security or view-level access controls appropriate to the BI tool.
Phase 4 - Dashboard Build (weeks 7-9): Build domain trend pages, unit comparison views, benchmark delta visualizations, and an executive summary page. Include a data-freshness timestamp on every page so clinical staff know when the numbers were last updated.
Phase 5 - Training and Handoff (weeks 9-10+): Train unit managers and administrators on the data dictionary - particularly how each instrument's normalized score was calculated - so staff trust the numbers they see. Undocumented score transformations are the leading cause of dashboard abandonment in clinical settings.
Complementary operational metrics that typically accompany patient satisfaction reporting - readmission rates, length of stay, and revenue cycle KPIs - are covered in the revenue cycle management dashboard metrics guide, which details the KPI definitions most US hospital finance teams use in CMS reporting.
---
About Lets Viz: Lets Viz has delivered analytics and dashboard solutions since 2020 across US healthcare, UK fintech, Canadian manufacturing, and global SaaS organizations, earning a 5.0 rating on Clutch. Our certified Power BI and Looker Studio engineers build within HIPAA, GDPR, and PIPEDA compliance frameworks, designing dashboards that clinical and finance teams trust enough to replace their monthly vendor PDF reports.
When your hospital or health system is ready to move patient satisfaction reporting from static vendor exports to a governed, real-time dashboard, Managed Power BI for healthcare teams outlines how we approach survey ingestion, score normalization, and visualization end to end.