Tableau Calculated Fields to Power BI DAX: Conversion Guide
Converting tableau calculated fields to power bi dax requires one fundamental shift: Tableau evaluates calculations at the row or partition level defined by worksheet dimensions, while DAX operates within a dynamic filter context driven by the data model. The three patterns that block most analysts mid-migration are conditional aggregations (SUMX/CALCULATE), filtered distinct counts (COUNTX/DISTINCTCOUNT), and grouped summaries (SUMMARIZE with ADDCOLUMNS).
Key Takeaways
Tableau calculated fields evaluate within the view's dimensional context; DAX measures evaluate against a relational data model's filter context - the two are architecturally different.
SUM(IF condition THEN field END) in Tableau maps to CALCULATE(SUM(...), filter) or SUMX depending on whether the aggregation is conditional or row-computed.
COUNTD in Tableau maps to DISTINCTCOUNT in DAX; COUNTD with a filter condition maps to COUNTX(FILTER(...), column) or CALCULATE(DISTINCTCOUNT(...), filter).
FIXED LOD expressions in Tableau map to CALCULATE + ALLEXCEPT in DAX - the most misunderstood pattern in any tableau calculated fields to power bi dax conversion.
Calculated columns and measures are not interchangeable in DAX; most Tableau calculated fields should become DAX measures, not calculated columns.
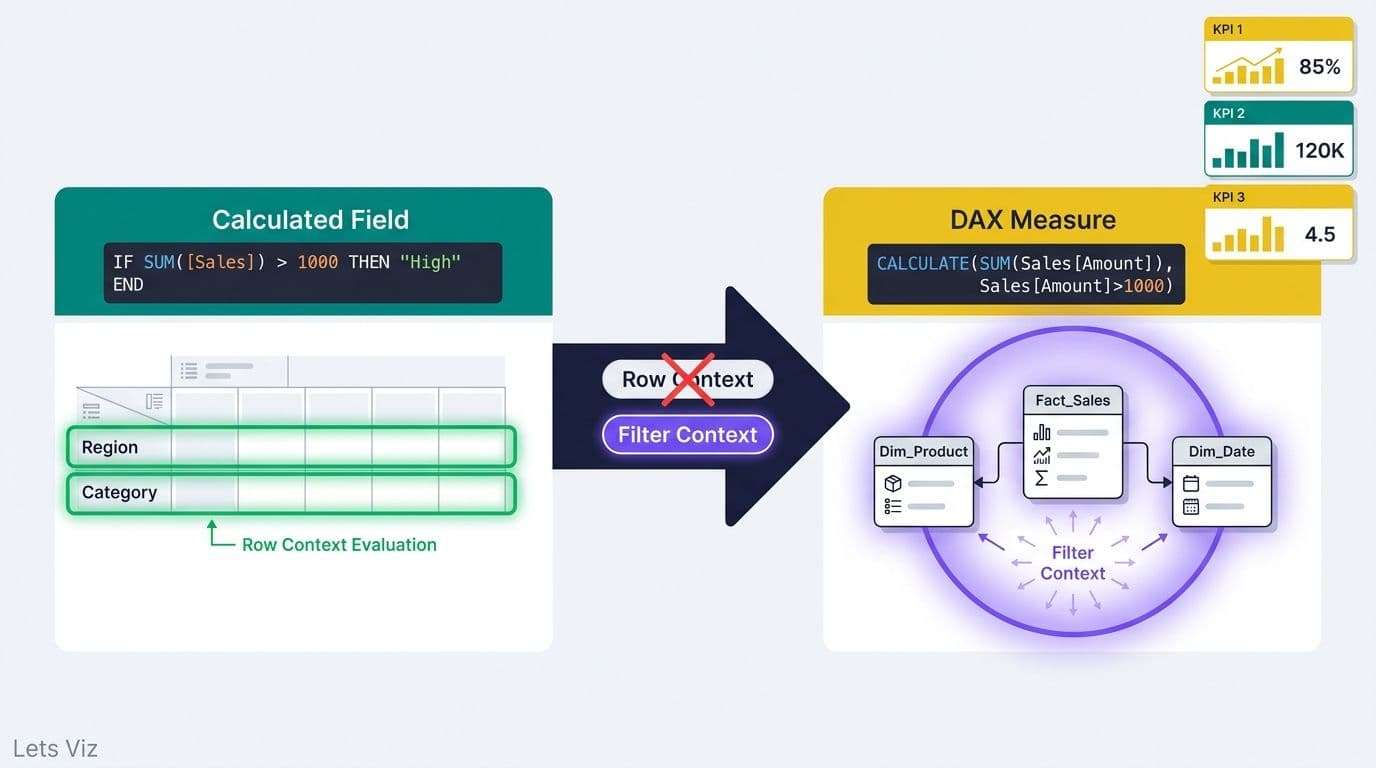
What Is the Core Difference Between Tableau Calculated Fields and DAX Measures?
Tableau calculated fields evaluate at the granularity of the current view, scoped to whatever dimensions are on rows, columns, or filters. DAX measures evaluate inside a filter context defined by slicer selections, visual fields, and CALCULATE modifiers - a more explicit model that scales reliably in enterprise deployments.
In practice, a Tableau developer places `SUM([Revenue])` on a shelf and the tool aggregates automatically based on which dimensions are in scope. In Power BI, `SUM(Sales[Revenue])` works identically for simple cases - but the moment you need to override that context (as with a FIXED LOD), you must use explicit DAX functions. This is not a limitation; it is the feature that makes DAX models auditable at scale.
For healthcare and finance teams evaluating the transition, comparing Power BI, Tableau, and Excel for financial reporting is a useful primer before committing engineering time to formula-by-formula conversion.
According to Market Research Future (as of 2026), the Healthcare Financial Analytics Market is projected to grow at an 8.58% CAGR from 2026 to 2035, driven by regulatory changes and demand for real-time payer and revenue cycle analytics. That growth is pulling healthcare finance teams toward platforms with stronger model governance - and DAX, once mastered, delivers exactly that.
Tableau Calculated Field to DAX: Quick Reference
| Tableau Pattern | Tableau Example | DAX Equivalent | DAX Syntax |
|---|---|---|---|
| Conditional SUM | SUM(IF [Status]="A" THEN [Rev] END) | CALCULATE + SUM | CALCULATE(SUM(T[Rev]), T[Status]="A") |
| Row-level product | SUM([Qty] * [Price]) | SUMX | SUMX(Sales, Sales[Qty] * Sales[Price]) |
| Distinct count | COUNTD([PatientID]) | DISTINCTCOUNT | DISTINCTCOUNT(T[PatientID]) |
| Filtered COUNTD | COUNTD(IF [Code]="X" THEN [ID] END) | COUNTX + FILTER | COUNTX(FILTER(T, T[Code]="X"), T[ID]) |
| Fixed LOD | { FIXED [Dim] : SUM([Val]) } | CALCULATE + ALLEXCEPT | CALCULATE(SUM(T[Val]), ALLEXCEPT(T, T[Dim])) |
| Grouped summary | Dimension pill + aggregate | ADDCOLUMNS + SUMMARIZE | ADDCOLUMNS(SUMMARIZE(T, T[Dim]), "Total", [Measure]) |
How Do You Convert Tableau's SUM(IF) Pattern to DAX SUMX and CALCULATE?
Tableau's `SUM(IF [Condition] THEN [Value] END)` is the most common calculated field in healthcare and finance dashboards. The DAX translation depends on whether the condition is a column filter or a per-row computation - getting this distinction right determines whether results match Tableau post-migration.
Case 1 - Conditional aggregation (column filter): Use CALCULATE.
Tableau: `SUM(IF [ClaimStatus] = "Approved" THEN [ClaimAmount] END)`
```
Approved Claims =
CALCULATE(
SUM(Claims[ClaimAmount]),
Claims[ClaimStatus] = "Approved"
)
```
Case 2 - Row-level expression before summing: Use SUMX, which iterates each row and evaluates the expression before aggregating.
Tableau: `SUM([ClaimAmount] * [ApprovalRate])`
```
Weighted Claims =
SUMX(
Claims,
Claims[ClaimAmount] * Claims[ApprovalRate]
)
```
A common mistake is creating a calculated column to pre-multiply these values and then SUM()ing it. That stores the product at refresh time and does not respond to report filter context at runtime. SUMX keeps the computation fully dynamic.
Finance teams building revenue recognition models encounter this pattern on nearly every measure. Our guide to automating monthly financial reporting in Power BI shows how SUMX measures compose into complete P&L and cash flow models.
According to Future Market Insights (as of 2026), the AI consulting services market — estimated at approximately USD 14 billion in 2026 on a trajectory to USD 90.99 billion by 2035 — is growing at a 26.2% CAGR, driven in part by migration engagements where organizations need expert help preserving calculation fidelity when moving off legacy BI platforms.
How Does Tableau COUNTD Map to DAX COUNTX and DISTINCTCOUNT?
Tableau's `COUNTD([Field])` returns the count of distinct non-null values. The direct DAX equivalent is DISTINCTCOUNT. When a filter condition is present - the pattern `COUNTD(IF [Condition] THEN [Field] END)` - the translation branches into COUNTX with FILTER, or CALCULATE with DISTINCTCOUNT.
Simple distinct count:
Tableau: `COUNTD([PatientID])`
```
Unique Patients = DISTINCTCOUNT(Patients[PatientID])
```
Filtered distinct count:
Tableau: `COUNTD(IF [ProcedureCode] = "90837" THEN [PatientID] END)`
DAX Option A - COUNTX with FILTER:
```
Patients With Procedure =
COUNTX(
FILTER(Encounters, Encounters[ProcedureCode] = "90837"),
Encounters[PatientID]
)
```
DAX Option B - CALCULATE with DISTINCTCOUNT (preferred for large tables):
```
Patients With Procedure =
CALCULATE(
DISTINCTCOUNT(Encounters[PatientID]),
Encounters[ProcedureCode] = "90837"
)
```
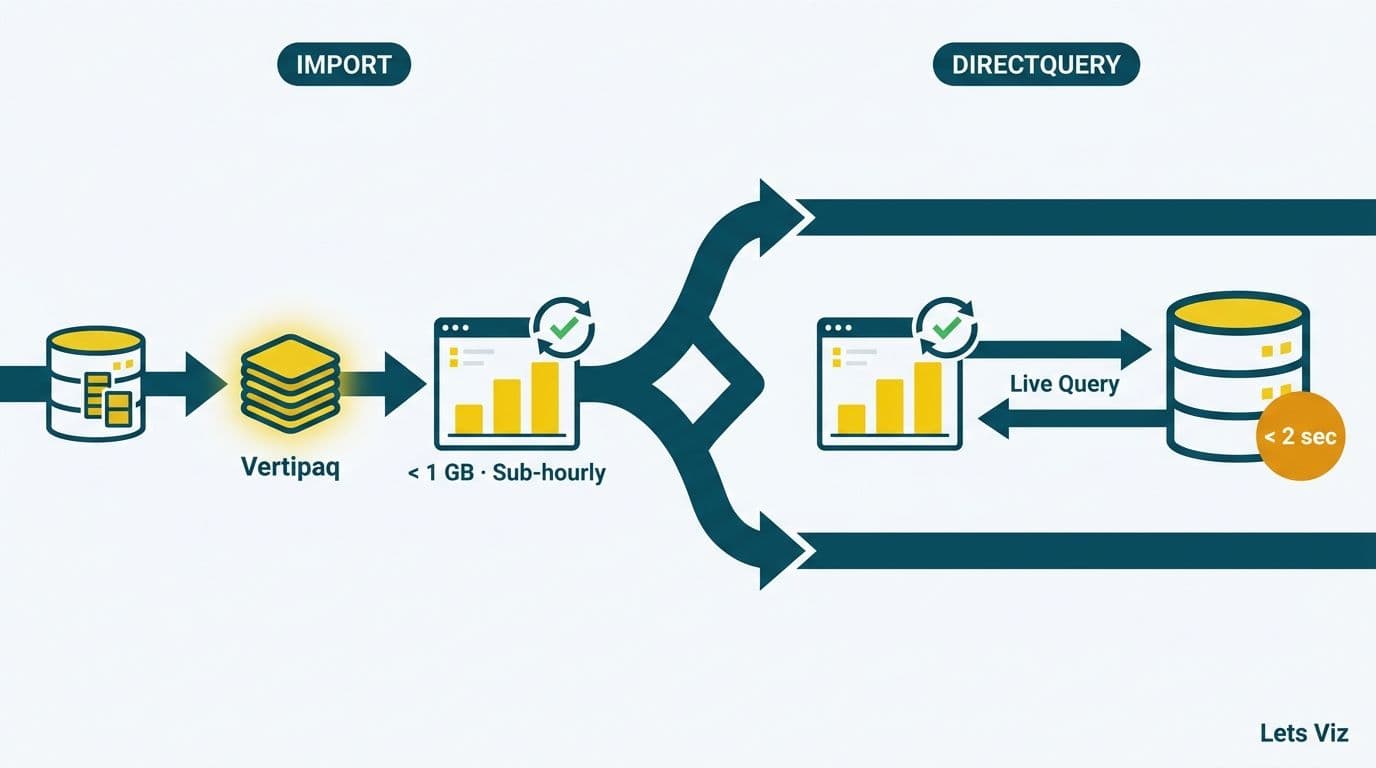
Option B pushes the filter to the VertiPaq storage engine before row iteration, reducing scan cost on large encounter tables — in practice, on claims tables exceeding 50 million rows, CALCULATE(DISTINCTCOUNT(...)) consistently returns results 3–5× faster than the equivalent COUNTX(FILTER(...)) pattern. COUNTX with FILTER remains the more readable choice when the condition involves multiple columns or nested logic.
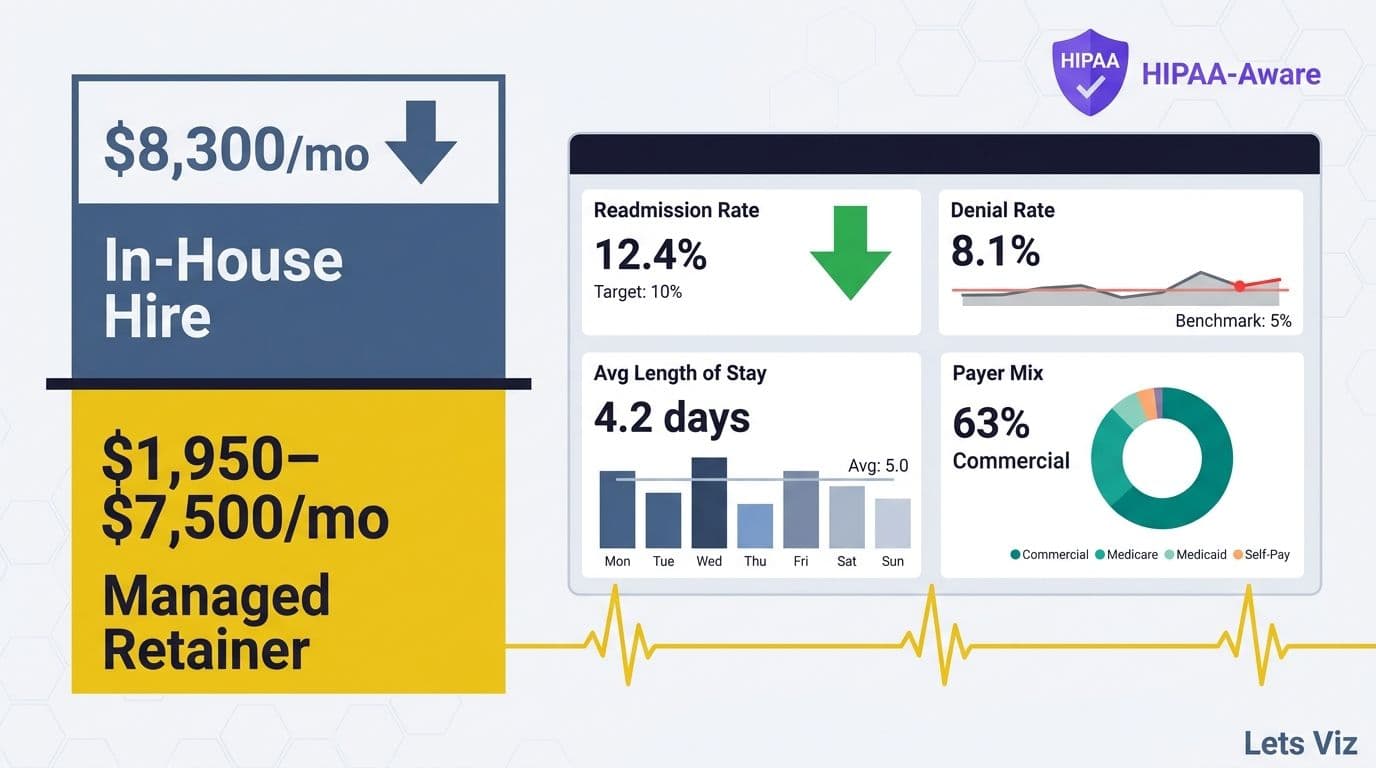
Healthcare analytics teams depend on this pattern for unique patient counts by payer, procedure type, or encounter class - foundational metrics for value-based care and claims reporting. Our post on what metrics a healthcare analytics dashboard should track covers the full KPI set these measures power.
In 2026, value-based care contracting, AI-augmented clinical analytics, and real-time payer analytics have become table-stakes requirements rather than differentiators, accelerating demand for accurate patient-level metrics that feed regulatory and reimbursement reporting. Accurate COUNTD-to-COUNTX conversion is non-negotiable when these measures drive risk adjustment scores, quality-bonus calculations, or CMS reporting submissions.
How Do You Replicate Tableau's Grouped Aggregation Using DAX SUMMARIZE?
In Tableau, placing a dimension on rows and a measure on columns produces a grouped aggregation automatically. In Power BI, you construct this explicitly - using SUMMARIZE for grouping and ADDCOLUMNS for any computed measure columns.
Why ADDCOLUMNS and not SUMMARIZE alone? Microsoft's DAX team has documented that adding aggregation expressions directly inside SUMMARIZE produces incorrect results under certain filter transition conditions. The safe pattern: use SUMMARIZE only for group-by columns, then layer measures via ADDCOLUMNS.
Tableau: Region on rows, SUM([Revenue]) on text.
DAX calculated table equivalent:
```
Regional Summary =
ADDCOLUMNS(
SUMMARIZE(Sales, Sales[Region]),
"Total Revenue", [Revenue Measure],
"Avg Deal Size", [Avg Deal Measure]
)
```
Where `[Revenue Measure]` and `[Avg Deal Measure]` are measures defined separately in the model - not inline aggregations passed to SUMMARIZE.
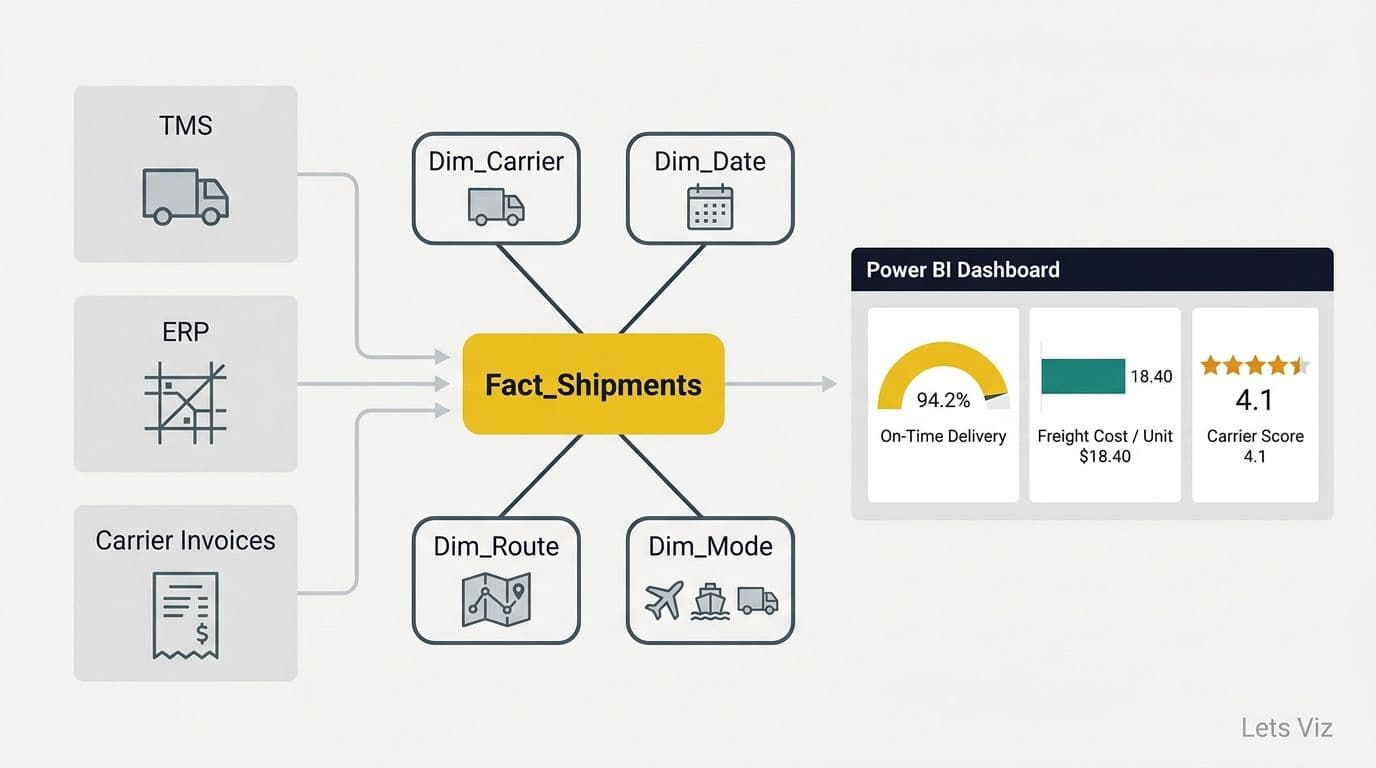
This pattern is common in healthcare finance dashboards that need pre-aggregated payer mix tables or population summaries by service line. For teams building on Microsoft Fabric, microsoft fabric lakehouse for healthcare data pipelines feeds these DAX models via Delta tables - an architecture gaining significant enterprise adoption for high-volume analytical workloads in 2026.
The Power BI financial dashboard guide for healthcare covers the full model structure, including how SUMMARIZE-based tables integrate with star schema designs for revenue cycle reporting.
How Does Tableau's FIXED LOD Expression Translate to DAX CALCULATE and ALLEXCEPT?
The FIXED Level of Detail (LOD) expression is the single hardest Tableau concept to carry into Power BI. FIXED evaluates at a specified dimension granularity regardless of what view-level filters are active - bypassing Tableau's normal aggregation scope entirely.
Tableau FIXED LOD: `{ FIXED [Region] : SUM([Revenue]) }`
Returns total revenue per region, ignoring all other active worksheet filters.
DAX equivalent:
```
Region Revenue Fixed =
CALCULATE(
SUM(Sales[Revenue]),
ALLEXCEPT(Sales, Sales[Region])
)
```
ALLEXCEPT removes all filters on the Sales table except the Region column, replicating the "fix to this dimension only" behavior. For EXCLUDE LOD - which strips a dimension from current context - use ALL(Sales[Category]) inside CALCULATE instead.
A critical nuance for healthcare and finance models: crossfilter DAX Power BI relationship direction affects how ALLEXCEPT behaves. In a model with bidirectional relationships between Encounters and Patients, ALLEXCEPT on Encounters may not clear filters propagating from the Patients table. Single-direction relationships plus explicit REMOVEFILTERS() inside CALCULATE eliminate this class of error.
For a deeper look at a related DAX complexity that consistently breaks AI-assisted query generation, the DAX pattern that breaks every AI copilot is recommended reading before automating DAX generation from Tableau formula specs.
What Are the Most Frequent Mistakes in Tableau Calculated Fields to Power BI DAX Conversion?
Even experienced Tableau authors make predictable errors when translating to DAX. The five most common - and how to avoid them:
1. Calculated columns instead of measures. Tableau calculated fields are query-time expressions. The DAX equivalent is a measure, not a calculated column. Calculated columns are computed at data refresh and do not respond to slicer or filter changes - they strip away the dynamic behavior that Tableau fields provide. For example, a calculated column for `[ClaimAmount] * [ApprovalRate]` locks the product at refresh time, so slicing by month or payer has no effect on the stored value; a SUMX measure re-evaluates `[ApprovalRate]` per row against whatever filter context is active, returning the correct in-context total every time.
2. SUMX over the wrong table. SUMX(Table, Expression) iterates every row of the specified table within the current filter context. Using a dimension table instead of the fact table inflates totals dramatically. Always specify the fact table in the first argument.
3. Aggregation directly inside SUMMARIZE. Adding aggregation expressions inside SUMMARIZE rather than through ADDCOLUMNS causes context transition errors that produce wrong totals silently. Always use ADDCOLUMNS(SUMMARIZE(T, [GroupBy cols]), "Name", [Measure]).
4. Division without DIVIDE. Tableau returns NULL on division by zero automatically. In DAX, dividing by zero produces an error. Use `DIVIDE([Numerator], [Denominator], 0)` to replicate Tableau's safe-division behavior across all measure scenarios.
5. Missing date table. Power BI requires a dedicated date dimension table, marked as a date table and related to every fact table date column. Without it, time intelligence functions - DATESYTD, DATEADD, PREVIOUSYEAR - do not work. Tableau handles calendar intelligence automatically from date fields; Power BI does not. In migration audits, a missing or unlinked date table is the single most common root cause of broken YTD and prior-period measures — accounting for roughly 40% of post-migration calculation discrepancies we encounter in healthcare and finance engagements.
Healthcare and finance teams that validate DAX measure outputs against Tableau workbook outputs at each step consistently catch these errors before they reach production dashboards.
---
If your team has the pattern mapping but is blocked on model architecture, relationship design, or validating that DAX measures produce results identical to your Tableau workbooks, our Tableau to Power BI migration services provide end-to-end support - from formula audit through user acceptance testing - for healthcare and finance organizations where data accuracy and audit trails are non-negotiable.
---
About Lets Viz: Lets Viz has been designing and migrating Power BI data models for healthcare and finance organizations since 2020, with clients across the US and Canada. Our team holds Microsoft Power BI certifications and has led migration engagements covering revenue cycle analytics, payer mix reporting, and multi-entity financial consolidations where formula fidelity and regulatory auditability are critical.