SWITCH Function DAX Power BI Finance: FP&A Playbook
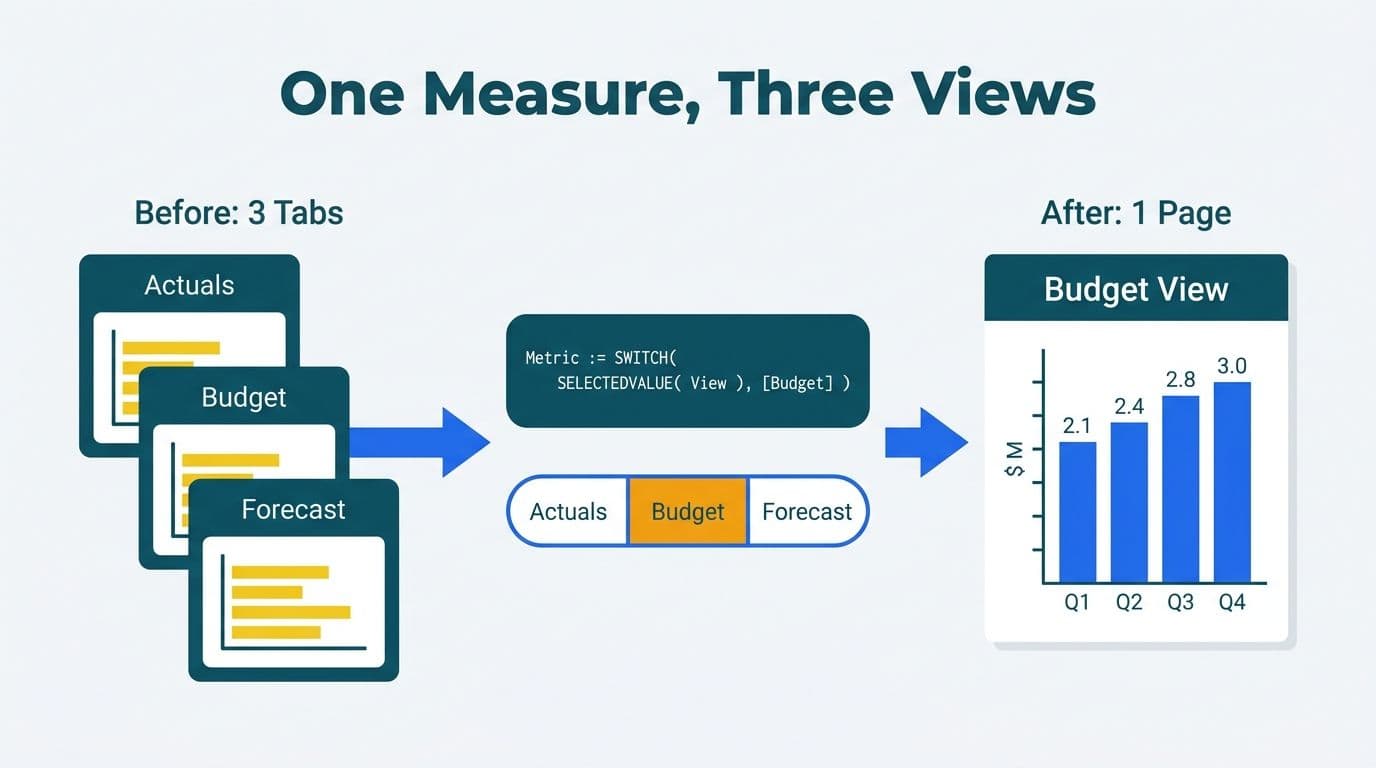
The SWITCH function in DAX lets Power BI finance teams replace three separate report pages with one dynamic measure that toggles between actuals, budget, and forecast based on a slicer selection. Instead of duplicating visuals across tabs, a single SWITCH measure evaluates a parameter table, returns the correct figure, and updates chart titles automatically - consolidating your entire variance model into one self-updating view.
Key Takeaways
A single SWITCH measure replaces three separate report tabs (actuals, budget, forecast), cutting maintenance time and keeping all visuals synchronized.
SWITCH evaluates a disconnected parameter table driven by a slicer and returns the matching DAX measure - no nested IF chains required.
Dynamic titles built from SWITCH update automatically when users change the scenario selection, eliminating mislabeled charts in board presentations.
SWITCH outperforms nested IF in readability, short-circuit evaluation, and scalability for multi-scenario finance KPI dashboards.
Finance teams in the US, UK, and Canada can apply this pattern inside one governed dataset, reducing compliance surface area for SOC 2, GDPR, and PIPEDA obligations.
What Is the SWITCH Function in DAX, and Why Do Finance Teams Use It?
SWITCH is a DAX function that evaluates a scalar expression and returns one of several possible results - functionally similar to a CASE statement in SQL, but far more readable than nested IF chains when you have three or more branches. For FP&A teams, those branches are almost always Actuals, Budget, and Forecast.
The syntax follows this pattern:
```
SWITCH(
<expression>,
<value1>, <result1>,
<value2>, <result2>,
...
<else result>
)
```
Microsoft's DAX reference documents SWITCH as returning results in sequence and stopping as soon as a match is found. This short-circuit behavior means each row in your model evaluates only the matching branch, not all three - an important efficiency advantage in large finance datasets with millions of transaction rows.
For SaaS finance reporting, the most common pattern pairs SWITCH with a disconnected parameter table - a small table containing your scenario labels and nothing else, with no relationships to fact tables. A slicer bound to that table drives the SWITCH logic across every measure on the page.
Power BI for SaaS finance teams applies this exact architecture for SaaS-specific KPIs including ARR, Net Revenue Retention, and Gross Margin, scaling the pattern across multi-entity and multi-currency reporting environments.
How Does the SWITCH Function in DAX Replace Three Finance Report Pages?
Without SWITCH, many finance teams build one Power BI page per scenario. Each page carries the same visuals pointing to different measures or data columns. When the underlying model changes, all three pages require independent updates - tripling maintenance time and introducing version drift, where the budget page references a calculation that the actuals page corrected two reporting cycles ago.
SWITCH collapses that architecture into a single page. Here is the core measure pattern:
```
Selected Revenue =
VAR ScenarioSelection = SELECTEDVALUE('Scenario'[Scenario], "Actuals")
RETURN
SWITCH(
ScenarioSelection,
"Actuals", [Total Actuals Revenue],
"Budget", [Total Budget Revenue],
"Forecast", [Total Forecast Revenue],
BLANK()
)
```
When a user selects "Budget" from the slicer, every card, chart, and table on the page recalculates using [Total Budget Revenue] automatically. No page navigation required. Visual layout, conditional formatting, and drill-through paths all remain identical - only the figures change.
A US SaaS finance team running board-deck reviews can share a single report URL, let executives toggle between scenarios live, and avoid the version confusion that plagues static Excel files. A UK fintech firm subject to GDPR can keep all scenario data inside one governed Power BI dataset rather than maintaining three separate paginated exports, reducing both compliance overhead and data-leakage surface area. For teams wanting to understand how filter context interacts with these measures across date and department slicers, the ALLSELECTED DAX function in Power BI article covers cross-filter behavior in detail.
How Do You Build a SWITCH Finance Toggle in Power BI: A Worked Model
Building the full SWITCH finance toggle requires four components: a disconnected parameter table, core financial measures, variance measures, and dynamic titles.
Step 1 - Create the Scenario Parameter Table
In Power BI Desktop, create a new table using Enter Data or DAX:
```
Scenario =
DATATABLE(
"Scenario", STRING,
"ScenarioOrder", INTEGER,
{
{"Actuals", 1},
{"Budget", 2},
{"Forecast", 3}
}
)
```
Do not create a relationship between this table and your fact table. It must remain disconnected - its sole function is to drive the slicer selection.
Step 2 - Build Core Financial Measures
For each finance KPI, write one SWITCH measure following the template above. A typical FP&A set covers:
| Measure Name | Actuals Source | Budget Source | Forecast Source |
|---|---|---|---|
| Selected Revenue | [Actuals Revenue] | [Budget Revenue] | [Forecast Revenue] |
| Selected COGS | [Actuals COGS] | [Budget COGS] | [Forecast COGS] |
| Selected Gross Margin % | [Actuals GM%] | [Budget GM%] | [Forecast GM%] |
| Selected OpEx | [Actuals OpEx] | [Budget OpEx] | [Forecast OpEx] |
| Selected EBITDA | [Actuals EBITDA] | [Budget EBITDA] | [Forecast EBITDA] |
Each row becomes one DAX measure, all following the same SWITCH template. This consistency makes the model auditable - any finance analyst or external reviewer can follow the pattern immediately.
Step 3 - Add Variance Measures
Variance measures that always compare against actuals are where SWITCH creates its most visible finance value:
```
Variance vs Actuals =
VAR ScenarioSelection = SELECTEDVALUE('Scenario'[Scenario], "Actuals")
RETURN
IF(
ScenarioSelection = "Actuals",
BLANK(),
[Selected Revenue] - [Total Actuals Revenue]
)
```
This returns variance only when Budget or Forecast is the active selection - the conditional behavior a CFO expects when reviewing plan versus actual performance.
How Do Dynamic Titles Work with SWITCH in Power BI Finance Dashboards?
Dynamic titles are a critical - and frequently skipped - element of a SWITCH finance model. A hardcoded title such as "Monthly Revenue" gives the viewer no signal about which scenario is currently active. Dynamic titles eliminate that ambiguity with one short measure.
Power BI allows any chart title or card label to reference a DAX measure. The title measure is concise:
```
Chart Title =
"Monthly Revenue - " & SELECTEDVALUE('Scenario'[Scenario], "Actuals")
```
When the slicer reads "Forecast," every chart on the page renders "Monthly Revenue - Forecast." Apply the same pattern to KPI card subtitles, matrix headers, and table labels.
For multi-currency financial reporting in Power BI - a Canadian SaaS company consolidating CAD and USD, or a European subsidiary reporting in EUR alongside GBP - the title measure can extend to include the active currency code:
```
Chart Title =
"Monthly Revenue ("
& SELECTEDVALUE('Currency'[CurrencyCode], "USD")
& ") - "
& SELECTEDVALUE('Scenario'[Scenario], "Actuals")
```
This makes the report self-documenting. An FP&A analyst exporting a screenshot for a board slide always knows precisely what they are viewing because the title carries both context signals simultaneously. Finance teams that need to document their reporting environment for GDPR audits (UK and EU readers) or PIPEDA compliance (Canadian organizations) will find additional governance considerations in the GDPR-compliant SaaS financial reporting checklist.
SWITCH vs. IF in DAX: Which Should Finance Teams Use?
Both functions can produce the same result. The practical choice depends on how many branches your measure needs and how readable it remains during future planning cycle audits.
| Criteria | SWITCH | Nested IF |
|---|---|---|
| Readability | High - each branch clearly listed | Low - each IF wraps the next |
| Best for scenario count | 3 or more branches | 1-2 branches |
| Short-circuit evaluation | Yes - stops at first match | No - all conditions evaluated |
| Maintenance cost | Add one line per new scenario | Add one nested IF level per scenario |
| Range condition support | SWITCH(TRUE(), ...) pattern | Native syntax |
| Finance toggle fit | Actuals / Budget / Forecast | Binary flags and on/off logic |
Short-circuit evaluation matters most in large finance models. When SWITCH branches reference iterating functions - for example, measures using SUMX vs SUM aggregations across multi-year transaction tables - the performance difference between SWITCH and nested IF compounds with data volume.
Use IF for a single binary condition. Use SWITCH for any logic requiring three or more discrete outcomes.
When Should FP&A Teams Use SWITCH for Multi-Scenario Reporting?
SWITCH is the right pattern whenever your finance team needs to present the same KPI set under different scenarios without duplicating pages, visuals, or report files. The clearest signal: three near-identical Power BI pages that all require updating every planning cycle.
Board reporting. CFOs presenting actuals alongside budget and prior-year forecast in the same meeting can toggle live without switching files or tabs. A single URL eliminates version confusion mid-presentation and - critically - ensures every executive in the room is looking at the same figure from the same governed dataset, not a stale Excel export emailed the night before and potentially superseded by a late journal entry.
Rolling forecast workflows. Teams that update forecasts monthly need measures that automatically reflect the latest data after each scheduled refresh. With SWITCH, one refresh propagates the latest forecast figures across every visual and dynamic title simultaneously - no manual measure edits, no partial updates. Finance teams adopting rolling 13-month forecast cycles, now common practice at SaaS companies in 2026, find this especially durable: the measure logic never changes as the horizon advances each month.
FP&A self-service access. When business-unit leaders run the report themselves, a scenario slicer is more intuitive than navigating between report tabs. The FP&A dashboard in Power BI step-by-step build guide covers self-service design patterns that non-technical finance stakeholders can operate confidently without analyst support.
Multi-currency consolidation. A US enterprise with UK and Canadian subsidiaries can layer a currency selector alongside the scenario selector, delivering a fully consolidated cross-entity view without building currency-specific pages.
What Are the Most Common SWITCH Mistakes in Finance DAX Models?
Several issues appear consistently when finance teams implement the SWITCH toggle pattern for the first time.
Using a related table instead of a disconnected one. If you create a model relationship between the parameter table and the fact table, SWITCH filters the underlying data instead of routing between measures. The parameter table must carry no model relationships.
String mismatches between the parameter table and the measure. The string "Actuals" and the string "actuals" are not the same value. A single capitalization discrepancy causes SWITCH to fall through to the BLANK() default silently, returning no data without any error message.
Returning zero instead of BLANK() in the else branch. Zero distorts percentage calculations - a Gross Margin percentage based on zero revenue renders as 0%, not as absent data. Use BLANK() as the fallback so Power BI treats an unmatched scenario as missing rather than zero.
Referencing a column instead of a scalar. SWITCH requires a scalar expression as its first argument. Passing a column reference without a SELECTEDVALUE wrapper produces unpredictable results or an outright error in the measure editor.
Misaligned date tables across scenario sources. If actuals, budget, and forecast live in separate tables with different date columns, each SWITCH branch may need a CALCULATE wrapper with USERELATIONSHIP to activate the correct date dimension per branch. This gap is especially common in finance models migrated from Excel, where each worksheet had implicit date alignment. The Power BI Report Builder vs Desktop finance guide covers multi-source model design decisions directly relevant to this scenario.
---
If your finance team is ready to move from a three-page workaround to a single governed reporting layer, explore how Power BI for SaaS finance teams can streamline your actuals-to-forecast workflow end to end.
---
About Lets Viz: Lets Viz is a data analytics consultancy that has partnered with finance and operations teams since 2020, serving clients across US healthcare, UK fintech, Canadian manufacturing, and global SaaS businesses. The team holds a 5.0 rating on Clutch (as of 2026) and specialises in Power BI architecture, DAX model design, and FP&A dashboard delivery for mid-market and enterprise clients.