SUMX in Power BI: Financial Reporting Beyond SUM
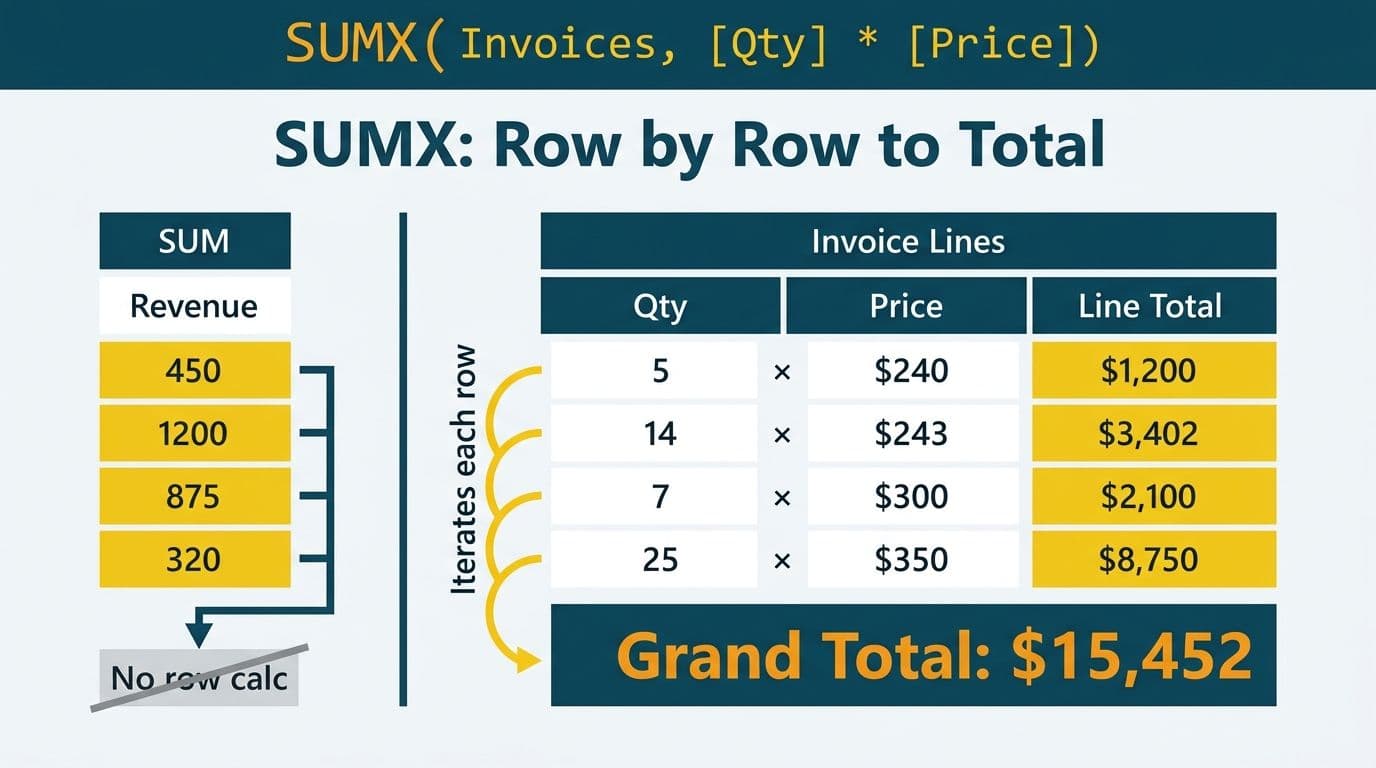
SUMX outperforms SUM when a calculation must occur at the row level before totaling - for example, multiplying quantity by unit price per invoice line. For P&L and budget-vs-actual reporting in Power BI, SUMX evaluates each row in its own context, giving finance teams accurate aggregations where SUM alone cannot reach across related tables or dynamic filters.
Key Takeaways
- SUMX is an iterator: it evaluates an expression row by row before summing, unlike SUM which totals a pre-existing column
- Use SUMX whenever a financial metric requires a per-row calculation: gross margin per line, weighted average rates, currency-adjusted actuals
- P&L reports benefit from SUMX when revenue and cost lines share a single Amount column and are distinguished by account codes
- CALCULATE and SUMX serve different purposes: CALCULATE modifies filter context; SUMX creates row context
- Combining both is standard practice: `CALCULATE(SUMX(...), DATEADD(...))` is the foundation of same-period-last-year and budget-vs-actual variance measures
What Is SUMX in Power BI and How Does It Work?
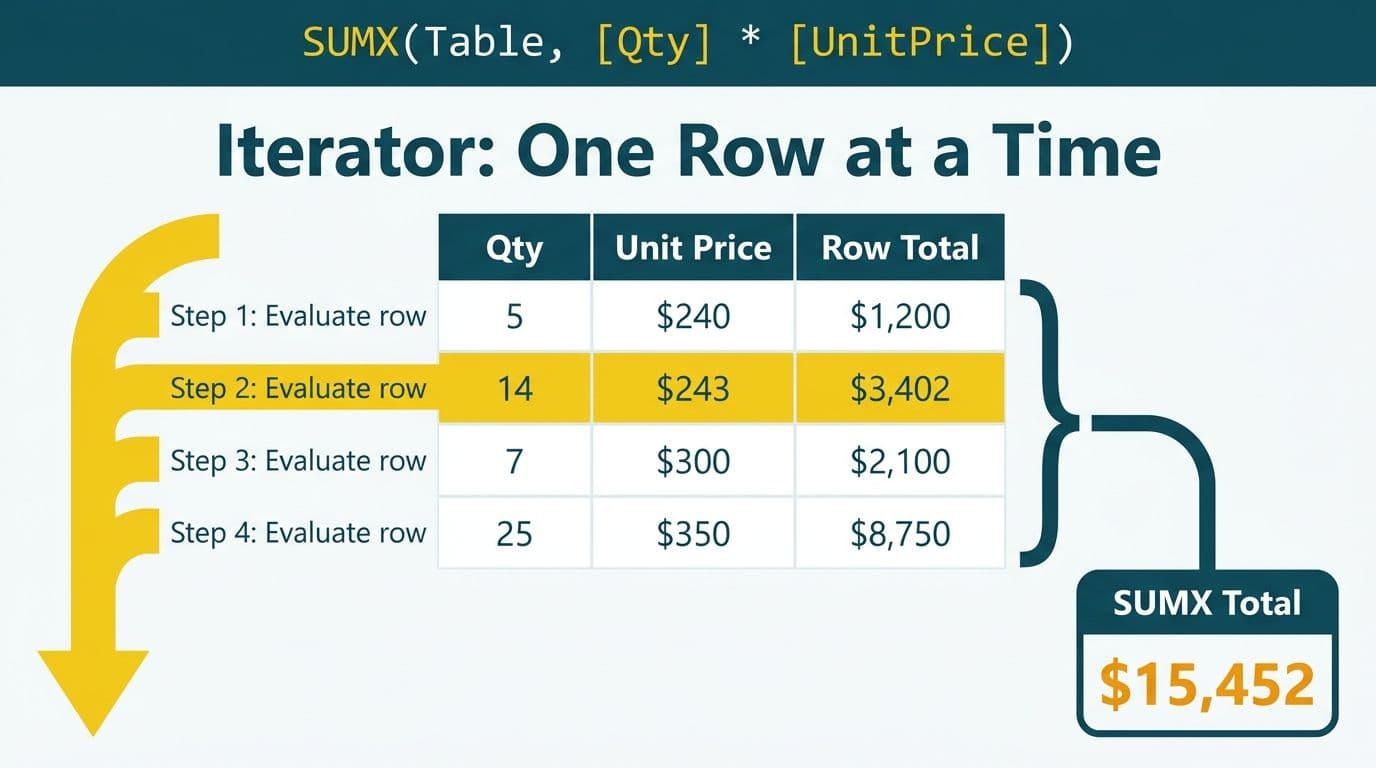
SUMX is a DAX iterator function that takes two arguments - a table and an expression - and returns the sum of that expression evaluated for every row in the table. According to Microsoft's DAX function reference (2025), the syntax is:
```dax
SUMX(<table>, <expression>)
```
The critical distinction from SUM is that SUMX operates in row context. When Power BI evaluates `SUMX(Sales, Sales[Quantity] * Sales[UnitPrice])`, it steps through each row of the Sales table, multiplies those two values in that row's specific context, then accumulates every result into a final total. SUM has no mechanism to do this - it can only aggregate a column that already exists in the model as a stored value.
This distinction matters immediately in financial models where no pre-calculated column exists. A revenue figure that requires multiplying shipped units by a contract rate that varies by customer and fiscal period cannot be addressed by SUM. SUMX handles it without adding a calculated column to the table, keeping the model lean and the logic in measures where it belongs.
For FP&A and finance technology leaders evaluating how DAX modeling fits into a broader AI automation consulting roadmap, the iterator pattern is the foundational building block that makes dynamic, formula-driven financial statements possible without pre-processing data in ETL layers or maintaining fragile calculated columns.
The Row Context Rule
Row context is the reason X-functions exist in DAX. When a measure runs inside a report visual, Power BI establishes a filter context from slicers, row headers, and column headers on that visual. It does not automatically create a row context for iterating fact-table rows. SUMX creates that row context explicitly, which is why it unlocks calculations that SUM cannot perform. The same principle applies to COUNTX and AVERAGEX iterator functions - they all follow the same evaluate-then-aggregate pattern.
SUMX With Virtual Tables
SUMX is not limited to physical model tables. Its first argument can be any table expression - including virtual tables constructed by FILTER, VALUES, CALCULATETABLE, or ADDCOLUMNS. This is what makes SUMX genuinely powerful in financial models: you can define the exact set of rows you want to iterate at measure evaluation time, with no need to materialize that subset anywhere in the model.
```dax
Adjusted Revenue =
SUMX(
FILTER(GL, GL[Status] = "Posted" && GL[Currency] = "USD"),
GL[Amount] * GL[FXRate]
)
```
The FILTER expression produces a virtual table of only posted USD transactions; SUMX iterates it and applies the per-row FX adjustment before summing.
SUMX vs SUM in Power BI: When to Use Each
The choice between SUMX and SUM reduces to one question: does the aggregation require a per-row expression, or does it simply total an existing column?
| Scenario | Use SUM | Use SUMX |
|---|---|---|
| Total a single additive column (GL Amount, Revenue) | Yes | Not needed |
| Multiply two columns per row (Qty x Unit Price) | No | Yes |
| Calculate gross margin per line before summing | No | Yes |
| Aggregate from a related table via RELATED | No | Yes |
| Weighted average (rate x weight / total weight) | No | Yes |
| Conditional per-row adjustment or override | No | Yes |
| Date intelligence (YTD, SPLY) on a simple column | SUM inside CALCULATE | SUMX inside CALCULATE |
| Iterate a virtual table produced by FILTER or CALCULATETABLE | No | Yes |
A practical rule: if you would write the calculation in a spreadsheet as a helper column formula before doing the SUM, that helper column logic belongs inside the SUMX expression in DAX.
Performance Considerations
SUMX can be slower than SUM for very large tables because it forces the DAX formula engine to iterate rows rather than pushing the aggregation directly to the VertiPaq storage engine. For most financial reporting workloads - general ledger entries, budget lines, invoice records - table sizes are small enough that SUMX performance is not a practical concern. If iteration latency does appear on large fact tables, consider whether a calculated column can pre-compute the row-level value at refresh time, at the cost of additional model memory.
How Do You Use SUMX for P&L Financial Reporting?
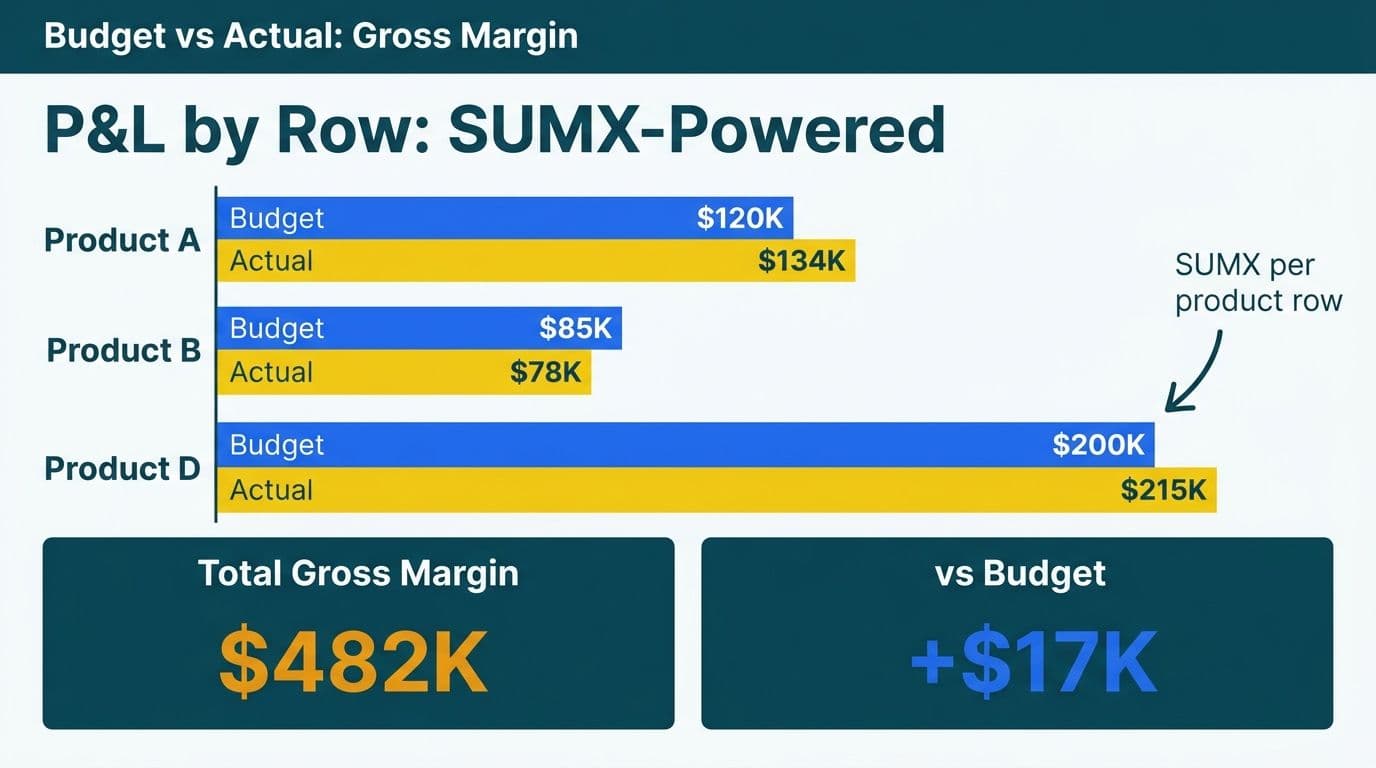
A P&L in Power BI typically draws from a general ledger fact table where each row carries an account code, cost center, fiscal period, and amount. Revenue and COGS are not separate columns - they are filter values on the same Amount column. SUMX combined with FILTER isolates each P&L category cleanly and maintains full slice-ability by period, department, and entity.
Basic P&L Measure Pattern
Assume a GL fact table with columns: `GL[Account]`, `GL[CostCenter]`, `GL[Period]`, `GL[Amount]`.
Gross Revenue:
```dax
Gross Revenue =
SUMX(
FILTER(GL, GL[Account] >= 4000 && GL[Account] < 5000),
GL[Amount]
)
```
COGS:
```dax
COGS =
SUMX(
FILTER(GL, GL[Account] >= 5000 && GL[Account] < 6000),
GL[Amount]
)
```
Gross Margin %:
```dax
Gross Margin % =
DIVIDE([Gross Revenue] - [COGS], [Gross Revenue], 0)
```
This approach is more maintainable than hard-coding separate calculated columns for each P&L line, and it responds dynamically to slicers for period, department, and legal entity without requiring model changes.
Multi-Currency P&L
A UK fintech firm reporting across EUR, GBP, and USD subsidiaries needs each GL transaction converted at its period exchange rate before the P&L aggregates. SUMX handles this precisely:
```dax
Revenue GBP =
SUMX(
GL,
GL[Amount] * RELATED(ExchangeRates[Rate])
)
```
SUM cannot perform this lookup. The `RELATED` function requires row context to match each GL row to its corresponding period and currency entry in the ExchangeRates table - row context that SUMX provides. For EU entities operating under GDPR, this pattern keeps all processing within the Power BI tenant, with no requirement to export transaction-level data to external tools for currency conversion.
Operating Expense Breakdown
Beyond the top-line P&L, SUMX with FILTER scales to operating expense categories. A US healthcare provider tracking department-level opex under HIPAA can build measures for salaries, supplies, and overhead using the same account-range filter pattern, with row-level security ensuring each department head sees only their own cost center data.
How Does SUMX Handle Budget vs Actual Analysis in Power BI?
Budget-vs-actual analysis is the most common financial reporting scenario where SUMX becomes essential, because actuals and budget figures typically live in separate fact tables at different granularities - actuals at the daily transaction grain, budgets at the monthly department level.
Variance Measure Pattern
Actuals:
```dax
Actual Amount =
SUMX(Actuals, Actuals[Amount])
```
Budget:
```dax
Budget Amount =
SUMX(Budget, Budget[BudgetAmount])
```
Variance %:
```dax
Variance % =
DIVIDE([Actual Amount] - [Budget Amount], [Budget Amount], 0)
```
Using SUMX over Budget rather than a simple SUM is intentional: as the data model grows to include multiple budget versions - original budget, revised forecast, board-approved plan - SUMX with a FILTER argument makes it straightforward to parameterize which version is being compared without rewriting every measure.
Same-Period-Last-Year Comparison
SUMX pairs with DATEADD for same-period-last-year comparisons, a reporting staple across professional services, manufacturing, and financial services:
```dax
Revenue SPLY =
CALCULATE(
SUMX(GL, GL[Amount]),
DATEADD(DateTable[Date], -1, YEAR)
)
```
This pattern - CALCULATE wrapping SUMX - is how the two functions complement each other. CALCULATE shifts the filter context to the prior year; SUMX iterates the resulting filtered rows and applies the per-row expression. A Canadian manufacturing company producing quarterly variance reports under PIPEDA governance can build this measure once and trust that it delivers auditable, period-consistent outputs without manual spreadsheet intervention.
For multi-entity models where relationship direction affects which filters propagate between tables, the guide on CROSSFILTER DAX: Override Relationship Direction in Power BI covers the relationship layer that keeps cross-table SUMX measures reliable.
SUMX vs CALCULATE: Which Is Right for Row-Context Financial Aggregations?
CALCULATE and SUMX are frequently treated as alternatives. They are not - they operate at different levels of the DAX evaluation model and are almost always used together in production financial reports.
| Function | Primary Role | Typical Financial Use Case |
|---|---|---|
| `SUM(column)` | Aggregate an existing column | Simple total of a pre-calculated field |
| `CALCULATE(expr, filter)` | Modify filter context | Date intelligence, conditional aggregation, cross-filter override |
| `SUMX(table, expr)` | Create row context, iterate, sum | Per-row margin, weighted rate, multi-column calculation |
| `CALCULATE(SUMX(...), filter)` | Modify filter context around row iteration | SPLY comparison, budget version selection, entity-level override |
Why CALCULATE Alone Cannot Replace SUMX
CALCULATE changes what rows are visible to a measure; it does not iterate those rows with a custom expression. If the calculation must happen at the row level, CALCULATE alone cannot do it.
```dax
-- Wrong: multiplies aggregated totals, not row-level values
Wrong Revenue = CALCULATE(SUM(Sales[Quantity]) * SUM(Sales[UnitPrice]))
-- Correct: multiplies per row, then sums
Correct Revenue = SUMX(Sales, Sales[Quantity] * Sales[UnitPrice])
```
The incorrect version multiplies total quantity by total unit price - which only produces the right answer if every sale shares an identical unit price. In a real pricing model with customer-specific contract rates, the error compounds silently across every fiscal period and every slicer combination.
Common patterns that layer both functions include using `ALL()` or `REMOVEFILTERS()` inside CALCULATE to remove a slicer context before SUMX iterates - useful for computing each department's share of a company-wide total in a P&L waterfall.
For FP&A leaders assessing whether their current DAX architecture supports their reporting ambitions, the When to Outsource Finance Analytics Consulting: CFO Guide offers a structured decision framework for evaluating in-house build capacity against specialist engagement.
How Do Finance Teams Automate SUMX-Based Financial Reporting?
Building accurate SUMX measures is the first step. The operational challenge for finance teams across US healthcare, UK fintech, and Canadian manufacturing is embedding those measures into scheduled, automated reporting workflows that eliminate the manual FP&A consolidation cycle.
Scheduled Refresh and Distribution
A US SaaS finance team using Power BI can schedule daily dataset refreshes via the Power BI service, so SUMX-based P&L and budget-vs-actual measures always reflect the latest GL data. Combined with paginated reports exported to PDF on a schedule, this pattern replaces the end-of-month spreadsheet consolidation entirely. Finance leads receive a consistent, model-driven P&L in their inbox each morning without analyst intervention.
A UK fintech firm subject to FCA reporting requirements can build SUMX-based variance measures that feed a regulatory dashboard directly, with row-level security ensuring each business unit sees only its own cost centers. GDPR compliance is maintained because all processing stays within the Power BI tenant - no transaction-level data leaves to external conversion tools.
Build vs. Hire for Automated Reporting
For professional services firms evaluating whether to build DAX reporting capability in-house or bring in a specialist, the decision typically hinges on measure complexity and data model maturity. A single-entity P&L with ten measures is straightforward to build in-house. A multi-entity consolidation with currency translation, budget version toggling, same-period-last-year comparisons, and HIPAA- or GDPR-constrained row-level security is the profile where specialist engagement pays back quickly in avoided rework.
When Measure Complexity Demands a Review
As a financial model grows to dozens of SUMX measures, nested CALCULATE contexts, and multiple fact tables, the risk of incorrect filter context interactions rises. A measure that totals correctly at the report-level visual may silently produce wrong results when a slicer changes the filter context - a class of error that is difficult to detect without systematic DAX testing. Specialist DAX auditing, available through Managed Power BI services, provides a structured review of the measure layer before errors surface in a CFO dashboard.
For organizations evaluating their readiness to build or extend a Power BI financial reporting capability, the free BI readiness self-assessment offers a structured starting point before committing to a build or an engagement.
---
About Lets Viz: Lets Viz has delivered data analytics and Power BI solutions since 2020, serving clients across US healthcare, UK fintech, Canadian manufacturing, and global SaaS. The firm holds a 5.0 Clutch rating and specializes in DAX modeling, automated financial reporting, and AI-powered analytics - translating complex data architectures into decision-ready dashboards for finance, operations, and executive teams.
If your P&L and budget-vs-actual reports still depend on manual spreadsheet consolidation, a structured DAX review from our AI automation consulting team can replace that cycle with reliable, automated financial reporting.