Social Determinants of Health Analytics Dashboard in Power BI
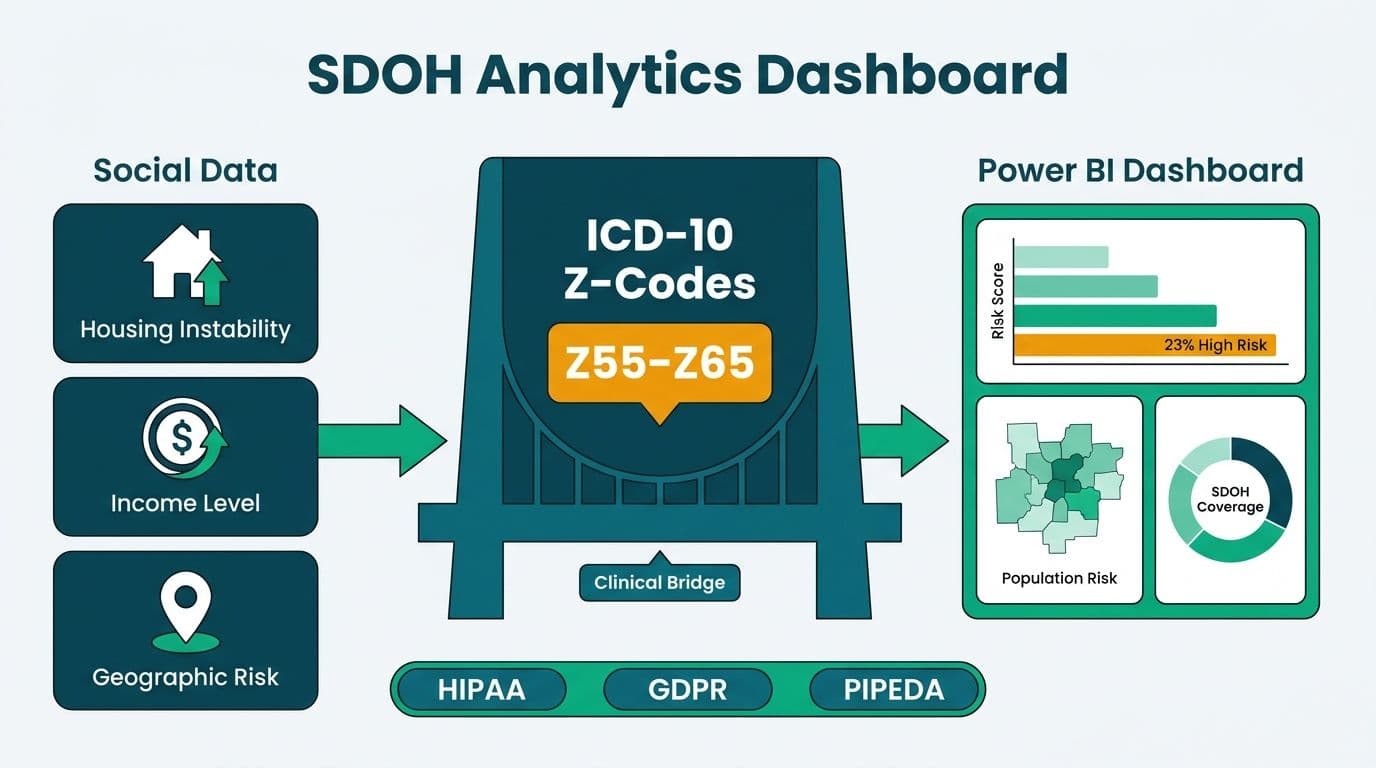
A social determinants of health analytics dashboard connects non-clinical data - housing instability, income, and geography - to patient outcomes by mapping ICD-10 Z-codes (Z55-Z65) into Power BI population health models. US payers operate under HIPAA row-level security, NHS trusts apply GDPR consent flags, and Canadian health authorities enforce PIPEDA data-minimization - each regulatory layer shaping how SDOH variables are stored, visualized, and acted on.
Key Takeaways
- ICD-10 Z-codes (Z55-Z65) are the standardized bridge between clinical EHR data and SDOH variables in population health dashboards.
- HIPAA requires row-level security and de-identification before SDOH data enters a shared Power BI workspace; GDPR and PIPEDA add consent and minimization controls.
- US Medicare Advantage plans, NHS England trusts, and Canadian provincial health organizations each have distinct data pipelines for SDOH ingestion.
- Power BI's composite model - combining DirectQuery for live claims data and Import mode for census and deprivation indices - is the dominant architecture for production SDOH dashboards.
- Governance is the hardest part: SDOH data from housing agencies, food banks, and income programs sits outside the EHR, requiring a formal data-sharing agreement before it can be joined.
What Are Social Determinants of Health and Why Do They Belong in Analytics?
Social determinants of health (SDOH) are the non-clinical conditions that shape a person's health outcomes - where they live, their income level, access to transportation, food security, and social connectedness. Clinical data alone misses the majority of drivers of population health outcomes, which is why health systems and payers increasingly ingest SDOH variables alongside diagnoses and claims.
The challenge is standardization. SDOH data arrives from disparate sources: housing authority records, census deprivation indices, food bank referrals, and self-reported health risk assessments. Without a common coding scheme, joining these datasets to clinical records in a Power BI data model becomes an exercise in manual field mapping that breaks every time a source changes its schema.
ICD-10 Z-codes solve part of this problem. The Z55-Z65 block captures "persons with potential health hazards related to socioeconomic and psychosocial circumstances" - codes that clinicians can enter directly into an EHR encounter. When those Z-codes flow into a claims feed or FHIR-compliant export, they become a queryable SDOH signal that Power BI can join to clinical outcome measures without requiring a separate housing or income dataset.
For healthcare organizations building their first SDOH capability, the most practical starting point is a Managed Power BI for healthcare teams arrangement where data engineers own the Z-code pipeline and analysts own the dashboard logic - separating PHI handling from visualization work. This structure also makes compliance reviews faster, since the data access layer and the reporting layer can be audited independently.
That structural discipline matters more as SDOH programs scale. A small pilot joining Z59 (housing instability) to 30-day readmission rates is manageable in a single dataset. A production model joining twelve Z-code categories to claims, census tracts, and EHR lab values across 200,000 attributed lives requires a governed semantic layer - the kind covered in the Power BI Governance Best Practices checklist.
How Do ICD-10 Z-Codes Map SDOH Variables into a Population Health Dashboard?
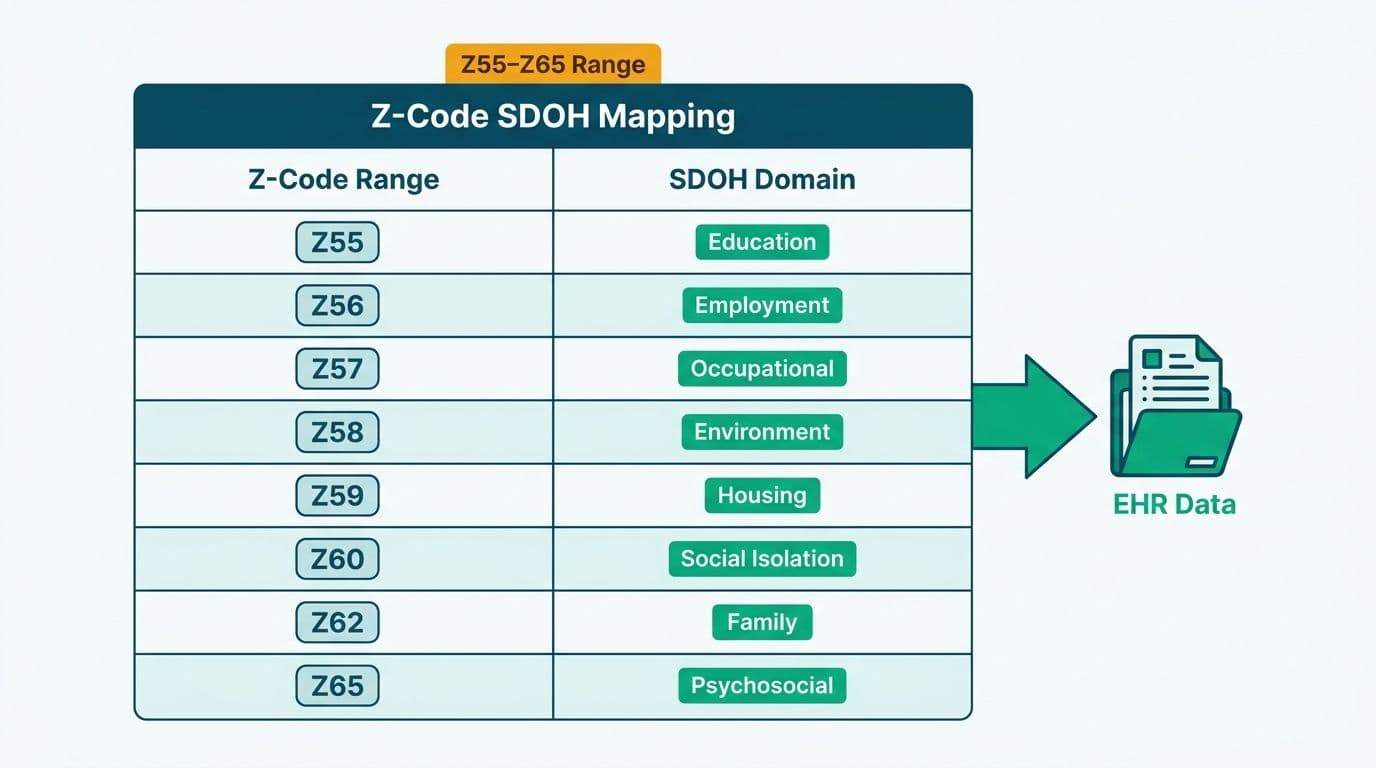
ICD-10 Z-codes act as a lookup key: the code lives in the clinical record, the SDOH detail lives in a linked dimension table, and Power BI joins them at the person or encounter level.
The table below shows how the most frequently used Z-codes map to dashboard variables and compliance tags:
| SDOH Variable | ICD-10 Z-Code | Power BI Measure | Regulatory Tag |
|---|---|---|---|
| Housing instability | Z59.0 | % members with active flag | HIPAA PHI / GDPR Art. 9 |
| Food insecurity | Z59.4 | Food-risk score (0-5) | HIPAA PHI |
| Income below threshold | Z59.6 | Deprivation quintile | GDPR Art. 9 / PIPEDA sensitive |
| Education barriers | Z55.0 | Low-literacy flag | PIPEDA Schedule 1 |
| Social isolation | Z60.2 | Engagement score | GDPR Art. 9 |
| Transport/geographic access | Z59.9 | Drive-time to nearest provider (miles) | HIPAA de-identified if aggregated |
In Power BI, the recommended approach is a composite model: clinical claims arrive via DirectQuery from the enterprise data warehouse (preserving live HIPAA-compliant access controls), while SDOH enrichment tables - census deprivation indices, Z-code dimension tables, geographic lookup files - are loaded in Import mode for query performance. A bridge table keyed on a de-identified member ID links the two sides.
One practical consideration: Z-codes are significantly under-coded in most EHRs. A clinician treating a patient with housing instability may prioritize the primary diagnosis on the claim, leaving Z59.0 uncoded even when the social risk is clinically relevant. Under-coding means any dashboard relying solely on coded Z-codes will underestimate SDOH burden in the attributed population. Many US payers and NHS trusts therefore supplement Z-code data with patient-reported outcome measures (PROMs) and third-party social risk screening tools (such as the PRAPARE or AHC-HRSN instruments), then crosswalk those responses back to Z-code equivalents for consistency across the data model.
For a deeper look at what this kind of implementation costs in a healthcare setting, the Power BI Healthcare Reporting Implementation Cost Guide covers typical project scopes from pilot to enterprise rollout.
How Do US Payers Layer SDOH into Population Health Dashboards Under HIPAA?
For US Medicare Advantage plans and commercial payers, SDOH analytics are now a CMS priority. Medicare Advantage organizations must screen for SDOH needs under CMS guidance, and those screening results - whether coded as Z-codes on claims or stored as structured responses in a care management platform - need to surface in population health dashboards for care coordinators.
The HIPAA compliance architecture for a Power BI SDOH dashboard typically involves four controls:
Row-level security (RLS): Care coordinators see only the attributed members in their panel. Population-level analysts see aggregated statistics but not individual PHI. RLS roles in Power BI are configured in the dataset, not the report, so they persist across every report that uses the same semantic model.
Business Associate Agreements (BAAs): Microsoft's BAA for Power BI covers the entire Fabric/Power BI Premium stack. If SDOH data from a third-party social risk vendor - a housing database or food bank referral system - flows into the same workspace, that vendor also needs a BAA in place before the data join occurs.
De-identification before aggregation: Geographic SDOH variables (census tract, zip code) become PHI when combined with date of service and diagnosis. The Safe Harbor de-identification standard removes zip codes to 3-digit prefixes and suppresses cells with fewer than 11 members - standard practice for geographic heat maps in population health dashboards.
Audit logs: Power BI Premium's activity log captures every data access event. For HIPAA-regulated dashboards, these logs should be exported to Azure Monitor or a SIEM on a 90-day or longer retention schedule.
A hypothetical scenario: suppose a 500,000-member Medicare Advantage plan joins Z59.0 (housing instability) flags to 30-day readmission rates by county. The dashboard correctly shows which counties have the highest co-occurrence of housing instability and readmissions, allowing the care management team to prioritize outreach - without any individual member's identity appearing in the county-level view.
How Do NHS Trusts and Canadian Health Authorities Approach SDOH Analytics?
NHS England: NHS trusts work with the Index of Multiple Deprivation (IMD), a government-published composite score covering income, employment, education, health, crime, housing, and environment at the Lower Super Output Area (LSOA) level. Because IMD is aggregated geography data rather than individual PHI, it can be joined to de-identified patient cohorts without triggering GDPR Article 9 special-category protections - provided the join key does not re-identify individuals.
NHS Digital's Data Security and Protection Toolkit (DSPT) sets the baseline for data processing agreements. Any Power BI workspace handling NHS patient data must be assessed against DSPT standards, and the organization's Data Protection Officer must approve the SDOH data sharing arrangement. GDPR Article 9 applies to health data explicitly, so consent or an Article 9(2)(h) clinical care exemption must be documented before individual-level SDOH data enters the model.
A UK NHS trust building a community respiratory health dashboard might join IMD deprivation quintiles to asthma admission rates by LSOA, displaying a choropleth map in Power BI. Because the join is at geographic level (LSOA), not patient level, the GDPR burden is lower - the map shows area deprivation patterns, not named individuals.
Canada: Provincial health organizations - such as Ontario Health, Alberta Health Services, or BC's Provincial Health Services Authority - work within PIPEDA at the federal level and provincial health information protection acts (PHIPA in Ontario, HIA in Alberta). Statistics Canada's Social Determinants of Health framework and the Canadian Institute for Health Information (CIHI) Social Determinants dataset provide standardized variables that map to ICD-10-CA Z-codes used in Canadian clinical records.
PIPEDA's accountability principle requires that any SDOH data sharing with a Power BI workspace be governed by a written data sharing agreement, and that data use be limited to the purpose stated at collection - meaning a dashboard built for care management cannot later be repurposed for actuarial pricing without fresh consent. For a Canadian provincial health organization analyzing workforce health trends, this purpose-limitation rule shapes dashboard design from the start.
For organizations handling cross-border data - for example, a US payer with Canadian subsidiaries - the ServiceNow ITSM for Healthcare IT Teams: HIPAA, GDPR and PIPEDA article covers the multi-jurisdictional governance framework in more detail.
What Compliance Guardrails Apply to SDOH Dashboards Across US, UK, and Canada?
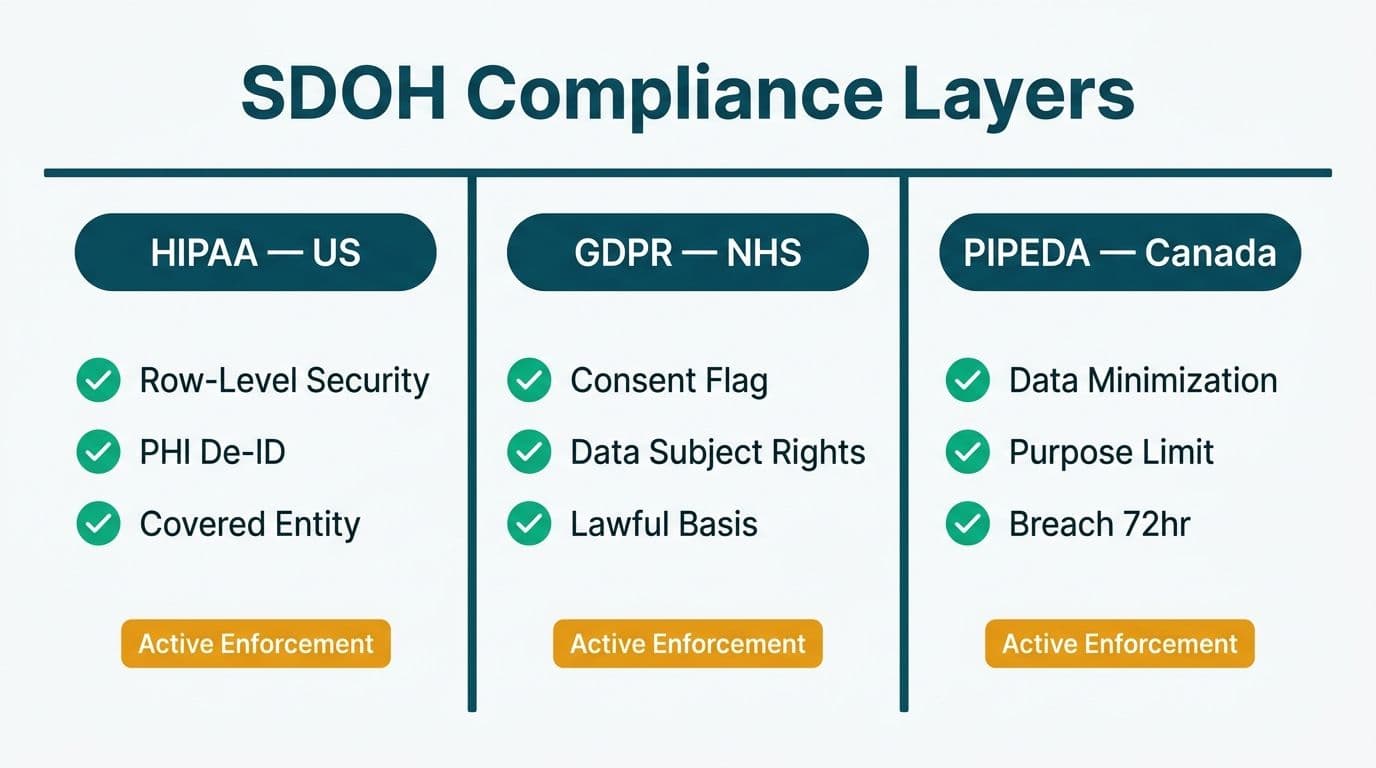
The compliance requirements differ by jurisdiction but converge on three shared principles: data minimization, access control, and audit.
Data minimization: Collect and display only the SDOH variables needed for the stated clinical or operational purpose. A readmission risk dashboard does not need a member's specific income figure - a deprivation quintile or zip-code-level median income serves the same analytic purpose with lower re-identification risk.
Access control: Row-level security in Power BI enforces access at the dataset level. In all three jurisdictions, the standard is: individual-level data visible only to authorized care team members; aggregate data accessible to population health analysts; no PHI in exported Excel files or email-distributed reports.
Audit and retention: HIPAA requires a minimum 6-year audit trail for PHI access. GDPR Article 30 requires records of processing activities. PIPEDA Principle 4.1.4 requires accountability documentation. Power BI's activity logs, combined with Azure Monitor or an equivalent log aggregation tool, satisfy all three - provided retention policies are configured explicitly.
One area where GDPR diverges from HIPAA and PIPEDA is data subject rights. Under GDPR, a patient can request deletion of their personal data, which means an SDOH data model must support selective row deletion without corrupting aggregate historical metrics. Designing for this from the start - typically by separating individual-level fact tables from pre-aggregated summary tables - avoids expensive retrofits later. The right-to-erasure requirement also shapes data retention policy: SDOH variables collected under GDPR consent cannot be retained indefinitely, and a retention schedule tied to the clinical purpose should be mirrored in the Power BI dataset's refresh and archival configuration.
What Does a Production SDOH Analytics Dashboard Include?
A production social determinants of health analytics dashboard typically organizes into three layers:
Population overview layer: Geographic heat map showing SDOH risk concentration by census tract (US), LSOA (UK), or census subdivision (Canada). Filters for Z-code category, risk tier, and attributed care team. This layer uses aggregated data and is accessible to population health analysts without PHI clearance.
Cohort drill-down layer: Clinician-facing panel showing attributed members flagged for specific SDOH needs, with Z-code detail, intervention status, and care gap flags. HIPAA, GDPR, and PIPEDA access controls restrict this layer to authorized care team members only.
Trend and outcome layer: Time-series analysis joining SDOH flag prevalence to outcome metrics (readmission rates, ED utilization, preventive care gaps). This layer answers whether SDOH interventions - housing referrals, food vouchers, transportation support - are associated with improved outcomes at the population level.
The cleanest Power BI implementation separates these three layers into distinct reports sharing a single semantic model. Governance rules enforced at the dataset level propagate automatically, and the population health analyst and the care coordinator see different views of the same underlying data without manual access management overhead. For teams evaluating whether their current infrastructure can support this architecture, the free BI readiness self-assessment surfaces gaps in data governance, source system connectivity, and security configuration before the build starts.
---
About Lets Viz: Lets Viz has partnered with healthcare administrators, CIOs, and data teams across US hospitals, UK NHS organisations, and Canadian health authorities since 2020, building HIPAA-, GDPR-, and PIPEDA-compliant Power BI solutions. The team holds a 5.0 Clutch rating and serves clients across US healthcare, UK fintech, Canadian manufacturing, and global SaaS.
Ready to build a compliant social determinants of health analytics dashboard for your health system? The Managed Power BI for healthcare teams service covers the full stack - Z-code data pipeline, composite model architecture, row-level security configuration, and compliance documentation - so your clinical and analytics teams can focus on improving population health outcomes.