ServiceNow ITSM KPIs to Track in Power BI: A Practitioner Guide
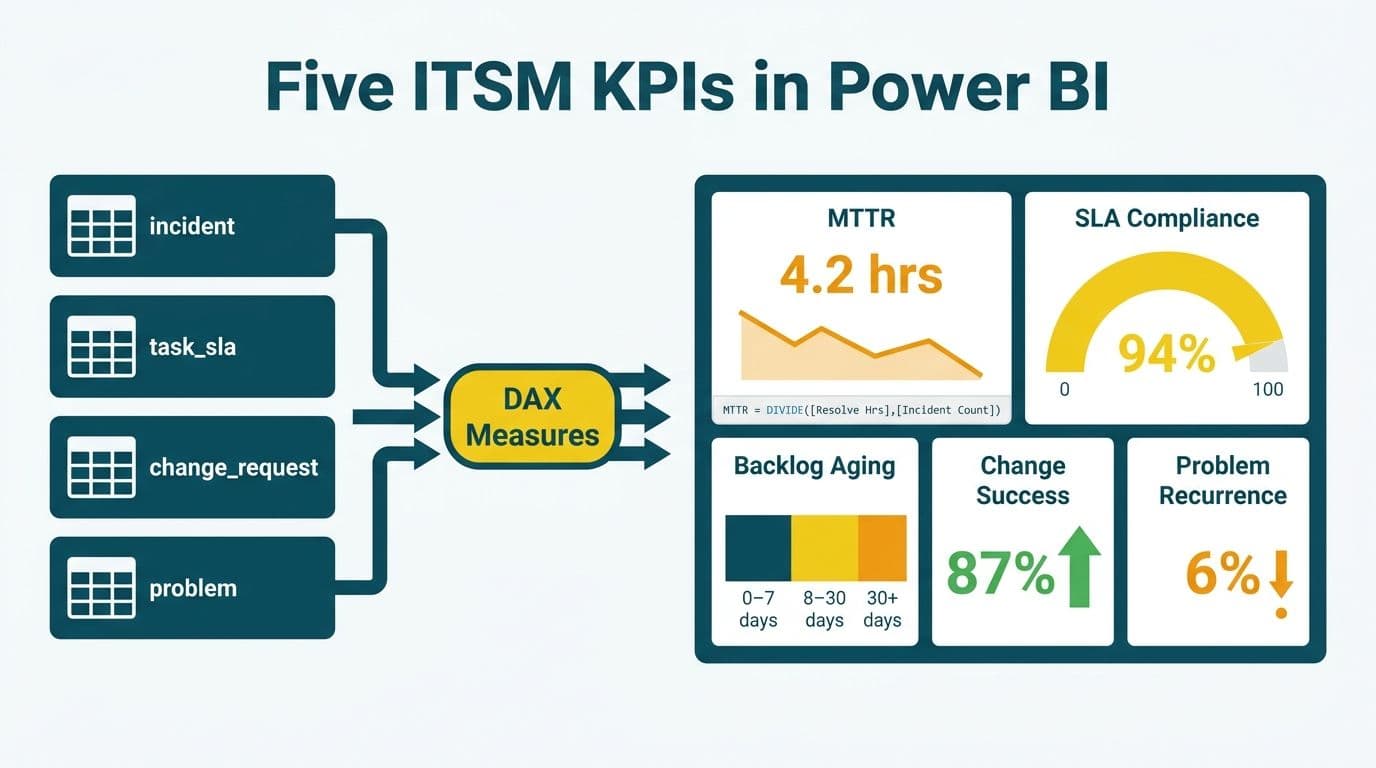
The ServiceNow ITSM KPIs that belong in every Power BI dashboard are Mean Time to Resolve (MTTR), SLA Compliance Rate, Backlog Aging, Change Success Rate, and Problem Recurrence Rate. Each pulls from a different ServiceNow table - incident, task_sla, change_request, and problem - and each needs a dedicated DAX measure written for business-hours logic, breach detection, and aging bucket distribution. Getting these five right turns a raw ServiceNow export into an operational scorecard that CIOs and finance directors can act on the same morning the data lands.
Key Takeaways
- MTTR, SLA Compliance Rate, and Backlog Aging are the three incident-layer KPIs most requested by CIOs and operations leads building ServiceNow dashboards in Power BI.
- Naive AVERAGEX calculations overstate resolution time by counting weekends and holidays - a business-hours calendar table is required for an accurate result.
- ServiceNow's task_sla table stores pre-computed breach flags, eliminating the need to recalculate SLA windows in DAX.
- Change Success Rate and Problem Recurrence Rate provide the change and problem management layers that complete a full ITSM scorecard.
- Row-level security in Power BI is a compliance requirement for US organizations under HIPAA, UK and EU organizations under GDPR, and Canadian organizations subject to PIPEDA - not an optional feature.
What Are the Core ServiceNow ITSM KPIs to Track in Power BI?
A ServiceNow data model is wide - incidents, problems, changes, assets, catalog requests - but the KPIs that drive operational decisions concentrate in five metrics across three ITSM disciplines. Incident management yields MTTR and SLA Compliance Rate. Problem management yields Problem Recurrence Rate. Change management yields Change Success Rate and Change Lead Time.
These five are the foundation of every ServiceNow + Power BI / Tableau consulting engagement because they surface the signals a CIO can act on and that a finance director can correlate to support headcount cost and unplanned downtime exposure. The ServiceNow tables that feed them:
| KPI | Source Table | Key Fields |
|---|---|---|
| MTTR | incident | opened_at, resolved_at, state, priority |
| SLA Compliance Rate | task_sla | has_breached, stage, task, sla |
| Backlog Aging | incident | opened_at, state, priority, assignment_group |
| Change Success Rate | change_request | state, close_code |
| Problem Recurrence Rate | problem | reopen_count, related_incidents |
Connect via ServiceNow's OData feed, the certified Power BI connector, or the Table API using a service account with the itil and report_user roles. For a detailed walkthrough of connector options, refresh strategies, and gateway configuration, ServiceNow Power BI Integration: A Complete Guide covers each path end to end.
How Do You Calculate MTTR from ServiceNow Incident Data in Power BI?
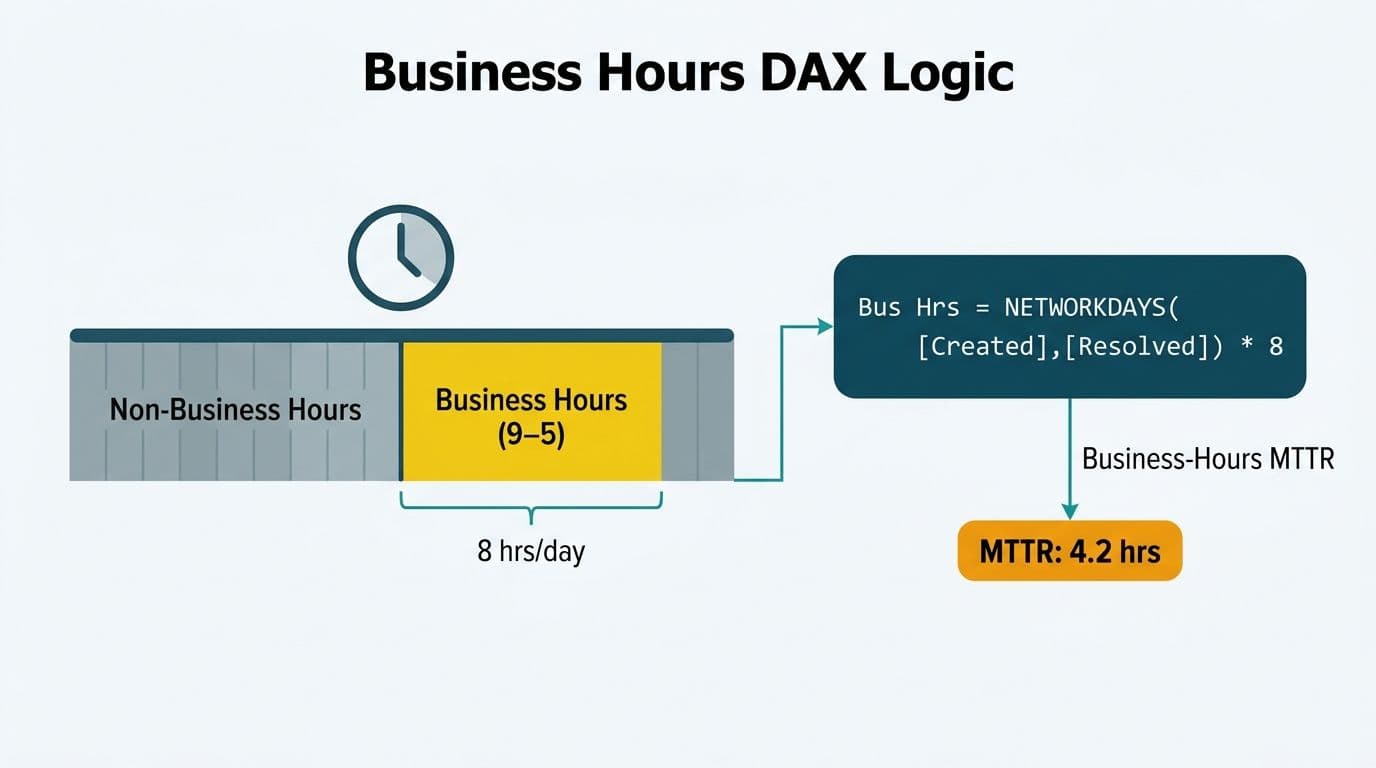
Mean Time to Resolve is the average elapsed time between an incident being opened and closed as resolved. The formula is straightforward - the implementation detail that trips most teams is excluding non-business hours from the calculation.
A naive DAX measure:
```dax
MTTR Hours (Naive) =
AVERAGEX(
FILTER(
Incidents,
Incidents[State] = "Resolved"
&& NOT ISBLANK(Incidents[ResolvedAt])
),
DATEDIFF(Incidents[OpenedAt], Incidents[ResolvedAt], HOUR)
)
```
This inflates MTTR by counting Saturday and Sunday hours, after-hours time, and public holidays as elapsed resolution time. A UK fintech firm running a 24x5 support model will see weekend hours push the metric well above its true operational baseline - making a well-functioning team appear slower than it is on a Monday morning executive review.
The production pattern uses a Business Hours Calendar table - either exported from ServiceNow's cmn_schedule table or built in Power Query - that holds one row per working hour slot, pre-filtered for your support schedule. AVERAGEX then counts only those slots:
```dax
MTTR Business Hours =
AVERAGEX(
FILTER(
Incidents,
Incidents[State] = "Resolved"
&& NOT ISBLANK(Incidents[ResolvedAt])
),
CALCULATE(
COUNTROWS(BusinessHours),
DATESBETWEEN(
BusinessHours[HourSlot],
Incidents[OpenedAt],
Incidents[ResolvedAt]
)
)
)
```
The BusinessHours table contains one row per working hour slot. COUNTROWS returns only the slots that fall between opened_at and resolved_at, automatically excluding weekends, public holidays, and out-of-hours periods without any IF logic.
Priority slicing is the next layer. A P1 incident in a US hospital's Epic-connected ServiceNow instance carries a different contractual ceiling than a P4 helpdesk ticket. Add a Priority slicer to the report page and the single measure above returns MTTR for whatever priority is selected - filter context handles the segmentation without rewriting the DAX.
What Is SLA Compliance Rate and How Do You Measure It in DAX?
SLA Compliance Rate is the percentage of SLA records resolved within the contracted window. ServiceNow pre-computes breach status in the task_sla table - the has_breached boolean is set by the platform as each SLA progresses through its lifecycle - which means the Power BI measure does not need to recalculate SLA windows from raw timestamps.
The core measure:
```dax
SLA Compliance Rate =
DIVIDE(
COUNTROWS(
FILTER(TaskSLA, TaskSLA[HasBreached] = FALSE)
),
COUNTROWS(TaskSLA),
0
)
```
Format the result as a percentage and apply conditional formatting: red below 90%, amber between 90% and 95%, green above 95%. This threshold structure aligns with ServiceNow's ITSM process documentation (2025) for mature mid-market service organizations.
A critical scoping detail: ServiceNow attaches one task_sla row per SLA definition per ticket. A single P2 incident may carry three SLAs - initial response, update frequency, and resolution. Measure them without filtering and breach counts will be misleading. Filter by SLA Definition Name to isolate the resolution SLA specifically:
```dax
Resolution SLA Compliance =
DIVIDE(
COUNTROWS(
FILTER(
TaskSLA,
TaskSLA[SLAName] = "P2 Resolution"
&& TaskSLA[HasBreached] = FALSE
)
),
COUNTROWS(
FILTER(
TaskSLA,
TaskSLA[SLAName] = "P2 Resolution"
)
),
0
)
```
For a Canadian hospital network operating ServiceNow under PIPEDA and provincial health data legislation, SLA tracking across IT support and clinical coordination tickets must respect data classification boundaries - determining which users see which ticket categories before the data reaches Power BI. ServiceNow ITSM for Healthcare IT Teams: HIPAA, GDPR & PIPEDA covers how to configure those classification controls upstream before any data surfaces in a reporting layer.
How Do You Build a Backlog Aging Report in Power BI?
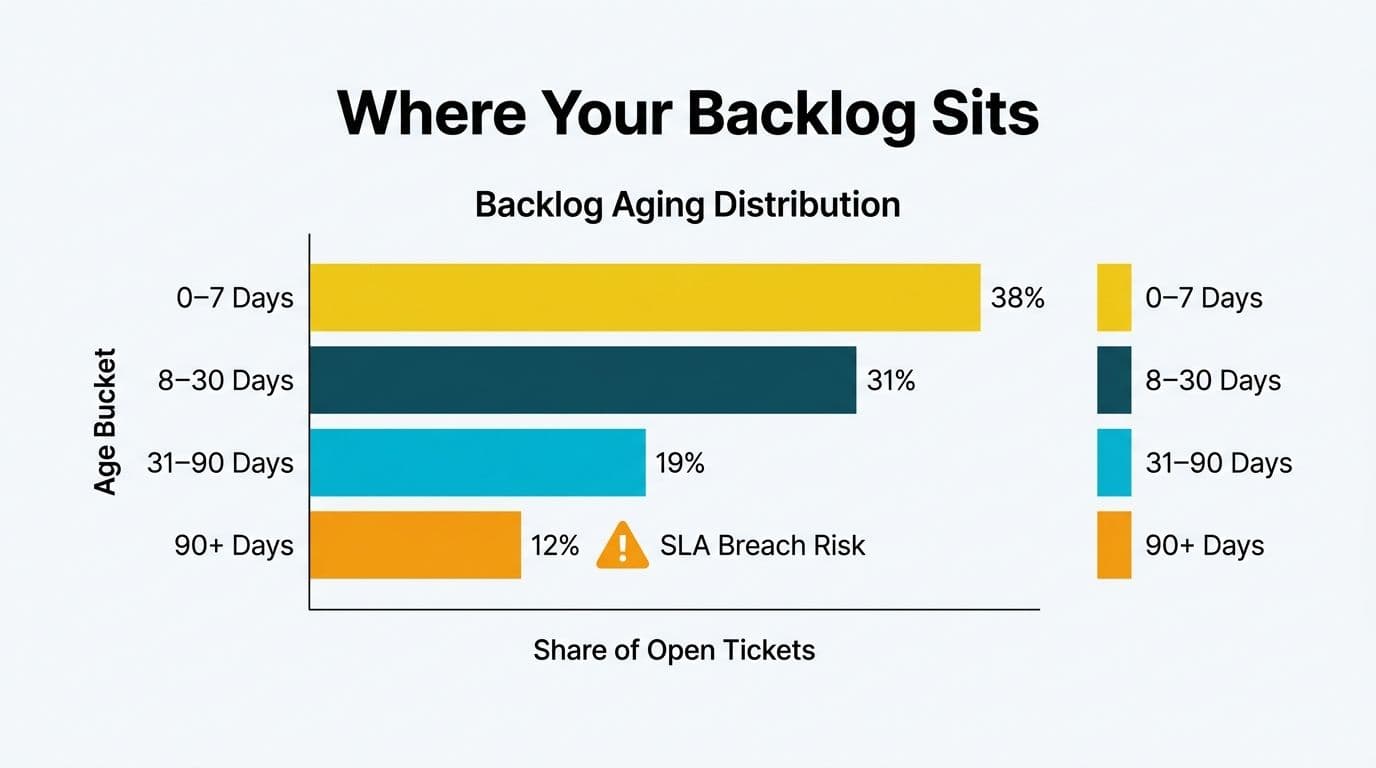
Backlog Aging answers the question that daily standups never fully resolve: how old are the unresolved tickets, and where is work accumulating? It distributes open incidents into age buckets and reveals whether the team resolves tickets faster than they arrive.
Start with a calculated column that captures current age for open incidents only:
```dax
Incident Age Days =
IF(
ISBLANK(Incidents[ResolvedAt]),
DATEDIFF(Incidents[OpenedAt], TODAY(), DAY),
BLANK()
)
```
Then classify into buckets:
```dax
Aging Bucket =
SWITCH(
TRUE(),
Incidents[Incident Age Days] <= 7, "0-7 Days",
Incidents[Incident Age Days] <= 30, "8-30 Days",
Incidents[Incident Age Days] <= 90, "31-90 Days",
"90+ Days"
)
```
Render this as a stacked bar chart grouped by Assignment Group with Aging Bucket as the color legend. The visual immediately surfaces which teams carry the oldest unresolved work - a pattern that predictably correlates with SLA drift and capacity gaps before either shows up in a compliance metric.
Suppose a US enterprise healthcare IT department runs this view and discovers that one assignment group holds 60 percent of the 90+ day backlog because those tickets require vendor coordination that sits outside the team's direct control. The visual makes the bottleneck visible in seconds and turns a vague operational concern into a scoped remediation conversation with a named owner.
Trend overlay: wrap the Aging Bucket measure in a CALCULATETABLE with a rolling 13-week date range to plot whether the 90+ day bucket is growing or shrinking over time. A consistently growing 90+ bucket is the leading indicator of an SLA breach wave - typically surfacing two to four weeks before the compliance rate begins to drop and giving operations leads an early warning window to act.
For the row-level security patterns that control which managers can see which assignment group's backlog data, Power BI Governance Best Practices: 12-Point Checklist covers the DAX-based RLS model that applies directly to ServiceNow-sourced datasets.
How Do Change and Problem Metrics Complete the ITSM Scorecard?
Incident metrics reveal symptoms. Problem and change metrics reveal whether the underlying system is actually improving.
Change Success Rate measures the proportion of closed change requests that completed without unplanned rollback, incident, or emergency rework. ServiceNow records the outcome in close_code on the change_request table. According to ServiceNow's platform documentation (2025), close_code uses three controlled values: "successful," "successful with issues," and "unsuccessful."
```dax
Change Success Rate =
DIVIDE(
COUNTROWS(
FILTER(
ChangeRequests,
ChangeRequests[State] = "Closed"
&& ChangeRequests[CloseCode] = "successful"
)
),
COUNTROWS(
FILTER(
ChangeRequests,
ChangeRequests[State] = "Closed"
)
),
0
)
```
Treat "successful with issues" as a distinct amber category rather than rolling it into clean successes - the distinction matters for change advisory boards that need a nuanced read. A UK financial services firm tracking this metric across monthly change windows will want "with issues" changes trending toward zero as a leading indicator of infrastructure stability under GDPR-relevant systems.
Problem Recurrence Rate measures how often resolved problems reopen or generate new linked incidents. A rising rate signals that root cause analysis is resolving symptoms rather than causes.
```dax
Problem Recurrence Rate =
DIVIDE(
COUNTROWS(
FILTER(
Problems,
Problems[ReopenCount] > 0
)
),
COUNTROWS(Problems),
0
)
```
Pair this with a drill-through table showing the problem record, the linked incidents, and the assignment group responsible. Recurring problems concentrated in a single infrastructure tier or a single team point directly to the process gaps that incident-only metrics would leave invisible for months.
What Does a Production ServiceNow Power BI Dashboard Include?
A production ITSM scorecard for mid-market organizations typically runs three pages with distinct audiences:
| Page | Primary Visuals | Primary Audience |
|---|---|---|
| Executive Summary | MTTR trend line, SLA compliance gauge, open backlog by priority | CIO, VP IT, Finance Director |
| Incident Operations | Aging bucket bar, incident volume by category, MTTR by assignment group | IT Operations Lead, Service Desk Manager |
| Change - Problem | Change success rate, failed change log, problem recurrence trend | Change Advisory Board, Risk Manager |
The Executive Summary page should refresh on a schedule - every four hours is typical for mid-market environments using the Power BI Table API connector in Import mode. For near-real-time requirements, route ServiceNow Event Management webhooks through Azure Event Hub into a Power BI streaming dataset. This delivers sub-minute latency but adds infrastructure overhead that most mid-market ITSM reporting programs do not need in the initial rollout.
Row-level security is not optional for any organization sharing this dashboard beyond the immediate IT operations team. A US healthcare IT department surfacing incident dashboards that contain description fields referencing patient system names must treat those dashboards as HIPAA-adjacent artifacts and restrict them accordingly. Map ServiceNow assignment groups and geographic regions to Power BI roles so a regional IT director sees only their geography's data - a control that satisfies both HIPAA and GDPR access-minimization requirements in a single configuration.
Teams without dedicated Power BI administrators often delegate refresh scheduling, RLS maintenance, and gateway management to a Managed Power BI services arrangement, freeing the internal team to focus on analysis rather than infrastructure upkeep.
---
About Lets Viz: Lets Viz has delivered data analytics and reporting solutions since 2020, serving US healthcare systems, UK fintech firms, Canadian manufacturing companies, and global SaaS organizations. Rated 5.0 on Clutch, the team specializes in Power BI, Tableau, and ServiceNow reporting engagements that reach production - not just proof of concept.
Ready to turn your ServiceNow data into a live operational scorecard? The ServiceNow + Power BI / Tableau consulting engagement starts with a scoped build of the five KPIs above and the data connections that keep them accurate.