Same Period Last Year Power BI DAX: SAMEPERIODLASTYEAR vs DATEADD
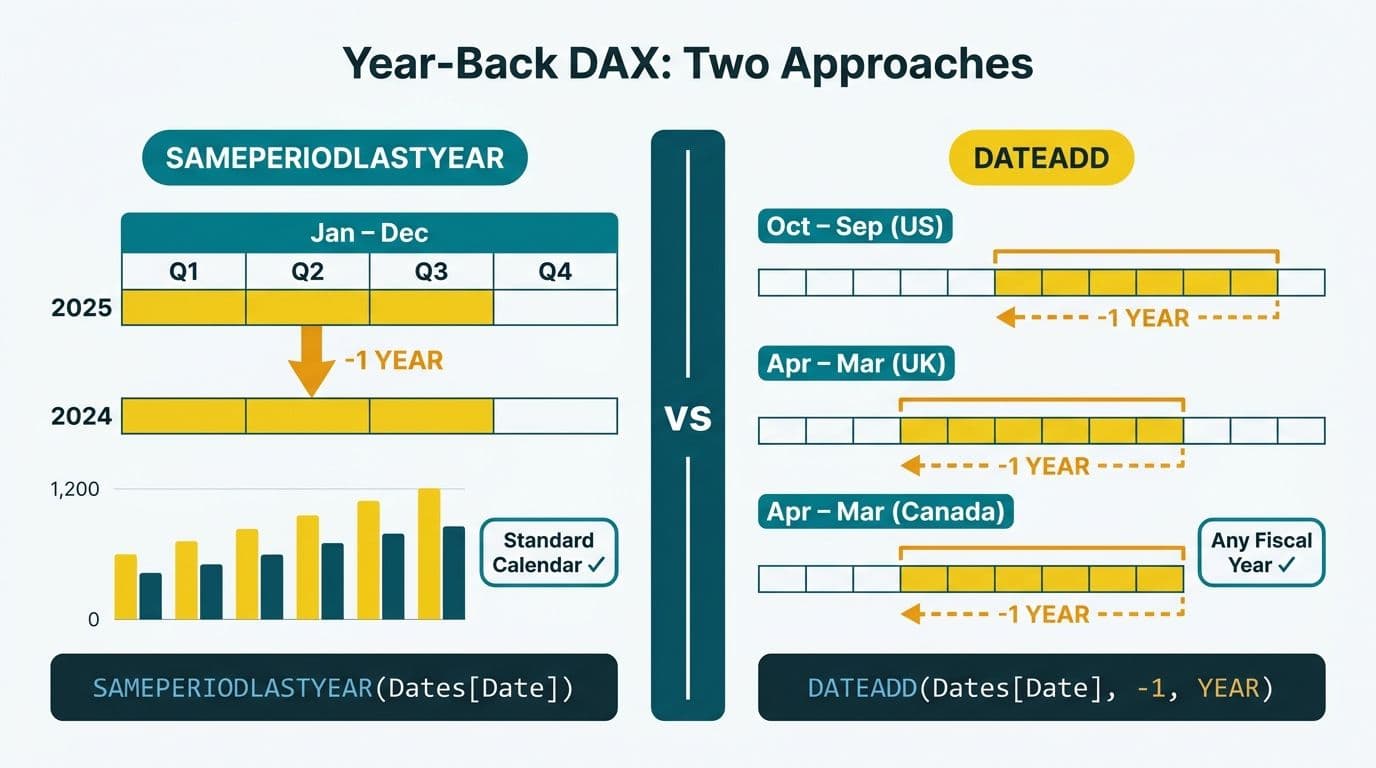
Power BI provides two DAX functions for the same period last year calculation: SAMEPERIODLASTYEAR and DATEADD with a -1 year offset. SAMEPERIODLASTYEAR is simpler and reliable for standard January-December calendars. DATEADD is the more portable choice for the non-standard fiscal year structures common at US healthcare systems (Oct-Sep), UK financial services firms (Apr-Mar), and Canadian federal agencies (Apr-Mar under the Financial Administration Act).
Key Takeaways
- SAMEPERIODLASTYEAR requires a contiguous date selection and fails with fiscal year slicers that pass labels instead of raw date values.
- DATEADD(-1, YEAR) shifts every date in the filter context back one year and works reliably across standard and fiscal calendars.
- A portable date table with fiscal year and fiscal quarter columns is the prerequisite for both functions to behave predictably.
- US healthcare (Oct-Sep), UK fintech (Apr-Mar), and Canadian federal (Apr-Mar) fiscal calendars all require the DATEADD pattern or a custom week-number filter.
- For 52/53-week fiscal calendars, neither built-in function works out of the box - use a fiscal week number FILTER expression instead.
What Is the Same Period Last Year Calculation in Power BI DAX?
The same period last year (SPLY) calculation returns the value of a measure for the identical time window in the prior year. If the current period filter contains April 2026, an SPLY measure returns the value for April 2025. Finance directors and revenue cycle managers use SPLY as the baseline for year-over-year variance analysis - typically more meaningful than month-over-month comparisons in seasonal industries like healthcare and financial services.
DAX offers two native functions for this purpose. SAMEPERIODLASTYEAR is purpose-built: it shifts the current filter context back by exactly one calendar year using the marked Date table. DATEADD is a general time-shift function that offsets dates by any interval - days, months, quarters, or years - and in either direction.
Both functions require a date table marked as a Date table in Power BI Desktop via Table tools > Mark as date table. Per Microsoft Power BI documentation (2025), the Date column must be contiguous, contain no duplicate values, and span the full range of calendar years present in the fact table. The architecture required by both functions - a properly marked date table and a structured semantic model - is part of the standard setup that Managed Power BI services teams implement across healthcare and finance organizations.
SAMEPERIODLASTYEAR: Syntax
```dax
Revenue LY =
CALCULATE(
[Total Revenue],
SAMEPERIODLASTYEAR('Date'[Date])
)
```
If the slicer contains March 2026, this returns [Total Revenue] for March 2025. Simple and readable - but only reliable when the filter contains a contiguous date range on a standard calendar year.
DATEADD: Syntax
```dax
Revenue LY =
CALCULATE(
[Total Revenue],
DATEADD('Date'[Date], -1, YEAR)
)
```
DATEADD shifts every date in the current filter context back by one year. It handles partial periods, non-contiguous date selections, and fiscal calendar date tables without returning blanks.
SAMEPERIODLASTYEAR vs DATEADD: Side-by-Side Comparison
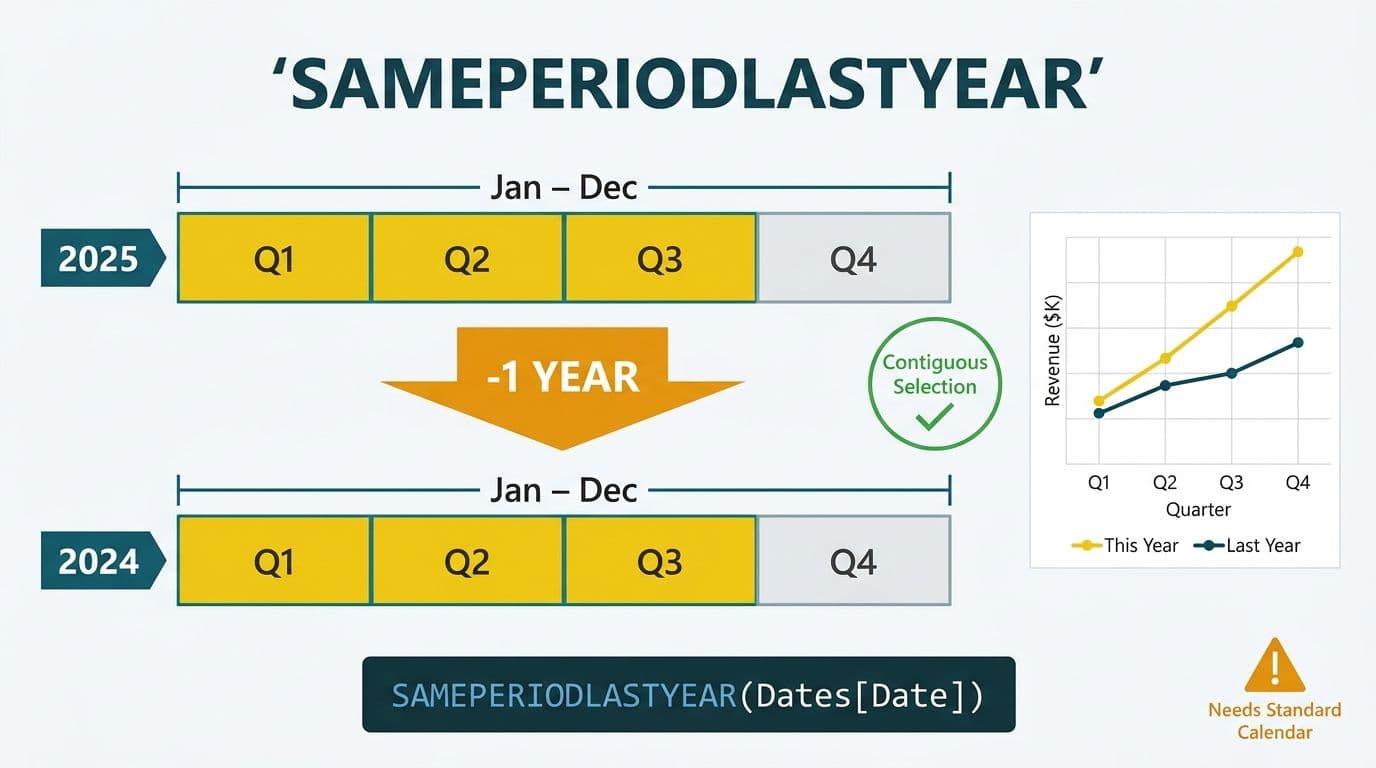
Choosing between the two functions comes down to calendar type, filter context behavior, and how report slicers pass values to the semantic model.
| Feature | SAMEPERIODLASTYEAR | DATEADD(-1, YEAR) |
|---|---|---|
| Standard Jan-Dec calendar | Yes | Yes |
| Non-standard fiscal year | No | Yes (with fiscal columns) |
| Non-contiguous date selection | Returns blank | Returns values |
| Fiscal year slicer (label-based) | Returns blank | Returns blank* |
| Partial period (month to date) | Handled automatically | Handled automatically |
| 52/53-week fiscal calendar | Not supported | Requires week-number filter |
| Syntax complexity | Low | Low-moderate |
| Compatible with TOTALYTD | Yes | Yes (with care) |
| Requires marked Date table | Yes | Yes |
*Both functions require the slicer to filter the Date column rather than a fiscal year label column. Use a VAR pattern or a TREATAS expression to pass fiscal year slicer selections through to Date column filtering.
PARALLELPERIOD: the third option to know. A related function often confused with DATEADD is PARALLELPERIOD, which returns a complete parallel period - a full month, quarter, or year - rather than the exact dates in the filter context. If the current filter contains April 1-15, 2026, DATEADD returns April 1-15, 2025, while PARALLELPERIOD returns all of April 2025. For month-to-date versus prior-year month-to-date comparisons common in healthcare revenue cycle dashboards, DATEADD is the correct choice because it preserves the partial-period boundary.
The practical difference surfaces most sharply in fiscal calendar environments. A US hospital network on an October-September fiscal year, a UK fintech firm on an April-March fiscal year, and a Canadian manufacturing company on a custom April-March fiscal year all face the same issue: fiscal quarter slicers pass label values rather than raw dates, and SAMEPERIODLASTYEAR returns blank. DATEADD combined with a VAR pattern resolves this.
How Do You Build a Portable Date Table for Fiscal Calendars?
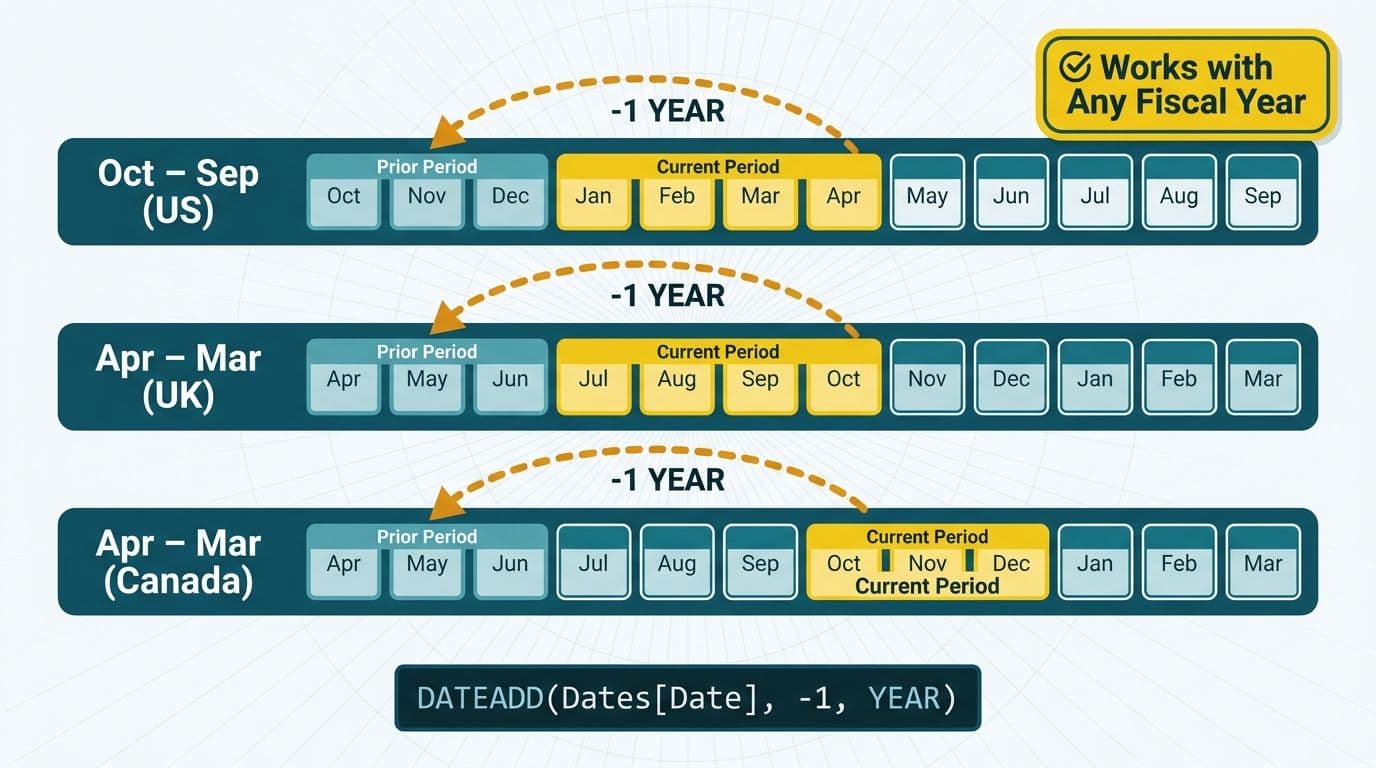
A portable date table accommodates multiple fiscal year definitions without rewriting measures for each business unit. The core design principle is adding fiscal columns to the date table rather than encoding fiscal offsets inside individual DAX measures - a mistake that leads to brittle measure libraries.
The following DAX calculated columns support three fiscal calendar types simultaneously:
```dax
// US fiscal year: October 1 start
FiscalYear US =
IF(
MONTH('Date'[Date]) >= 10,
YEAR('Date'[Date]) + 1,
YEAR('Date'[Date])
)
// UK and Canada fiscal year: April 1 start
FiscalYear UK CA =
IF(
MONTH('Date'[Date]) >= 4,
YEAR('Date'[Date]) + 1,
YEAR('Date'[Date])
)
// US fiscal quarter number (Oct = Q1, Jan = Q2, Apr = Q3, Jul = Q4)
FiscalQuarterNumber US =
SWITCH(
TRUE(),
MONTH('Date'[Date]) >= 10, 1,
MONTH('Date'[Date]) >= 7, 4,
MONTH('Date'[Date]) >= 4, 3,
2
)
```
Once these columns exist, a single DATEADD measure works correctly for all fiscal calendar types because the time shift operates on the underlying Date column, and fiscal year columns automatically map shifted dates to the correct fiscal period labels.
```dax
Revenue LY (Fiscal) =
CALCULATE(
[Total Revenue],
DATEADD('Date'[Date], -1, YEAR)
)
```
For teams managing multiple business units with different fiscal calendars - common in healthcare holding companies and multi-entity financial services groups - a fiscal start month parameter (a What-If parameter or configuration table) eliminates the need for separate date tables per entity.
Mark the date table after adding fiscal columns: Table tools > Mark as date table > select the Date column. Both SAMEPERIODLASTYEAR and DATEADD will silently fail if this step is skipped.
See Power BI Governance Best Practices: 12-Point Checklist for a framework on standardizing date table conventions across an enterprise Power BI tenant.
Handling 52/53-Week Fiscal Calendars
Some US healthcare systems and retailers operate on a 52/53-week fiscal calendar - structured as 4-4-5, 4-5-4, or 5-4-4 period layouts - where the fiscal year ends on a specific weekday rather than a fixed calendar date. Neither SAMEPERIODLASTYEAR nor DATEADD handles this natively. The correct approach is a fiscal week number column combined with an explicit FILTER expression:
```dax
Revenue LY (52-Week Fiscal) =
CALCULATE(
[Total Revenue],
FILTER(
ALL('Date'),
'Date'[FiscalWeekNumber] IN VALUES('Date'[FiscalWeekNumber])
&& 'Date'[FiscalYear] = MAX('Date'[FiscalYear]) - 1
)
)
```
This returns revenue for the same fiscal week numbers in the prior fiscal year, regardless of whether that year contained 52 or 53 weeks.
Why Does SAMEPERIODLASTYEAR Return Blank for Fiscal Calendars?
SAMEPERIODLASTYEAR returns blank in three scenarios: when the filter context contains non-contiguous dates, when no data exists in the prior-year period, or when a fiscal year slicer passes a text label rather than raw Date column values.
The third scenario is the most common source of confusion. When a fiscal year slicer filters the FiscalYear US column rather than the Date column, SAMEPERIODLASTYEAR receives no Date values to shift and returns blank. DATEADD alone has the same limitation in this configuration.
The reliable fix is to capture current dates in a VAR before the filter change is applied:
```dax
Revenue LY Safe =
VAR CurrentDates = VALUES('Date'[Date])
RETURN
CALCULATE(
[Total Revenue],
DATEADD(CurrentDates, -1, YEAR)
)
```
For an approach that targets fiscal year labels directly:
```dax
Revenue LY Fiscal Safe =
VAR SelectedFY = SELECTEDVALUE('Date'[FiscalYear US])
VAR PriorYearDates =
FILTER(
ALL('Date'),
'Date'[FiscalYear US] = SelectedFY - 1
)
RETURN
CALCULATE([Total Revenue], PriorYearDates)
```
This pattern is explicit, predictable, and survives report redesigns that change which columns slicers filter on - a common occurrence in long-lived enterprise dashboards used by finance teams at mid-market healthcare and financial services organizations.
How Do Healthcare and Finance Teams Apply SPLY DAX in Practice?
The same period last year calculation in Power BI DAX appears in three core reporting contexts: revenue variance dashboards, budget vs. actuals tracking, and regulatory period comparisons.
US healthcare - revenue cycle reporting: A US hospital system on an October-September fiscal year reports net patient revenue and payer mix by fiscal quarter. HIPAA-compliant Power BI deployments route fact data through a semantic model where the date table carries both calendar and fiscal columns, with row-level security controlling access by cost center and service line. Finance teams use the DATEADD pattern because it survives fiscal year slicer filters without returning blanks. Power BI Healthcare Reporting: Implementation Cost Guide covers the broader architecture for revenue cycle reporting.
UK fintech - FCA regulatory comparisons: A UK fintech firm preparing Financial Conduct Authority (FCA) comparative disclosures on an April-March fiscal year uses DATEADD to compare current-period net interest margin against the prior-year equivalent period. GDPR requirements mean the dataset contains aggregated rather than row-level personal data, but the DAX pattern is identical. SAMEPERIODLASTYEAR would fail as soon as an analyst selects a fiscal quarter label from a slicer.
Canadian federal finance - PIPEDA-compliant dashboards: Canadian federal departments on the Government of Canada fiscal year (April 1 to March 31) face the same fiscal slicer problem. Teams subject to PIPEDA build row-level security into the semantic model to control access by department and cost center, and use DATEADD for all SPLY measures. The portable date table with FiscalYear UK CA columns serves this environment without modification.
For organizations that want a consistent SPLY approach across all three fiscal calendar types, Power BI Managed Service for Finance Teams: What to Expect explains how a managed semantic model layer scales this across a multi-entity organization.
What YOY Variance Measures Should You Build Alongside SPLY?
The SPLY base measure unlocks two derived measures that complete a standard year-over-year reporting set.
```dax
// Absolute year-over-year variance
Revenue YOY Variance =
[Total Revenue] - [Revenue LY]
// Percentage year-over-year variance
Revenue YOY % =
DIVIDE(
[Total Revenue] - [Revenue LY],
[Revenue LY],
0
)
```
Use DIVIDE rather than the division operator to handle division-by-zero gracefully when prior-year data is absent - a frequent scenario at the start of a new fiscal year or when a service line launched mid-year.
Format the YOY % measure as a percentage in field properties and apply a conditional format rule to color positive variance green and negative variance red. Paired with a KPI card and a waterfall chart, these three measures give a CFO a complete year-over-year summary on a single report page without custom visuals.
When the SPLY measure feeds a fiscal-year-to-date running total, nest DATEADD inside DATESYTD with the optional year-end-date argument rather than combining SAMEPERIODLASTYEAR with TOTALYTD:
```dax
Revenue FYTD LY =
CALCULATE(
[Total Revenue],
DATEADD(
DATESYTD('Date'[Date], "9/30"),
-1,
YEAR
)
)
```
This returns fiscal-year-to-date revenue for the same period in the prior fiscal year, anchored to a September 30 fiscal year end - a common requirement at US healthcare and government organizations.
For finance and accounting teams building end-to-end Power BI environments, Power BI for Accounting and Finance Firms covers the broader architecture.
---
About Lets Viz: Lets Viz has designed and maintained Power BI semantic models for US healthcare systems, UK fintech firms, Canadian manufacturing organizations, and global SaaS companies since 2020, holding a 5.0 rating on Clutch. The team builds fiscal-calendar date tables, time-intelligence measure libraries, and audit-ready data models for mid-market finance and data operations teams across North America, the UK, and EU.
If your organization is rewriting SPLY measures every time a fiscal calendar or reporting period changes, Managed Power BI services from Lets Viz delivers a governed, maintained semantic model layer - so your finance team gets consistent year-over-year numbers without DAX archaeology every quarter.