Rule of 40 SaaS Benchmark: Formula, Stages & Power BI DAX
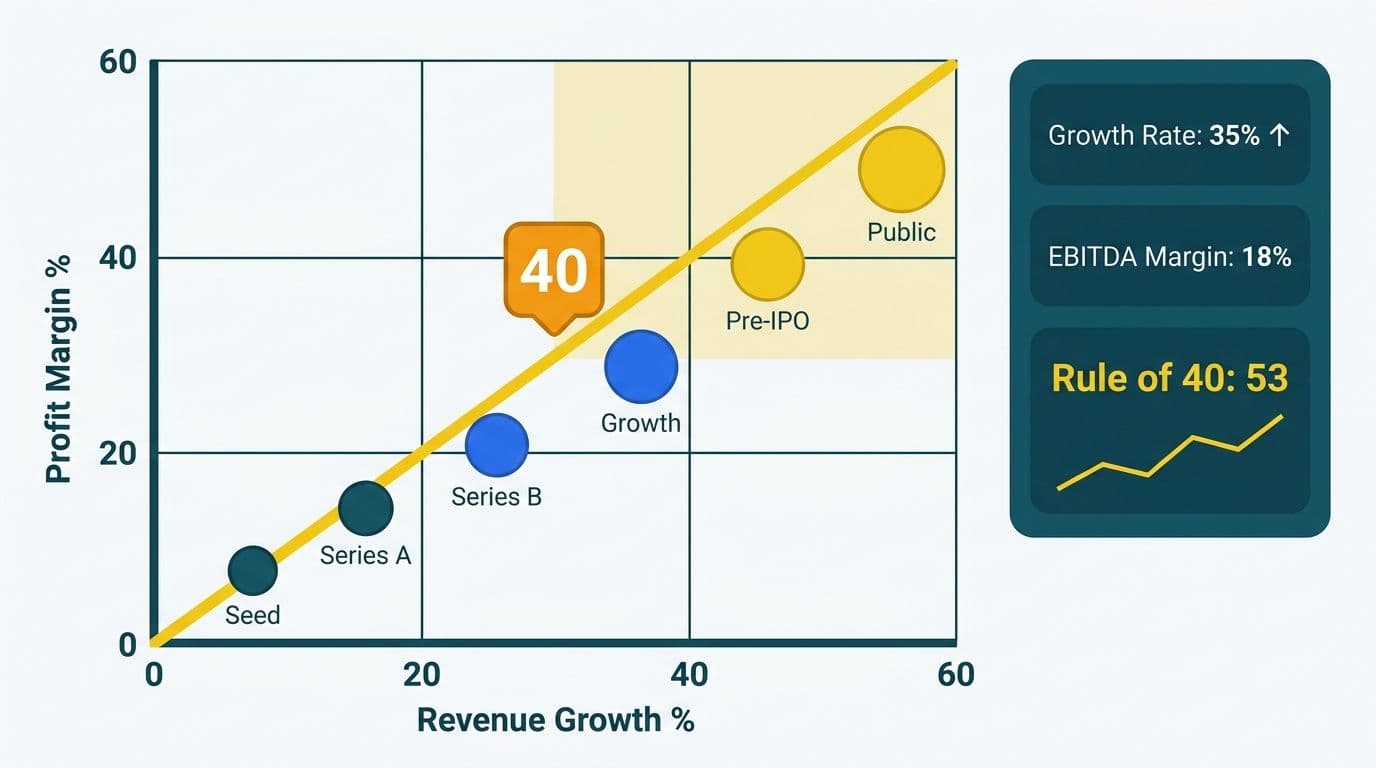
The Rule of 40 is a SaaS health metric that combines a company's year-over-year revenue growth rate with its profit margin percentage. A combined score of 40 or above signals a well-balanced, investor-grade business; scores above 60 are considered exceptional. For CFOs and FP&A teams, it is the single most tracked board-level KPI for SaaS operational efficiency, replacing the earlier fixation on growth-at-any-cost as a standalone measure.
Key Takeaways
The Rule of 40 formula is: Revenue Growth Rate (%) + Profit Margin (%) >= 40
Benchmarks shift by funding stage - seed-stage companies can sustain -50% EBITDA margins if growing above 100%; Series C companies are expected to approach breakeven
US public SaaS companies cluster at a median Rule of 40 of 38-42; UK SaaS companies typically run 5-8 points lower due to regulatory overhead and smaller domestic markets
A single DAX measure in Power BI can automate Rule of 40 tracking across any reporting period using DATESINPERIOD and DATEADD functions
FCF margin is increasingly preferred over EBITDA for late-stage and public-market Rule of 40 calculations, compressing scores by 8-12 points on average
What Is the Rule of 40 SaaS Benchmark, and Where Did It Come From?
The Rule of 40 originated in venture capital circles as a quick diagnostic for SaaS business health. Its premise is simple: a SaaS company should deliver combined revenue growth and profitability that sums to at least 40 percentage points. Sacrificing margin to fund growth is acceptable - but only up to the point where the growth rate offsets the loss.
The formula:
Rule of 40 Score = Revenue Growth Rate (YoY %) + Profit Margin (%)
The metric gained board-level adoption during the 2021-2023 rate cycle, when rising interest rates shifted investor preference from pure growth toward efficient growth. By 2026 it has become a standard line item in Series B and later investor updates across the US, UK, and Canadian markets.
According to the OpenView Partners 2026 SaaS Benchmarks Report, the median Rule of 40 score for private SaaS companies with $10M-$50M ARR is approximately 33 - below the 40 threshold, reflecting that most growth-stage businesses remain loss-making as they invest in sales capacity and product development. Public SaaS companies in the same period showed a median score of 39, with the top quartile exceeding 57.
For finance teams building automated board packs, Power BI for SaaS finance teams provides the infrastructure to track this metric live against any date slicer - eliminating the manual spreadsheet recalculation that delays most quarter-end reporting cycles.
How Do You Calculate the Rule of 40? (Formula Variants and Common Pitfalls)
The Rule of 40 formula is straightforward, but the choice of inputs generates significant variation in reported scores. Finance leaders and investors must align on the same variant before using the metric as a valuation anchor.
The three most common variants:
| Variant | Growth Input | Margin Input | Best Used For |
|---|---|---|---|
| Venture-standard | YoY ARR growth % | EBITDA margin % | Private SaaS, seed to Series B |
| Public-market standard | YoY revenue growth % | FCF margin % | Listed SaaS companies |
| Blended (board-preferred) | YoY ARR growth % | Operating income margin % | Series C and late-stage pre-IPO |
Common pitfalls in Rule of 40 calculation:
Using MRR growth instead of ARR growth overstates the growth rate for businesses with significant seasonal churn or annual contract upsells
Excluding stock-based compensation from EBITDA inflates the margin component; public market investors add SBC back when calculating the FCF-based variant
Mixing LTM and quarterly time windows for the two inputs distorts the combined score - always use the same period for both the growth rate and the margin calculation
Inconsistent revenue recognition creates cross-regional distortion - UK and EU companies reporting under IFRS 15 often recognize subscription revenue differently than US GAAP counterparts, which can compress the growth rate component in early periods
A US SaaS finance team at a Series B company growing at 65% YoY ARR but running at -30% EBITDA margin posts a Rule of 40 score of 35. At that stage, a score between 30 and 40 is fundable, but it signals the need for a credible path to margin improvement within 18-24 months before the next raise.
What Are the Stage-by-Stage Rule of 40 Benchmarks for SaaS Companies?
Applying a single 40-point threshold to every stage misreads the metric. Investors calibrate expectations against ARR base, market type, and capital availability. The benchmarks below reflect consensus ranges used by leading SaaS investors as of 2026:
| Stage | ARR Range | Median R40 Score | Growth Rate Expectation | Margin Expectation |
|---|---|---|---|---|
| Seed / Pre-Seed | Less than $1M | Not typically tracked | Over 100% (MoM basis) | -50% to -80% EBITDA |
| Series A | $1M - $5M ARR | 25-35 | 80-120% YoY | -30% to -50% EBITDA |
| Series B | $5M - $20M ARR | 30-45 | 60-80% YoY | -20% to -30% EBITDA |
| Series C | $20M - $50M ARR | 40-55 | 40-60% YoY | -5% to +10% EBITDA |
| Growth / Pre-IPO | $50M+ ARR | 45-65 | 25-40% YoY | +10% to +25% FCF |
| Public (top quartile) | Over $200M ARR | 55+ | 15-25% YoY | +25%+ FCF |
A UK fintech SaaS firm at Series B with £8M ARR growing at 75% YoY but running at -40% EBITDA margin posts a Rule of 40 score of 35 - below the stage median but still within the fundable range. UK investors familiar with GDPR compliance overhead and FCA reporting requirements often apply a 3-5 point normalization adjustment to like-for-like comparisons with US companies at the same ARR base.
According to KeyBanc Capital Markets' 2026 Private SaaS Survey, companies that crossed the Rule of 40 threshold at Series B raised their subsequent round at a median 2.1x higher revenue multiple than peers that remained below it. This makes the Rule of 40 directly material to valuation negotiations, not just internal board reporting.
How Does the Rule of 40 Benchmark Differ by Region?
The Rule of 40 is a globally applied standard, but regional market conditions create material variance in what a strong score looks like at a given stage.
United States: US SaaS companies benefit from the world's deepest venture markets and the largest English-language software TAM. The US median Rule of 40 for Series C-stage companies in 2026 sits at approximately 46-52, according to Bessemer Venture Partners' State of the Cloud 2026 report — up slightly from prior years as AI-driven margin expansion lifts profitability across the cohort. SOC 2 Type II compliance is table stakes and is treated as a standard operating cost rather than a margin drag. US boards typically adopt the FCF-based Rule of 40 from Series C onward.
United Kingdom and EU: UK SaaS companies face a structurally smaller domestic addressable market, higher regulatory overhead under GDPR and the UK Financial Conduct Authority, and tighter growth-stage venture capital availability relative to the US. The UK and broader EU median Rule of 40 at Series B is closer to 28-34. EU companies preparing for a Euronext or London Stock Exchange listing often shift from EBITDA to FCF margin earlier than US counterparts, as European institutional investors are more accustomed to FCF-based valuation frameworks.
Canada: Canadian SaaS companies, particularly in the Toronto-Waterloo corridor and Vancouver, often benchmark comparably to US companies at seed and Series A stages due to significant cross-border US VC participation. PIPEDA compliance costs are modest relative to GDPR, so data-regulation-driven margin drag is limited. The Canadian median Rule of 40 at Series C sits at approximately 42-48, slightly above the UK equivalent, according to MaRS Discovery District's 2026 Canadian Tech Report. Export-oriented Canadian SaaS companies selling primarily into the US market are frequently valued on US comparable multiples by their institutional investors.
For FP&A teams managing multi-entity reporting across these geographies, the FP&A Dashboard in Power BI build guide covers currency normalization and entity-level segmentation - both essential inputs to a cross-regional Rule of 40 dashboard.
How Do You Track the Rule of 40 Live in Power BI? (DAX Snippet)
Automating the Rule of 40 in Power BI removes the manual spreadsheet recalculation that delays board reporting at quarter-end. The following DAX measure calculates the score dynamically against any date slicer, using ARR and EBITDA tables with a standard date dimension:
```dax
Rule of 40 Score =
VAR LastDate = LASTDATE( 'Date'[Date] )
VAR CurrentWindow =
DATESINPERIOD( 'Date'[Date], LastDate, -12, MONTH )
VAR ARR_Current =
CALCULATE( [Total ARR], CurrentWindow )
VAR ARR_Prior =
CALCULATE(
[Total ARR],
DATEADD( CurrentWindow, -12, MONTH )
)
VAR GrowthRate =
DIVIDE( ARR_Current - ARR_Prior, ARR_Prior, 0 ) * 100
VAR EBITDAMargin =
DIVIDE( [EBITDA LTM], ARR_Current, 0 ) * 100
RETURN
GrowthRate + EBITDAMargin
```
How this measure works:
`ARR_Current` aggregates trailing 12-month ARR using `DATESINPERIOD`, making the result responsive to any date filter applied by a slicer or page-level filter
`ARR_Prior` uses `DATEADD` to shift the same 12-month window back by one year, producing a clean like-for-like YoY comparison without hard-coded date logic
`EBITDAMargin` divides trailing EBITDA against current-period ARR - the convention most SaaS boards use rather than blended revenue
The final `RETURN` line sums both components to produce the live Rule of 40 score
To add a RAG (red/amber/green) status flag alongside the score, add this companion measure:
```dax
Rule of 40 Status =
VAR Score = [Rule of 40 Score]
RETURN
SWITCH(
TRUE(),
Score >= 60, "Exceptional",
Score >= 40, "Healthy",
Score >= 25, "Watch",
"At Risk"
)
```
If your ARR table and EBITDA table are connected through multiple relationship paths - for example, when both share a date dimension through an ambiguous join - you may need the DAX `CROSSFILTER` function to control which relationship direction the calculation follows. The `CROSSFILTER` function overrides the default relationship filter direction inside a specific measure without altering the model-level setting, which is the recommended pattern for multi-fact financial models where a single date table drives several fact tables simultaneously.
For deeper DAX filter context patterns used in financial reporting, see the ALLSELECTED DAX Function in Power BI explainer and the DAX SUMMARIZE vs SUMMARIZECOLUMNS guide for aggregation patterns used in SaaS finance models.
When Should You Use FCF Margin Instead of EBITDA in the Rule of 40?
The choice between EBITDA margin and FCF margin materially changes both the Rule of 40 score and the narrative it supports. The two are not interchangeable, and mixing them across board cycles creates comparability problems.
Use EBITDA margin when:
The company is pre-IPO with limited public market comparables
Stock-based compensation represents less than 10% of revenue
The board has aligned on EBITDA as the primary internal profitability target
Use FCF margin when:
The company is preparing for an IPO or secondary listing on any exchange
SBC exceeds 10% of revenue - common for engineering-heavy SaaS businesses
The company carries material infrastructure capex such as owned data centers or hardware
According to Bessemer Venture Partners' State of the Cloud 2026, public SaaS companies show a median 8-12 point score compression when their Rule of 40 is recalculated using FCF margin instead of EBITDA. This compression is most pronounced for AI-native SaaS firms carrying heavy GPU infrastructure costs, where capex intensity can widen the EBITDA-to-FCF gap by an additional 5-8 points relative to traditional software businesses. This makes the FCF-based Rule of 40 structurally harder to achieve and is the more conservative, investor-preferred measure for late-stage and public companies.
A Canadian SaaS company listing on the TSX Venture Exchange, or a UK fintech firm approaching a London AIM listing, should align on FCF-based Rule of 40 before the prospectus stage to avoid investor expectation mismatches during roadshow. This is also the moment to confirm that PIPEDA or GDPR compliance costs are correctly classified in the FCF bridge so they do not surprise institutional investors unfamiliar with the regulatory overhead.
What SaaS Metrics Complement the Rule of 40 for Board Reporting?
The Rule of 40 is a summary metric that signals health but does not diagnose root causes. Finance leaders working on SaaS metrics for board reporting typically present it alongside a supporting framework to give the board diagnostic depth behind the headline score.
| Metric | What It Adds | Reporting Cadence |
|---|---|---|
| Net Revenue Retention (NRR) | Expansion efficiency and churn signal | Quarterly |
| CAC Payback Period | Sales efficiency benchmark | Quarterly |
| Gross Margin % | Unit economics baseline | Monthly |
| ARR per FTE | Operational leverage indicator | Quarterly |
| Rule of 40 Score | Combined growth-efficiency summary | Monthly |
The Rule of 40 typically anchors the executive summary slide of a board deck. A declining score driven by margin erosion tells a different story from one driven by a growth slowdown - and NRR plus gross margin data reveal which lever is causing the movement. Without the supporting metrics, a Rule of 40 score improvement can mask deteriorating unit economics hidden inside a short-term ARR expansion wave.
The Best AI Tools for Finance Professionals guide covers how AI-assisted FP&A tools are increasingly used to automate variance commentary alongside these board metrics, reducing the manual narrative-writing burden on finance teams at month-end close.
---
About Lets Viz: Lets Viz has delivered analytics and Power BI implementations for SaaS, US healthcare, UK fintech, and Canadian manufacturing organizations since 2020, maintaining a 5.0 rating on Clutch. Our FP&A and SaaS finance specialists build investor-grade Power BI models that automate board-level KPIs including Rule of 40 scoring, NRR waterfall charts, and ARR cohort analysis - giving CFOs and finance directors live board-ready reporting without spreadsheet overhead.
Ready to automate your Rule of 40 and SaaS board metrics in Power BI? Explore Power BI for SaaS finance teams to see how our team builds live SaaS finance dashboards for CFOs and FP&A leaders across the US, UK, and Canada.