Power Automate vs Power BI: Key Differences Explained
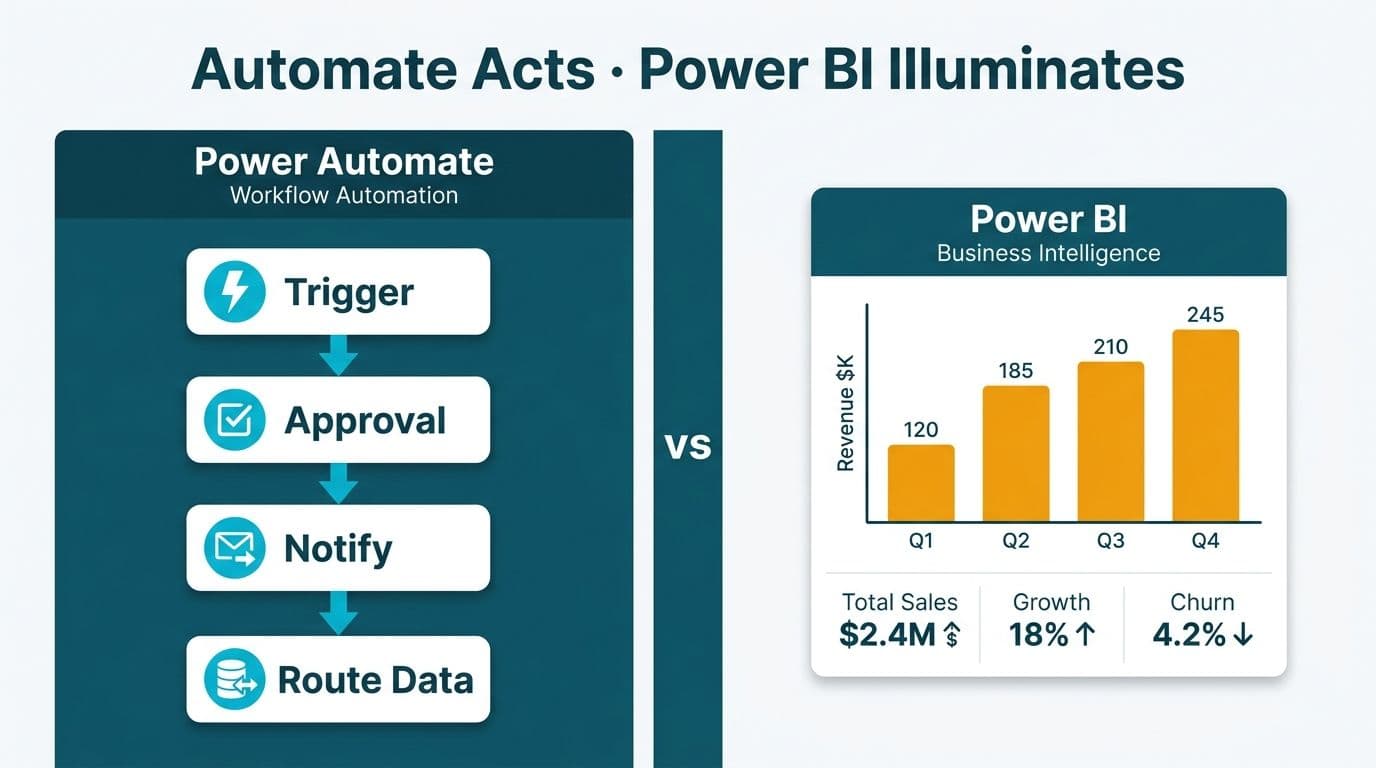
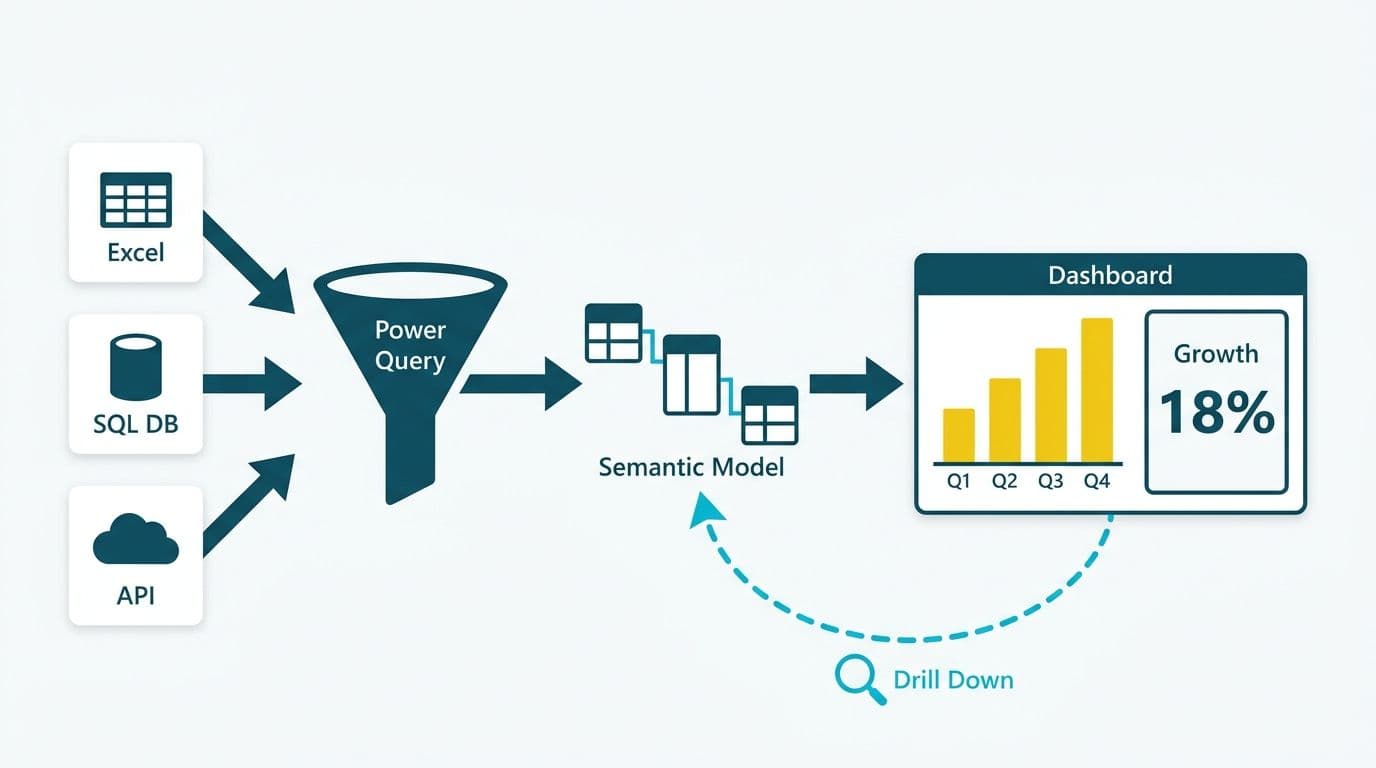
Power Automate is Microsoft's workflow automation platform - it moves data between systems, fires notifications, and executes multi-step processes on triggers or schedules. Power BI is Microsoft's business intelligence platform - it ingests data, builds semantic models, and delivers interactive dashboards and reports. The distinction is directional: Automate acts on data; Power BI illuminates it. Most operations and finance teams need both.
Key Takeaways
- Power Automate triggers actions - approvals, notifications, and data routing - across more than 900 connectors.
- Power BI answers questions through dashboards and reports: what happened, why, and what to expect next.
- Licensing is separate: Power BI Pro costs $10/user/month and Power Automate Premium costs $15/user/month as of 2026 (Microsoft licensing documentation).
- The tools integrate natively: Power BI data alerts can fire Automate flows, and Automate can refresh Power BI semantic models on demand.
- In regulated industries - US healthcare (HIPAA), UK and EU (GDPR), and Canada (PIPEDA) - compliance depends on how data is stored and processed, not simply which Microsoft tool handles it.
What Is the Power Automate vs Power BI Difference?
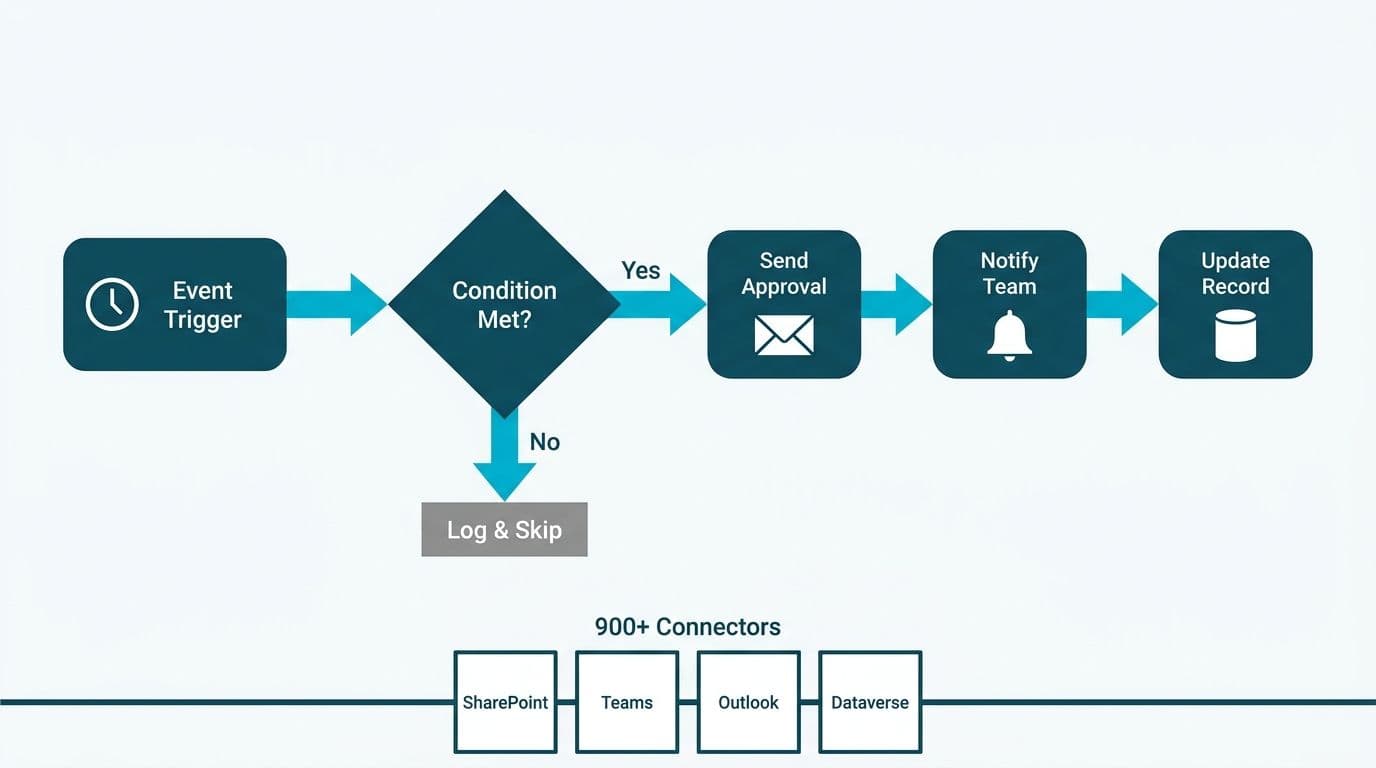
Think of your organisation's data as water moving through a system of pipes. Power Automate is the valve network - it decides when water flows, where it goes, and what downstream action occurs when a threshold is crossed. Power BI is the monitoring panel - it reads the pressure, visualizes flow rates across the entire system, and surfaces alerts when a metric drifts out of tolerance.
A practical sequence illustrates how these tools interact: a purchase order arrives by email. Power Automate extracts the line items, posts them to the ERP, and routes an approval request to the finance manager - all without anyone touching a keyboard. Once the transaction posts and lands in the data warehouse, Power BI picks it up: the spend-by-vendor chart updates, a variance flag fires, and the CFO's dashboard reflects the change before the morning standup.
Neither tool replaces the other. Automate without Power BI gives you invisible efficiency - work happens, but leadership cannot see the aggregate picture. Power BI without Automate gives you clear data that nobody acted on in time.
The architectural distinction matters: Power Automate is event-driven and transactional, processing records one at a time in near real-time. Power BI is query-driven and analytical, aggregating millions of records into coherent summaries. This is why using Power BI as a pipeline or ETL tool almost always creates friction - it is a reporting layer, not a movement layer.
Before scoping any Microsoft platform initiative, use the Instant project cost calculator to model whether the engagement is primarily automation, analytics, or a combined build - the tool mix significantly affects implementation cost and timeline.
When Should You Use Power Automate Instead of Power BI?
Use Power Automate when the goal is to eliminate a manual step, enforce a business rule, or trigger a downstream action. The four most common operational patterns:
- Approval workflows - route purchase orders, expense claims, or contract sign-offs through a defined chain with a complete audit trail.
- Data entry elimination - parse emails, web forms, or EDI files and write records directly into Dynamics 365, SharePoint, or a legacy ERP.
- Cross-system synchronisation - keep CRM and finance records aligned when a deal closes, a customer changes status, or an invoice is raised.
- Alert-to-action - a Power BI dashboard threshold fires; Automate immediately messages the operations lead on Teams and logs an incident ticket in the service management platform.
Use Power BI when the goal is to answer a question or track a trend over time:
- Management reporting - consolidated P&L, sales pipeline coverage, or headcount by department, refreshed on a defined schedule.
- Operational dashboards - throughput, cycle time, or SLA compliance for team leads who need a live performance view.
- Ad hoc analysis - a finance lead questions the Q3 margin figure; an analyst drills from total company to product line to SKU in minutes without waiting for IT.
- Regulatory reporting - structured tabular output that must be auditable and defensible across reporting periods.
A working heuristic for operations managers: if the next step is a human decision or a system write, reach for Automate. If the next step is a number you need to understand in context, reach for Power BI.
How Do Power Automate and Power BI Licensing Compare in 2026?
Licensing is where many organisations misstep. Both products share the Microsoft identity but carry entirely separate license tiers.
| Feature | Power BI Pro | Power BI Premium Per User | Power Automate (M365 seeded) | Power Automate Premium |
|---|---|---|---|---|
| **List price** | $10/user/month | $20/user/month | Included in most M365 plans | $15/user/month |
| **Core capability** | Share and collaborate on reports | All Pro features plus AI visuals and larger model size | Basic flows, standard connectors only | Premium connectors, unlimited flow runs, RPA |
| **Report consumers** | Must hold a Pro licence | Must hold a PPU licence | N/A | N/A |
| **Premium connectors** | N/A | N/A | Not included | Included (SAP, Salesforce, ServiceNow, and others) |
| **Unattended RPA** | N/A | N/A | Not available | Power Automate Process add-on ($150/bot/month) |
| **Dataset size limit** | 1 GB per dataset (shared capacity) | 100 GB per dataset | N/A | N/A |
*(Source: Microsoft licensing documentation, 2026)*
Three licence traps that operations and finance leaders encounter regularly:
1. The consumer tax: every person who views a shared Power BI report must hold at least a Pro licence. A 200-seat finance department viewing a single shared dashboard requires 200 licences - not one author licence and 199 free viewers.
2. The connector wall: the Automate flows bundled inside Microsoft 365 cover only standard connectors. Connecting to SAP, Salesforce, or a bespoke ERP requires the $15/user/month Premium plan.
3. The Fabric boundary: Microsoft Fabric has its own capacity licensing that supersedes per-user plans at scale. If your organisation is moving toward a lakehouse architecture, revisit the per-user model before committing to either product's standalone tier.
For a detailed breakdown of Power BI's AI-layer costs, the Power BI Copilot licensing guide covers the Copilot add-on requirements and when Premium Per User becomes unavoidable.
How Does Each Tool Handle Regulated Data - HIPAA, GDPR, and PIPEDA?
Both Power Automate and Power BI operate within Microsoft's commercial cloud and inherit the platform's compliance certifications - including HIPAA Business Associate Agreement (BAA) coverage, ISO 27001, and SOC 2 Type II (Microsoft Trust Center, 2026). Certification is not the same as configuration. Regulated organisations must still configure each tool correctly.
When building a healthcare analytics platform evaluation checklist, these are the Power BI controls that matter most:
US healthcare - HIPAA: Power BI supports row-level security (RLS) to restrict which users access which patient cohorts. A hospital analytics team can publish an ED throughput dashboard across the organisation while ensuring that PHI-level detail is visible only to credentialed clinicians. Power BI EHR integration for healthcare analytics typically routes through Azure Data Factory or Microsoft Fabric pipelines rather than direct connector, keeping PHI inside the Microsoft trust boundary. Power BI row-level security and HIPAA PHI data protection must be validated together during implementation - RLS scope, sensitivity labels in Microsoft Purview, and dataset refresh permissions form one interconnected control layer, not three separate ones.
Power Automate introduces specific risk in this context: flows that extract PHI and route it through third-party connectors may cross the BAA boundary. Any connector outside Microsoft's listed covered services must be individually evaluated before use in a HIPAA-regulated workflow. For a deeper treatment of automation architecture in healthcare settings, the n8n HIPAA compliant workflow automation guide covers the same architectural decisions that apply when evaluating any automation platform in a regulated environment.
UK and EU - GDPR: Both tools require a lawful basis for processing personal data and must support subject access and erasure requests. Power BI reports containing personal data should be scoped with RLS and Microsoft Purview sensitivity labels, which classify data and track lineage automatically. A UK fintech firm routing customer transaction data through Automate into Power BI dashboards must ensure that no personal data transits connectors outside the EEA without Standard Contractual Clauses or equivalent safeguards.
Canada - PIPEDA and Law 25: Canadian organisations should confirm that Azure data residency is set to Canada East or Canada Central, because both Power BI datasets and Automate flow logs default to the tenant's home region. A Canadian manufacturing company routing shop-floor OEE data through Power Automate into Power BI dashboards should verify region pinning before go-live - PIPEDA's accountability principle makes the data controller responsible for where data sits, not only how it is used.
For healthcare-specific Power BI architecture and control configuration, see HIPAA compliant BI tools for hospital data visualization.
Decision Matrix: Power Automate vs Power BI for Ops and Finance Leaders
Use this matrix when scoping a new initiative. Match the scenario to the primary tool, then check whether the secondary tool strengthens the outcome.
| Scenario | Primary tool | Secondary tool | Compliance check |
|---|---|---|---|
| Automate month-end journal posting from spreadsheet to ERP | Power Automate | Power BI (audit trail dashboard) | SOC 2 / GDPR data handling |
| Build a real-time procurement spend dashboard | Power BI | Power Automate (threshold alerts) | GDPR if supplier PII is included |
| Route patient referral approvals between departments | Power Automate | Power BI (SLA tracking report) | HIPAA BAA check on all connectors |
| Consolidate EHR data for clinical analytics | Power BI | Power Automate (pipeline trigger on schedule) | HIPAA RLS plus PHI data residency |
| Sync CRM pipeline data into a finance forecast model | Power Automate | Power BI (forecast dashboard) | GDPR or PIPEDA if EU or Canadian customers |
| Generate weekly KPI pack for board reporting | Power BI | Power Automate (scheduled email delivery) | Data classification and access scope |
A practical note on export limits: Power BI is not an ETL pipeline. Its visual-layer CSV export is capped at 30,000 rows (Microsoft documentation, 2026). When a book distributor needed all 5,042,721 billing rows out of their Power BI environment, the solution was to connect directly to the underlying Analysis Services endpoint - bypassing the visual layer entirely. That approach delivered roughly a million rows per minute. The distinction between the report rendering layer and the semantic model layer is consequential once data volumes scale.
How Do Power Automate and Power BI Work Together in Practice?
The integration between the two tools is native and tight. Three patterns cover the majority of operational use cases:
Pattern 1 - Alert to action: Configure a Power BI data alert on a KPI card - for example, inventory falling below a reorder threshold. When the alert fires, it triggers a Power Automate flow that drafts a purchase order in the ERP and notifies the procurement lead on Teams. No one needs to monitor the dashboard manually.
Pattern 2 - Demand-driven dataset refresh: Some datasets need to refresh after an upstream pipeline completes, not on a fixed clock schedule. A Power Automate flow can call the Power BI REST API to trigger a semantic model refresh once the data warehouse signals readiness. This eliminates stale-data windows without unnecessary refresh cycles burning capacity.
Pattern 3 - Embedded actions inside reports: Power BI supports Power Automate buttons embedded directly in the report canvas. A sales manager reviewing a pipeline report can click to escalate a stalled deal - the flow fires from inside Power BI without the user switching applications. This pattern is particularly valuable for operational decision workflows where context and action need to live in the same view.
For organisations running ServiceNow alongside these Microsoft tools, the ServiceNow Power BI integration guide details how to surface ITSM data in Power BI dashboards - an architecture that frequently pairs with Power Automate flows for ticket routing and escalation logic.
---
About Lets Viz: Lets Viz has designed and delivered analytics and automation solutions since 2020 for organisations across US healthcare, UK fintech, Canadian manufacturing, and global SaaS. Our team holds active Microsoft, Google, and Zoho partner credentials and carries a 5.0 rating on Clutch. We scope, build, and support both Power BI and Power Automate implementations for mid-market and enterprise teams operating in regulated data environments.
If you are evaluating Power Automate, Power BI, or a combined implementation for your team, use the Instant project cost calculator to get an indicative scope and budget in under two minutes.