Multi-Currency Financial Reporting in Power BI
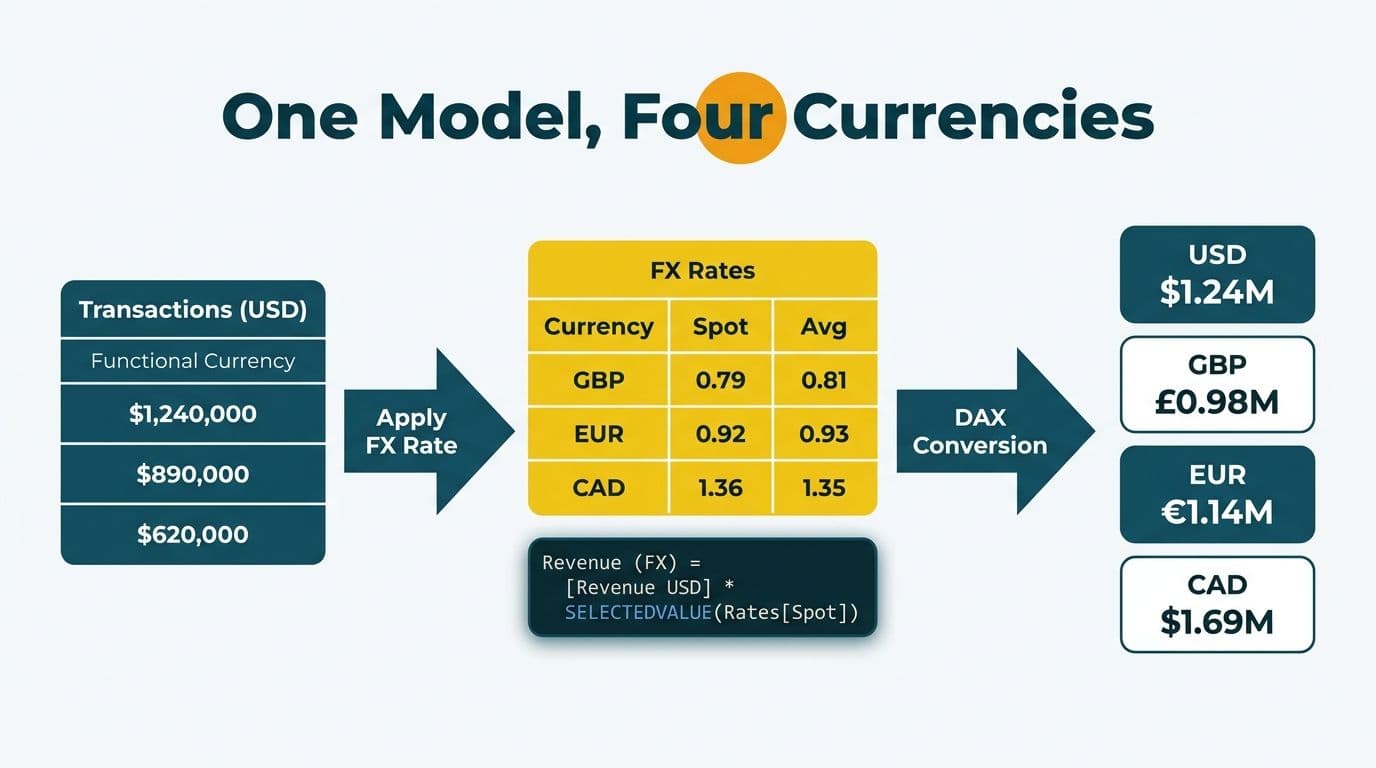
Multi-currency financial reporting in Power BI works by separating transaction storage from presentation: all source records stay in the reporting entity's functional currency, and a DAX conversion layer applies the correct exchange rate at query time. For CFOs and FP&A teams running books across the US, UK, EU, and Canada, this architecture lets a single semantic model serve every legal entity without duplicating data. Getting the exchange-rate type right - spot versus average - is as important as the DAX itself.
Key Takeaways
Store all transactions in your functional currency; never bake FX conversion into your ETL pipeline.
Use spot rates for balance-sheet items and average rates for income-statement items, following IAS 21 / ASC 830 guidance.
The SWITCH function in DAX is the standard pattern for user-driven currency selection in Power BI finance dashboards.
GDPR (UK/EU), PIPEDA (Canada), and US data-residency frameworks each impose distinct rules on where financial datasets may reside.
Power BI Premium's multi-geo feature and Microsoft Fabric's workspace-level data-residency controls address cross-border compliance without duplicating your semantic model.
What Is Multi-Currency Financial Reporting in Power BI?
Multi-currency financial reporting in Power BI is the practice of storing financial transactions in a base (functional) currency and converting them to any presentation currency at report time, using exchange-rate tables and DAX measures. The result is a single dataset that can serve a US parent company, a UK subsidiary, and a Canadian operating entity from one semantic model - with no manual reconciliation between them.
For Power BI for SaaS finance teams, this is one of the most requested data-model patterns. A SaaS company billing customers in USD, GBP, EUR, and CAD does not want four separate datasets - it wants one model with a currency-selector slicer that recalculates every KPI on the fly.
The three-tier architecture that underlies every robust multi-currency Power BI model:
| Tier | Contents | Update frequency |
|---|---|---|
| Fact table | Transactions in functional currency (e.g., USD) | Per ETL cycle |
| Exchange-rate table | Date-keyed rates: USD/GBP, USD/EUR, USD/CAD | Daily or intraday |
| DAX conversion layer | SWITCH-based measures applying the correct rate | At query time |
This separation keeps source-of-truth data clean and lets finance recalculate historical periods with revised rates without re-running ETL.
How Do You Load Live Exchange Rates Into a Power BI Dataset?
Power Query connects directly to exchange-rate sources: the European Central Bank's Frankfurter API for EUR-base rates, the Bank of Canada's Valet API for CAD cross-rates, or a treasury-managed rate table stored in Azure SQL or SharePoint. For most FP&A teams, a daily scheduled refresh is sufficient; Power BI Premium supports refresh intervals as short as 30 minutes for treasury teams monitoring intraday exposure (Microsoft Power BI service documentation, 2026).
A rate table schema that works across all three jurisdictions:
| Column | Type | Notes |
|---|---|---|
| DateKey | INT (YYYYMMDD) | Joins to date dimension |
| FromCurrency | NVARCHAR(3) | ISO 4217 code |
| ToCurrency | NVARCHAR(3) | ISO 4217 code |
| SpotRate | DECIMAL(18,6) | Closing rate at reporting date |
| AvgRateMonth | DECIMAL(18,6) | Period average for P&L translation |
Keeping both spot and average columns in a single row per date/currency pair simplifies the DAX patterns in the following sections and avoids a second relationship between the fact table and the rate dimension.
For teams weighing import mode versus DirectQuery for their rates table, the Power BI Import vs DirectQuery guide covers the latency and capacity trade-offs in detail.
Spot Rate vs. Average Rate: Which Does Your Multi-Currency Model Need?
Most multi-currency Power BI models need both rate types applied to different financial statement lines. IAS 21 ("The Effects of Changes in Foreign Exchange Rates," IASB) and ASC 830 ("Foreign Currency Matters," FASB) both prescribe the same split:
Balance-sheet items (cash, AR, AP, deferred revenue): closing/spot rate at the reporting date.
Income-statement items (revenue, OPEX, COGS, gross profit): average rate for the reporting period.
Equity transactions: historical rate at the original transaction date.
A UK-headquartered fintech with a USD-functional parent must apply GBP spot rates to its balance sheet but GBP/USD average rates to the P&L it consolidates upward. If both line types use the same rate, inter-company eliminations produce a translation adjustment that distorts reported profit - a common audit finding for companies that add jurisdictions without revisiting their BI layer.
In Canada, IFRS is the mandatory standard for publicly accountable enterprises (per CPA Canada's adoption framework), so Canadian subsidiaries of multinational SaaS companies follow the same IAS 21 mechanics. US private companies reporting under US GAAP follow ASC 830 but arrive at an identical rate-type split.
The practical implication for Power BI: your exchange-rate table must carry both `SpotRate` and `AvgRateMonth` columns, and your DAX measures must reference the correct one depending on the financial statement category of the metric being converted.
How Does the SWITCH Function Work for Multi-Currency Conversion in DAX?
The SWITCH function in DAX evaluates a selected value - typically driven by a disconnected currency-selector table - and returns the converted amount for that currency branch. It is the standard pattern for user-driven currency selection in Power BI finance KPI dashboards.
A practical SWITCH function Power BI example for P&L revenue conversion:
```dax
Revenue Converted =
VAR SelectedCurrency = SELECTEDVALUE( CurrencySelector[Currency], "USD" )
VAR BaseRevenue = [Total Revenue USD]
RETURN
SWITCH(
SelectedCurrency,
"GBP", BaseRevenue * CALCULATE( MAX( Rates[AvgRateMonth] ),
Rates[ToCurrency] = "GBP" ),
"EUR", BaseRevenue * CALCULATE( MAX( Rates[AvgRateMonth] ),
Rates[ToCurrency] = "EUR" ),
"CAD", BaseRevenue * CALCULATE( MAX( Rates[AvgRateMonth] ),
Rates[ToCurrency] = "CAD" ),
BaseRevenue // default: USD, no conversion
)
```
A parallel measure for balance-sheet items replaces `AvgRateMonth` with `SpotRate`. This keeps accounting treatment correct without requiring separate report pages per currency.
The `SELECTEDVALUE` guard returns the USD base when no slicer selection is active or when multiple currencies are selected - the correct behavior for a consolidated group view showing all entities together.
One nuance worth noting in multi-currency models: when you need to count distinct transaction records within a conversion context, the choice between COUNTX and COUNTROWS in DAX matters. `COUNTROWS` counts all rows in a filtered table and is the efficient choice for simple row counts on the rate dimension. `COUNTX` iterates a table expression and evaluates a per-row condition - useful when you need to count only transactions meeting a specific rate-type criterion. For pure row counts on an already-filtered table, prefer `COUNTROWS`; for conditional counting inside an iteration, use `COUNTX`.
For a complete walkthrough of the surrounding FP&A report structure, including star-schema design and publishing to the Power BI service, the FP&A Dashboard in Power BI step-by-step guide covers the full build from model to production.
Finance KPI Dashboard Examples for Multi-Currency Power BI Reporting
A well-structured multi-currency finance KPI dashboard in Power BI surfaces three distinct views from a single semantic model:
1. Consolidated group view (functional currency)
Aggregates all entities in the parent's functional currency. Used for board packs, investor reporting, and audit submissions. Applies average rate to P&L lines and spot rate to balance-sheet lines, consistent with IAS 21 / ASC 830.
2. Local entity view (presentation currency)
Filters to a single legal entity and displays in that entity's local currency. A UK fintech's local controller sees GBP; the Canadian subsidiary's CFO sees CAD; the US parent's treasury team sees USD. The same rate logic applies - only the `ToCurrency` value in the SWITCH changes.
3. Budget vs. actuals at budget rate
Compares current-period actuals against the FX rate locked at fiscal-year start. This is the FP&A team's primary tool for separating operational variance from FX variance. A US SaaS company running a USD budget for European ARR can immediately see whether a revenue shortfall reflects a sales-execution issue or a currency-movement effect. In practice, finance teams that implement this view report cutting their monthly FX variance analysis from two days of spreadsheet work to under two hours - the single biggest time saving in a multi-currency Power BI rollout.
Each view is a bookmark or a separate report page, not a separate dataset. A currency slicer, a rate-type parameter (spot/average/budget), and an entity slicer cover all three presentations without duplicating the underlying model.
Suppose a 200-person US SaaS company consolidates entities across the US, UK, and Canada. A typical mid-market Power BI build for this structure produces 15-20 core finance KPI measures - revenue, ARR, gross margin, EBITDA, cash, and AR aging - each available in three currency presentations, totaling around 60 published measures derived from five fact tables. The SWITCH pattern above scales to this volume without performance degradation in import mode.
What GDPR, PIPEDA, and US Rules Mean for Cross-Border Power BI Financial Datasets?
Cross-border multi-currency reporting creates a data-residency question that many finance teams encounter only during their first external audit: where does the underlying financial data actually reside when it flows through Power BI's cloud service?
UK and EU - GDPR
Under UK GDPR and EU GDPR, personal data - including any financial record that can identify an individual such as employee salary data or itemized customer invoices - may not be transferred to a jurisdiction lacking an adequacy decision or appropriate contractual safeguards. Microsoft's Power BI service operates within defined geographic regions; selecting "United Kingdom South" or a European region as the workspace home ensures data processing stays within the EEA. Microsoft publishes binding data-residency commitments in its Trust Center (2026). For a practical mapping of these settings, the GDPR-compliant SaaS financial reporting BI checklist walks through the key Power BI configuration steps.
Canada - PIPEDA and Quebec Law 25
Canada's PIPEDA and Quebec's Law 25 (fully enforceable since September 2023) require organizations to document cross-border data flows and conduct privacy impact assessments when personal financial data leaves Canada. Power BI Premium's multi-geo capability (available from the P1 SKU, per Microsoft's 2026 Power BI Premium licensing documentation) allows Canadian workspace data to reside in the Canada Central region while remaining accessible to a globally distributed report server. Combined with a Microsoft Data Processing Agreement, this satisfies the equivalent-protection requirement for most Canadian financial reporting workloads under PIPEDA.
United States - SOC 2 and sector-specific frameworks
The US has no single federal data-residency law for financial reporting, but SOC 2 Type II (AICPA) and sector-specific rules - HIPAA for healthcare-adjacent finance data, GLBA for financial services firms - require documented access controls and audit trails. Power BI's Row Level Security and the workspace-level audit logs available through the Microsoft 365 compliance portal address these requirements directly. US teams storing data in Azure US regions are not subject to cross-border transfer rules, but multinational models that replicate financial data to UK or EU regions must be assessed against local regulations before deployment.
The practical takeaway: assign each Power BI workspace to the correct geographic region before onboarding financial data. Migrating a workspace region after the fact requires a full dataset export and re-import - a cost that is entirely avoidable with upfront planning.
When Should You Consider Outsourced Finance Analytics Consulting?
Building a compliant, multi-currency semantic model in Power BI requires a combination of skills that rarely sits in one person: DAX proficiency, understanding of IAS 21 / ASC 830 mechanics, Power BI Premium administration, and cross-border data-residency compliance architecture. Most SaaS finance teams have deep accounting expertise but limited BI engineering bandwidth.
Outsourced financial analytics services make the most sense when:
The team needs the model live within a quarter and lacks a dedicated Power BI developer.
The model must withstand audit scrutiny on exchange-rate logic and period-over-period variance calculations.
Entities span two or more jurisdictions with different data-residency rules, requiring compliance architecture beyond standard Power BI setup.
The current reporting process depends on a patchwork of monthly Excel workbooks that reconcile manually at each period-end.
A typical mid-market multi-currency Power BI engagement covers data-model design, ETL connections from ERP and billing systems, a DAX measure library, Row Level Security per legal entity, data-residency workspace configuration, and handover documentation for the finance team. Ongoing managed Power BI services can then handle dataset refreshes, exchange-rate table maintenance, and new-entity onboarding as the business expands into additional markets.
For teams still evaluating whether Power BI is the right platform for this use case, the Looker Studio vs Power BI 2026 comparison covers the capability differences most relevant to finance-specific requirements.
---
About Lets Viz: Lets Viz has delivered data analytics and Power BI solutions for finance, operations, and growth teams since 2020, serving clients across US healthcare, UK fintech, Canadian manufacturing, and global SaaS. The firm holds a 5.0 Clutch rating and specializes in building production-ready, audit-compliant semantic models for mid-market and enterprise finance teams operating across multiple jurisdictions.
If your finance team needs a multi-currency Power BI model built to IAS 21 / ASC 830 standards - with GDPR/PIPEDA data-residency configuration and a finance KPI dashboard your board can rely on - explore how Power BI for SaaS finance teams works in practice.