Migrate Cognos Paginated Reports to Power BI: Format Guide
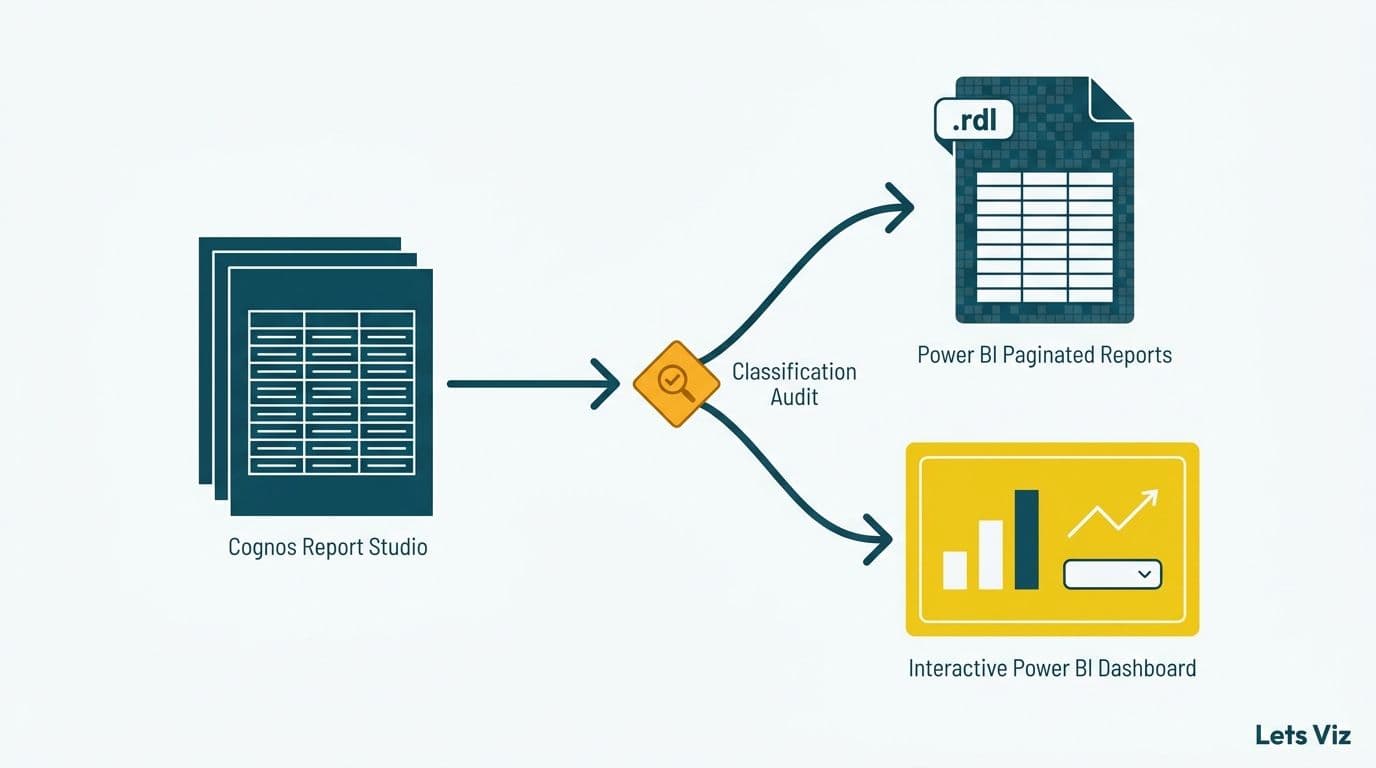
When you migrate Cognos paginated reports to Power BI, the most consequential decision is not about data modeling or DAX - it is about format. Cognos Report Studio outputs belong in one of two places: Power BI Paginated Reports (.rdl files, pixel-perfect and print-ready) or interactive Power BI dashboards (explorable canvases built in Power BI Desktop). Misassigning reports to the wrong format is the leading driver of rework hours in Cognos migrations, and it is entirely preventable with a structured classification audit before the rebuild begins.
Key Takeaways
Power BI has two distinct rendering engines: Paginated Reports (.rdl) for fixed-layout print output and interactive dashboards (.pbix) for exploration, filtering, and drill-through.
Financial statements, compliance filings, and burst distributions belong in Paginated Reports; executive scorecards and operational monitors belong in interactive dashboards.
A per-report format classification audit is the highest-leverage action a data team can take to control migration scope and cost.
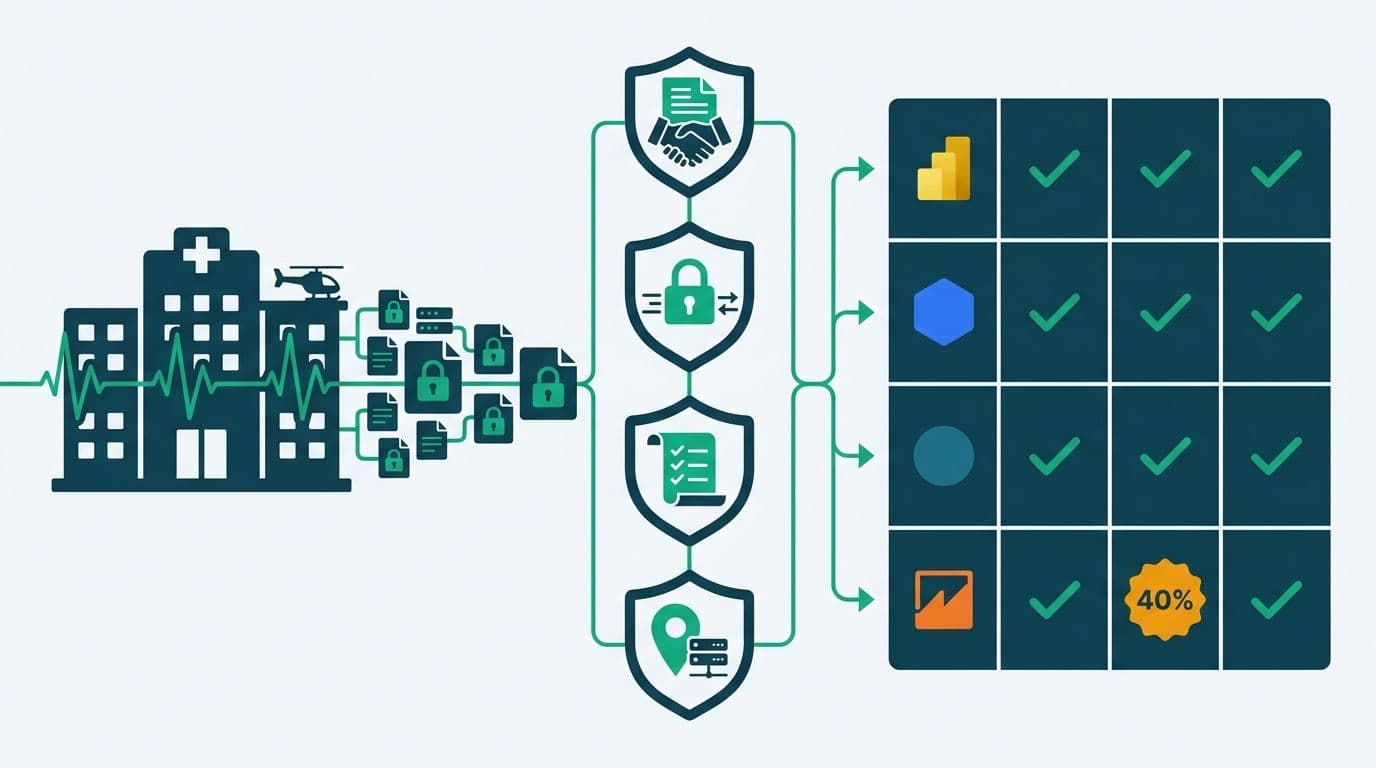
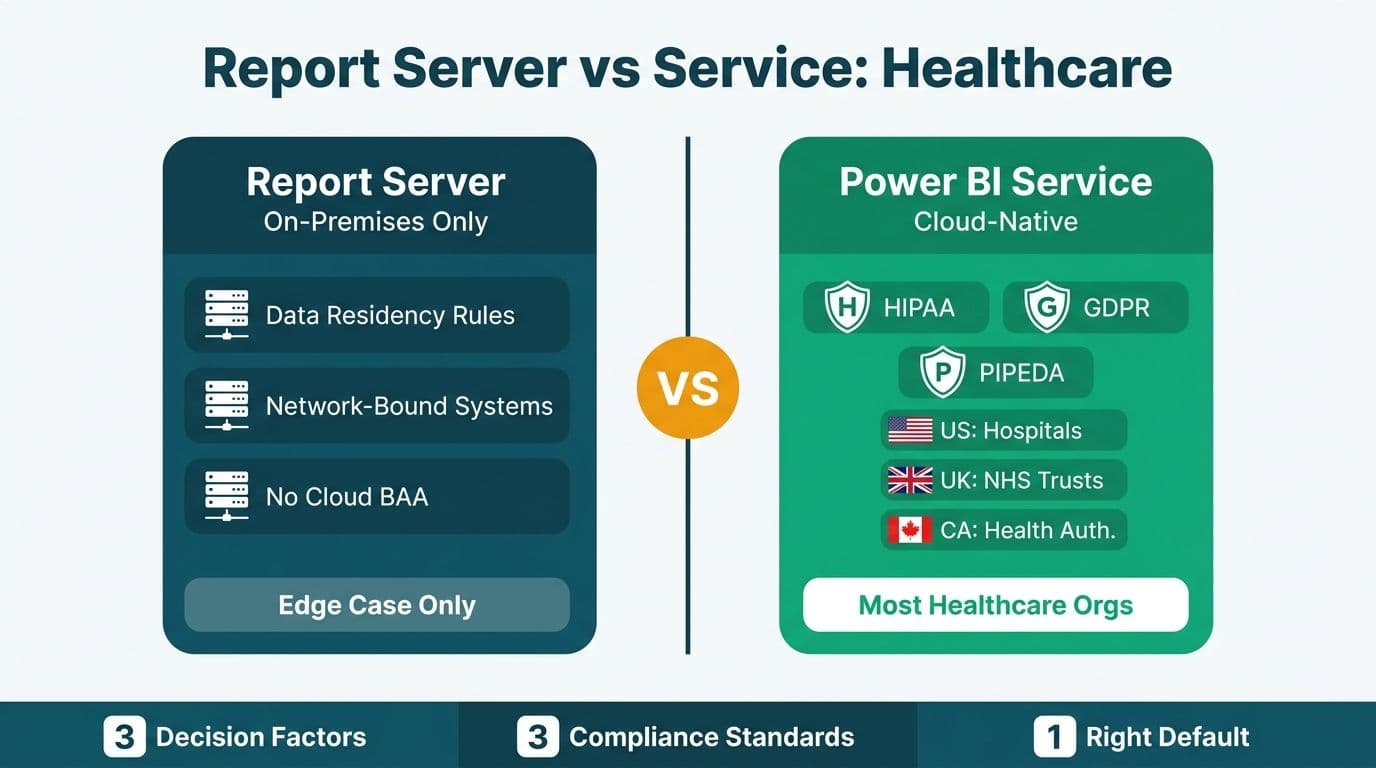
HIPAA, GDPR, and PIPEDA requirements frequently mandate paginated format for regulated data exports.
Paginated Reports require Power BI Premium Per User or a Premium capacity SKU - confirm licensing before committing to a format target.
What Is the Difference Between Cognos Report Studio and Power BI's Two Rendering Engines?
Cognos Report Studio is a unified authoring environment that produces both formatted, printable documents and interactive crosstab reports from the same tool. Power BI separates those capabilities into two distinct technologies. The interactive canvas (Power BI Desktop, .pbix) is designed for exploration: slicers, drill-through, cross-filtering, and live data connections. Power BI Paginated Reports (.rdl, the direct successor to SQL Server Reporting Services) is designed for layout precision: multi-page tables, sub-reports, parameterized page breaks, and pixel-perfect PDF output for printing or regulated distribution.
Organizations that migrate Cognos paginated reports to Power BI without recognizing this split typically produce one of two mismatches: compliance filings rebuilt as interactive dashboards that cannot be cleanly printed, or operational monitors rebuilt as paginated documents that offer no filtering. Both outcomes require a costly rebuild.
Our Tableau to Power BI migration services team applies a format-classification framework to every legacy BI workload before the first report is rebuilt. The decision logic below reflects that framework applied to Cognos Report Studio inventories.
According to Future Market Insights (2025), the global analytics and BI consulting market will grow from USD 11.07 billion in 2025 to USD 90.99 billion by 2035, a 26.2% CAGR driven largely by organizations modernizing legacy platforms like Cognos. Format clarity at project start separates on-budget migrations from the ones that overrun by quarters.
How Do You Run a Format Classification Audit on a Cognos Inventory?
The fastest classification method asks three diagnostic questions about each active Cognos report:
1. Is the output designed to be printed or emailed as a fixed-layout PDF? If yes, the target is Paginated Reports.
2. Does the consumer need to filter, slice, or drill into the data interactively? If yes, the target is an interactive dashboard.
3. Does the report use sub-reports, burst distributions, or parameterized page breaks? If yes, Paginated Reports is almost always correct.
Build a spreadsheet with one row per active report. Recommended columns: report name, primary consumer role (executive, operational, compliance, analyst), current output format (PDF, scheduled Excel, web interactive), last-accessed date, and format classification. Reports last accessed more than 18 months ago are retirement candidates - removing them typically reduces migration scope by 20-30% before a single line of DAX is written.
For teams running Power BI consulting for healthcare organizations, add a column flagging reports that contain protected health information. HIPAA-covered entities need that flag during format selection, not after the rebuild.
The Healthcare Financial Analytics Market is projected to grow at an 8.58% CAGR from 2025 to 2035, according to Market Research Future (2025), driven by regulatory complexity and the migration from legacy BI platforms. For healthcare data teams, the format audit and the compliance audit are the same exercise.
When Should Cognos Reports Migrate to Power BI Paginated Reports?
Use Paginated Reports when the output is defined by its layout, not its interactivity.
The following Cognos Report Studio output types belong in Power BI Paginated Reports:
Financial statements and GL summaries - balance sheets, income statements, and trial balances where every row must appear in a fixed, auditor-readable sequence.
Invoice and billing extracts - patient billing statements, explanation-of-benefits (EOB) documents, and remittance advice that must conform to a fixed template for print or email delivery.
Regulatory and compliance filings - reports submitted to CMS in the US, the FCA in the UK, or OSFI in Canada, where format is prescribed and cannot be altered by the consumer.
Burst distributions - Cognos reports scheduled for delivery to hundreds of cost-center managers, each receiving a row-filtered slice. These become Paginated Report subscriptions in Power BI, with row-level security controlling each recipient's view.
Sub-report and master-detail compositions - Cognos "master-detail" layouts that embed multiple report sections in sequence require the .rdl sub-report model to reproduce correctly.
A US hospital system migrating from Cognos will typically find 40-60% of its Report Studio inventory in this category: HIPAA-compliant patient statements, CMS cost-report templates, and departmental P&L distributions to cost-center managers. A UK fintech firm subject to FCA requirements faces a parallel constraint under GDPR - data minimization principles make scoped, paginated exports of personal financial data easier to justify than open-ended interactive access to the same dataset.
For teams automating distribution of these outputs, the guide on automating monthly financial reporting in Power BI covers subscription configuration and delivery scheduling within Power BI Premium.
When Should Cognos Reports Migrate to Interactive Power BI Dashboards?
Use the interactive canvas when the consumer's job is to ask follow-up questions, not consume a fixed answer.
The following Cognos output types belong in Power BI interactive dashboards:
Executive scorecards and KPI monitors - a CFO reviewing SaaS metrics for board reporting, including rule-of-40 benchmarks and ARR trends, needs slicers and drill-through, not a static table.
Operational performance monitors - claims adjudication queues, call-center SLA dashboards, and branch scorecards where users filter by date range, region, or product line in real time.
Ad-hoc analyst pivot workbooks - reports staff currently export from Cognos to Excel and manually pivot. Self-serve filters in Power BI eliminate that workflow and the version-control risk it creates.
Cross-functional views - where finance, operations, and sales each need a different slice of the same dataset, enabled by Power BI's bidirectional relationship model.
Power BI's DAX CROSSFILTER function is a capability that makes interactive dashboards meaningfully superior to Cognos crosstabs for exploration. It lets report authors control how relationship propagation flows across visuals, so clicking a single diagnosis code simultaneously filters procedure volumes, payer mix, and claims lag - a workflow that required separate Cognos reports to approximate.
A Canadian financial services firm migrating Cognos branch performance reports found that 35% of its inventory - previously distributed as Excel-attached PDFs to regional managers - could be replaced by a single interactive dashboard with regional slicers and employee-level row-level security. Under PIPEDA, the dataset-level security model provided a cleaner data access justification than per-report access controls in Cognos.
According to MedInsight's 2026 healthcare analytics outlook, AI-driven analytics and value-based care performance monitoring are the two fastest-growing reporting demand areas in US and Canadian healthcare - both fundamentally explorative use cases requiring interactive dashboards, not static paginated output.
Migrate Cognos Paginated Reports to Power BI: Format Decision Matrix
Assign every active Cognos report to a row in this matrix before your migration kickoff. Reports that span both columns are candidates for a split rebuild or retirement.
| Cognos Report Type | Primary Consumer | Interactivity Needed | Correct Power BI Format |
|---|---|---|---|
| Financial statement (P&L, balance sheet) | Finance director, auditor | Low - fixed row sequence | Paginated Report (.rdl) |
| Patient billing statement or EOB | Patient, billing team | None - print or email | Paginated Report (.rdl) |
| Regulatory filing (CMS, FCA, OSFI) | Compliance officer | None - format prescribed | Paginated Report (.rdl) |
| Cost-center P&L burst (100+ recipients) | Budget owners | Low - personalized slice | Paginated Report (.rdl) |
| Sub-report or master-detail layout | Report developer | Low to medium | Paginated Report (.rdl) |
| Executive scorecard | C-suite | High - drill and filter | Interactive Dashboard (.pbix) |
| Operational monitor (queue, SLA) | Operations manager | High - live refresh | Interactive Dashboard (.pbix) |
| Branch or territory performance | Regional director | High - geographic slicing | Interactive Dashboard (.pbix) |
| Ad-hoc analyst pivot workbook | Data analyst | Very high - self-serve | Interactive Dashboard (.pbix) |
| SaaS board pack (rule-of-40, ARR) | CEO, board | Medium - trend and drill | Interactive Dashboard (.pbix) |
How Do Finance Teams Rebuild Cognos P&L, Variance, and Rolling-Forecast Reports in Power BI?
For finance teams migrating Cognos financial reports to Power BI, the format decision is only the first hurdle. The second is expression translation: Cognos Report Studio uses its own calculation language for financial measures, and those expressions must be re-expressed in DAX before any report can be rebuilt.
P&L and variance calculations
Cognos P&L reports commonly use `running-total()` and conditional aggregations tied to account hierarchy levels. In Power BI, these translate to DAX `CALCULATE` with `ALLEXCEPT` for hierarchy-aware totals, and `VAR` / `RETURN` blocks for variance expressions. A typical Cognos actual-vs-budget variance - scoped to the current row's cost center - becomes:
```
Budget Variance =
CALCULATE([Actual], ALLEXCEPT(Accounts, Accounts[CostCenter]))
- CALCULATE([Budget], ALLEXCEPT(Accounts, Accounts[CostCenter]))
```
Percentage variance follows the same pattern with a divide-safe wrapper: `DIVIDE([Actual] - [Budget], ABS([Budget]), BLANK())`. This eliminates the divide-by-zero errors that surface when budget lines are zero for new cost centers.
Rolling-forecast patterns
Cognos rolling-forecast reports typically sum actuals for closed periods and plan figures for open periods within a single column. In DAX, this requires a `SWITCH(TRUE(), ...)` pattern keyed against a calendar table flag (`IsClosed`):
```
Rolling Forecast =
VAR IsClosed = SELECTEDVALUE(Calendar[IsClosed])
RETURN SWITCH(TRUE(), IsClosed = 1, [Actual], [Budget])
```
Pairing this measure with a relative-period slicer (Last 12 months, Current FY, Rolling 8 quarters) gives CFOs the same forward visibility they had in Cognos without requiring separate report versions for each planning horizon.
CFO-ready drill-through design
When migrating Cognos financial reports to Power BI interactive dashboards - for executive scorecards rather than fixed-layout statements - drill-through pages are the primary mechanism for recreating the expand-row behavior that finance users rely on in Cognos crosstabs. For CFO-facing output, set drill-through filters on GL account, cost center, and period so each detail page arrives pre-scoped. Keep the summary page to five KPIs or fewer (gross margin, EBITDA, budget variance, rolling forecast accuracy, prior-year comparison) and let drill-through pages carry the line-item detail. For P&L and variance reports destined for Paginated Reports format, replace the drill-through model with an .rdl sub-report that renders account-level detail only when the user selects a summary row - preserving pixel-perfect layout while maintaining the expand/collapse behavior auditors expect.
How Do Compliance Requirements Shape Format Choice in Healthcare and Finance?
Compliance is often the deciding factor when a report could technically work in either format. The practical rule: choose the format that is easiest to scope to a specific recipient and easiest to audit.
HIPAA (US healthcare): The minimum necessary standard means a paginated report displaying only the permitted PHI fields for a named recipient is typically more defensible than an interactive dashboard where a user might cross-filter into an unauthorized view. Power BI row-level security at the semantic model layer mitigates this risk in interactive format, but many compliance teams prefer paginated output for audit trail simplicity. The full HIPAA control set is outlined in the HIPAA-compliant analytics dashboard best-practices checklist.
GDPR (UK and EU): Data minimization under Article 5(1)(c) and purpose limitation under Article 5(1)(b) push UK and EU organizations toward paginated exports for personal data. An interactive dashboard with broad dataset access requires a more elaborate legitimate interest justification than a scoped paginated report that delivers precisely the permitted fields.
PIPEDA (Canada): Canada's Personal Information Protection and Electronic Documents Act requires that personal information be used only for identified purposes. Canadian healthcare and financial services organizations frequently find that paginated, scoped exports are easier to justify to the Office of the Privacy Commissioner than open-ended interactive datasets. A Canadian insurance firm migrating Cognos adjudication reports, for example, typically selects Paginated Reports for any output containing personal health information.
The Power BI Import vs DirectQuery decision guide covers a closely related compliance question: whether to import data into Power BI's in-memory model or query the source at runtime - a choice that determines where PHI and PII reside and which data residency rules under GDPR and PIPEDA apply.
What Are the Most Common Mistakes When You Migrate Cognos Paginated Reports to Power BI?
Mistake 1: Rebuilding everything as an interactive dashboard. Teams excited by Power BI's visual capabilities convert financial statements and compliance reports into interactive canvases. Finance directors who need to hand a formatted PDF to an auditor are forced to screenshot a dashboard or export to an unstyled Excel file - neither is acceptable in a regulated environment.
Mistake 2: Rebuilding everything as a Paginated Report. Developers with SSRS experience rebuild executive scorecards and operational monitors as paginated documents. Users who need a date slicer or regional drill-through must file a modification request instead of adjusting a filter. Both extremes produce the same outcome: user rejection and a rebuild from scratch.
Mistake 3: Not confirming Power BI Premium licensing before committing to Paginated Reports. Power BI Paginated Reports require Power BI Premium Per User (PPU) or a Premium capacity (P, EM, or F SKU). They are not available on standard Power BI Pro licenses. Confirm the license tier in week one of the project, not at go-live.
Mistake 4: Underestimating burst report complexity. Cognos burst reports that distribute personalized output to hundreds of recipients become Paginated Report subscriptions in Power BI. Subscription limits, row-level security configuration at scale, and delivery scheduling require careful architecture planning before migration begins - not after the first test run fails at 300 recipients.
Mistake 5: Classifying at the Cognos folder level rather than the report level. Cognos folders are organized by business unit, not output type. Reports within a single folder commonly split 50/50 between paginated and interactive targets. Bulk folder-level classification produces bulk misclassification and the rework that follows. Always classify report by report.
---
About Lets Viz: Lets Viz has delivered data analytics and BI modernization solutions to mid-market organizations since 2020, including US healthcare systems navigating HIPAA-compliant platform migrations, UK fintech firms managing GDPR-aligned reporting stacks, Canadian manufacturing companies building PIPEDA-compliant data platforms, and global SaaS businesses tracking board-level metrics. The firm holds a 5.0 Clutch rating and specializes in Power BI architecture, migration, and managed analytics services.
Ready to classify your Cognos Report Studio inventory and migrate with confidence? Our Tableau to Power BI migration services include a format-classification audit as a standard project milestone - so format mismatch never reaches the rebuild phase.