Looker Studio Marketing Dashboard Examples: 6 Proven Templates
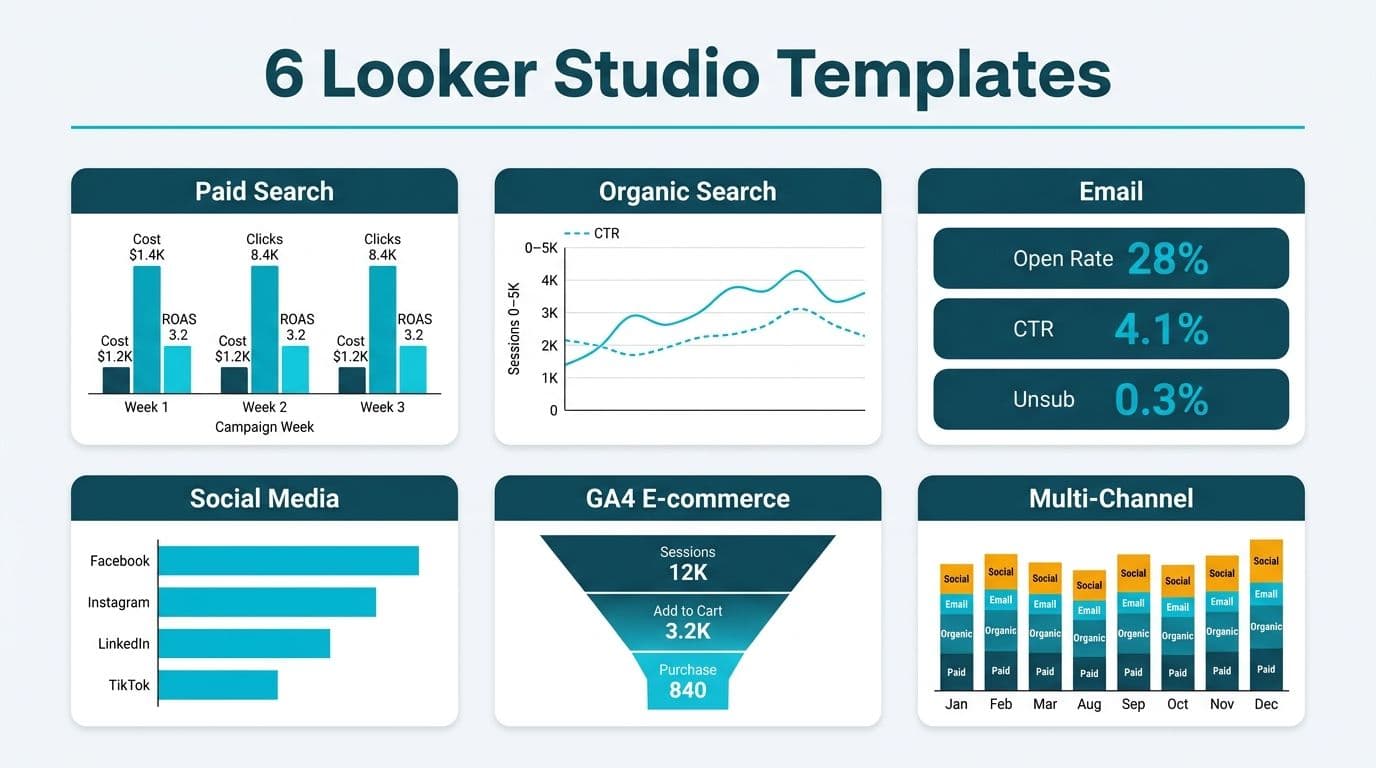
Looker Studio marketing dashboard examples fall into six practical archetypes - paid search, organic search, email, social media, GA4 e-commerce, and multi-channel - each configured with purpose-built connectors and a channel-specific KPI set. Picking the right template depends on which channels drive revenue, how your organization handles GDPR consent mode in GA4, and whether leadership needs a unified cross-channel view or separate scorecards per team. The six templates below give CIOs, data leads, and finance directors a concrete reference for scoping a new build or auditing an existing setup.
Key Takeaways
Looker Studio offers six proven dashboard archetypes for marketing teams: paid search, organic, email, social, GA4 e-commerce, and multi-channel.
Each type draws from a distinct set of connectors; mixing incompatible sources without a clearly defined join key is the leading cause of reporting inconsistencies.
GDPR consent mode v2 limits GA4's ability to observe declined-consent sessions; understanding the gap between observed and modeled conversions is essential for any EU-facing dashboard.
Google Looker and Looker Studio are different products - one is an enterprise BI platform built on LookML, the other a free reporting layer - and confusing them leads to misaligned project scopes and budget surprises.
Healthcare and finance organizations in the US and Canada must apply HIPAA and PIPEDA controls before connecting GA4 or CRM data to any shared Looker Studio environment.
What Are Looker Studio Marketing Dashboard Examples?
A Looker Studio marketing dashboard is a live, connected report that pulls channel performance data directly from marketing platforms and renders it in an interactive visual layer - without requiring any manual data export. Each report re-queries its source on load, so a finance director reviewing spend efficiency on Monday morning sees actuals, not a Friday export.
The six dashboard types covered in this article map to the full scope of what a mid-market marketing team typically requires: campaign-level paid media accountability, organic search visibility, email performance tracking, social engagement analysis, on-site revenue monitoring via GA4, and a blended multi-channel view for executive reporting. Our Certified Looker Studio consulting practice uses these six templates as the starting point for every engagement, then tailors connector configuration, calculated fields, and access permissions to each organization's specific tech stack.
What Is the Difference Between Google Looker and Looker Studio?
Google Looker is an enterprise BI platform built around LookML, a proprietary semantic modeling language that defines metrics, joins, and access controls in version-controlled code. It requires a Google Cloud deployment or hosted Looker environment and carries an enterprise license cost structured around user count and data volume. Looker Studio (formerly Google Data Studio) is a free, browser-based reporting tool that connects to over 900 data sources through native and partner connectors (as of 2026), with no coding or infrastructure required.
For marketing dashboard use cases - campaign scorecards, conversion funnel tracking, channel pacing views - Looker Studio is the appropriate tool. Google Looker suits organizations that need a governed, reusable semantic layer accessible across product analytics, finance, and operations teams simultaneously. The Google Looker pricing in 2026 article on this site covers what each product costs and when the investment is warranted.
Understanding this distinction before scoping any project is critical. A team that expects Google Looker's enterprise semantic layer from a free Looker Studio implementation - or vice versa - will face significant cost overrun or architectural dead ends. The Looker Studio vs Power BI 2026 decision-maker's guide extends this comparison to the broader enterprise BI landscape for teams evaluating all options.
Six Looker Studio Marketing Dashboard Examples: Connectors, KPIs, and Configuration
Each of the following templates lists the primary data connectors, the core KPIs the dashboard surfaces, and the most common configuration issue teams encounter during initial setup.
1. Paid Search Performance Dashboard
Primary connectors: Google Ads (native Looker Studio connector), Microsoft Advertising via partner connector, Google Sheets for manual budget pacing inputs.
Core KPIs: Impressions, clicks, click-through rate (CTR), average cost-per-click (CPC), conversions, cost-per-conversion, return on ad spend (ROAS), impression share, Quality Score distribution, and search term performance by match type.
Common configuration issue: Blending Google Ads and Microsoft Advertising at the data source level using campaign name as the join key produces duplicate rows when naming conventions differ across platforms. A more reliable architecture places each platform in its own data source on a tabbed dashboard page, with a shared date range control driving both. A US SaaS company managing separate brand and non-brand campaigns across both platforms can add a page-level filter tied to a campaign label dimension, allowing each product manager to view their budget in isolation without maintaining duplicate report copies.
2. Organic Search Dashboard
Primary connectors: Google Search Console (native), GA4 (native), Google Sheets for target keyword tracking and content calendar alignment.
Core KPIs: Total impressions, total clicks, average position, click-through rate by page, organic landing page sessions, organic goal completions, new vs. returning user split from organic traffic, and page-level Core Web Vitals data pulled from Search Console.
Common configuration issue: Joining Search Console and GA4 on the landing page URL dimension fails when GA4 applies automatic query-parameter appending to page paths. Strip parameters from GA4 page paths using a `REGEXP_REPLACE` calculated field before blending, or the join produces near-zero matches and the dashboard appears to show zero organic-driven conversions. The Search Console native connector also limits output to 1,000 rows per dimension pair; for content-heavy sites with hundreds of ranking pages, export full-dataset queries via the Search Console API to BigQuery or Sheets and connect Looker Studio to that output instead.
3. Email Marketing Dashboard
Primary connectors: Third-party connector pulling from your email service provider - Mailchimp, Klaviyo, HubSpot, Zoho Campaigns, or Salesforce Marketing Cloud via Supermetrics or Make - combined with the GA4 native connector for post-click session and revenue attribution.
Core KPIs: Total sends, delivery rate, open rate, click rate, click-to-open rate (CTOR), unsubscribe rate, hard bounce rate, revenue per email send, and post-click conversion rate matched via GA4 UTM parameters.
Common configuration issue: Any email sent without properly structured UTM parameters lands in GA4's direct/none channel bucket. This systematically understates email's attribution share across the entire reporting history. A UK fintech firm running both transactional confirmation emails and promotional broadcast campaigns should enforce UTM tagging at the ESP template level - not as a manual step before each send - to prevent attribution gaps from accumulating. Segment this dashboard by list type (nurture sequences, broadcasts, and transactional triggers), since each segment carries materially different benchmark values for open rate and CTOR and a single blended view obscures performance.
4. Social Media Engagement Dashboard
Primary connectors: Supermetrics or partner connector for Meta (Facebook and Instagram), LinkedIn Ads, LinkedIn Organic, TikTok Ads, and Pinterest as applicable. YouTube paid performance pulls via the native Google Ads connector; organic YouTube analytics connect through the YouTube Analytics connector.
Core KPIs: Reach, impressions, engagement rate, video view-through rate (VTR), link clicks, cost-per-engagement (paid campaigns), cost-per-thousand impressions (CPM), follower growth rate, and share-of-voice index calculated using benchmark data imported via Google Sheets.
Common configuration issue: Organic social and paid social metrics must remain in separate data sources even when displayed on the same dashboard page. Blending them produces non-interpretable composite rows because the underlying schema differs significantly across platforms. The impressions dimension in Meta Ads represents paid delivery; the impressions dimension in Meta Business Suite represents organic reach. They are not additive. Use tabbed dashboard pages - one for organic, one for paid - with shared date controls to enable side-by-side review without blending errors.
5. GA4 E-Commerce Dashboard
Primary connectors: GA4 native connector, BigQuery GA4 export (native BigQuery connector) for high-traffic or compliance-sensitive implementations, and Google Merchant Center via partner connector for product feed performance data.
Core KPIs: Sessions, add-to-cart rate, checkout initiation rate, purchase conversion rate, average order value (AOV), total revenue, transactions, refund rate, product-level revenue by item name and category, and first-purchase vs. repeat-purchase split.
Common configuration issue: The GA4 native connector in Looker Studio applies data sampling above 100,000 sessions in a single date range query. For a Canadian retail brand processing high-volume holiday traffic, connecting Looker Studio to the BigQuery GA4 export rather than the native connector eliminates sampling entirely. Configuring the BigQuery dataset in the `northamerica-northeast1` or `northamerica-northeast2` region also satisfies PIPEDA-aligned data residency requirements for organizations that need to demonstrate Canadian data storage to regulators or enterprise procurement teams.
6. Multi-Channel Attribution Dashboard
Primary connectors: Blended data source combining Google Ads (native), paid social platforms via Supermetrics, GA4 via BigQuery export (recommended at this complexity level), and a CRM pipeline export delivered through Google Sheets or BigQuery.
Core KPIs: Total attributed conversions by channel, last-click vs. data-driven attribution delta, channel contribution to pipeline revenue, cost-per-acquisition (CPA) by channel, conversion path length from GA4 path exploration exported to Sheets, customer acquisition cost (CAC), and CAC-to-lifetime-value ratio by channel.
Common configuration issue: Mismatched attribution windows are the primary driver of conversion double-counting in multi-channel blends. If Google Ads reports on a 30-day click window while a paid social platform reports on a 7-day click window, blending without normalizing produces an inflated total conversion figure. In practice, mismatched windows routinely inflate blended conversion totals by 15–30% for campaigns with retargeting components, since the same user-conversion event falls inside one platform's window but outside the other's — a discrepancy large enough to flip budget allocation decisions. Align all platforms to a common window in their respective platform settings before creating the blended source, and surface the chosen window as a visible text annotation on every dashboard page. For US healthcare marketing teams, verify that no PII fields - patient email addresses, appointment IDs, or insured member identifiers - are present in any CRM export feeding a shared Looker Studio environment. GA4 and Looker Studio do not carry HIPAA Business Associate status by default, and commingling protected health information without a signed Business Associate Agreement creates regulatory exposure.
Dashboard Comparison: Types, Complexity, and Compliance Considerations
| Dashboard Type | Primary Connectors | Key KPIs | Build Complexity | Compliance Consideration |
|---|---|---|---|---|
| Paid Search | Google Ads, Microsoft Ads | ROAS, CPC, conversions | Low | Low |
| Organic Search | Search Console, GA4 | Position, CTR, sessions | Low | Low |
| ESP via Supermetrics, GA4 | Open rate, CTOR, revenue/send | Medium | Medium - GDPR consent for EU sends | |
| Social | Meta/LinkedIn via Supermetrics | Engagement rate, CPM, VTR | Medium | Medium - Meta data transfer under GDPR |
| GA4 E-Commerce | GA4, BigQuery, Merchant Center | AOV, purchase rate, revenue | High | Medium-High - consent mode, data residency |
| Multi-Channel | Blended (all above + CRM) | CAC, attribution delta, pipeline | Very High | High - PII in CRM, HIPAA and PIPEDA risk |
How Does GDPR Consent Mode Affect GA4 Data in Looker Studio?
GDPR consent mode is the most consequential data quality issue for any organization with EU or UK website visitors. When a user declines cookie consent, GA4 cannot directly observe that session. Google's consent mode v2 - required for all Google tags serving EU and EEA traffic as specified in Google's consent mode technical documentation - uses behavioral modeling to estimate conversions from declined-consent users and fill part of the observational gap.
The practical issue for Looker Studio users: the native GA4 connector surfaces observed conversions only, not the modeled total that GA4's Advertising workspace displays. Industry data indicates declined-consent sessions account for 25–40% of EU/EEA traffic on most B2C and SaaS sites, which means the observational gap is material — not marginal — for any dashboard used to allocate paid media spend. Marketing dashboards built exclusively on the native connector therefore systematically underreport conversions for UK and EU audiences relative to what GA4 shows natively. The recommended approach is using GA4's Advertising Snapshot report for executive-level conversion headline figures and restricting Looker Studio to segmented engagement and behavioral metrics where observed data is sufficient. For organizations that require modeled conversion data inside Looker Studio, exporting modeled fields via the BigQuery GA4 export and connecting Looker Studio to that BigQuery dataset is the reliable path.
For organizations with Canadian visitors under PIPEDA, the compliance concern centers on consent management and cross-border data transfer. GA4 sends behavioral data to Google's servers by default. Organizations collecting data from Canadian residents should ensure their privacy policy discloses this transfer, their consent management platform captures explicit consent before GA4 fires, and their BigQuery export is configured in a Canadian region when data residency is a requirement. The GDPR Compliant SaaS Financial Reporting: The BI Checklist on this site provides a practical compliance framework applicable to any BI environment pulling EU or Canadian visitor data.
How Do You Build a Multi-Channel Marketing Dashboard in Looker Studio?
Deploying a production-ready multi-channel dashboard follows a structured six-step sequence. Skipping early steps introduces data quality problems that are expensive to resolve after leadership is already relying on the dashboard.
Step 1 - Audit your UTM taxonomy. Every paid channel, email campaign, and affiliate link must apply consistent `utm_source`, `utm_medium`, and `utm_campaign` values before any blending is attempted. Inconsistent tagging is the most common cause of direct-channel inflation in GA4 and cannot be corrected retroactively without re-tagging and waiting for new data to accumulate.
Step 2 - Select and document a single attribution window. Align all paid platforms to a common click attribution window - typically 7-day or 30-day click. Capture the decision as a visible text annotation on the dashboard so every reviewer understands the basis for the numbers they are reading.
Step 3 - Build and validate each data source independently. Create the Google Ads, paid social, GA4, and CRM sources one at a time. Validate row counts against native platform reports for a 7-day window before attempting any blend.
Step 4 - Define your blend join key. Date is the most reliable join dimension for cross-channel blends. Joining on campaign name is valid only if naming conventions are enforced programmatically and consistently across all platforms.
Step 5 - Apply access controls. Looker Studio's default sharing creates a viewer link accessible to anyone who has the URL. Finance directors and data leads at US healthcare organizations should restrict sharing to named Google Workspace users and schedule a quarterly access review.
Step 6 - Surface a data freshness indicator. Add a data-as-of calculated field using `TODAY()` minus one day as a visible widget on every dashboard page. This prevents leadership from acting on stale data without contacting the analytics team.
For teams scoping their first build, the how much does a Looker Studio consultant cost in 2026 article provides a realistic budget benchmark for planning purposes.
---
Ready to deploy production-ready marketing dashboards? The Certified Looker Studio consulting team at Lets Viz designs and builds all six dashboard types - with GDPR consent-mode gap analysis, HIPAA-reviewed data architecture, and PIPEDA-aligned BigQuery residency included from day one.
---
About Lets Viz: Lets Viz is a data analytics consultancy operating since 2020, serving US healthcare systems, UK fintech firms, Canadian manufacturing companies, and global SaaS businesses. The firm holds a 5.0 Clutch rating and carries Google partnership credentials, with hands-on delivery experience across regulated industries where data governance and reporting accuracy are non-negotiable.