Looker Studio for Finance Reporting: A Finance Director's Guide
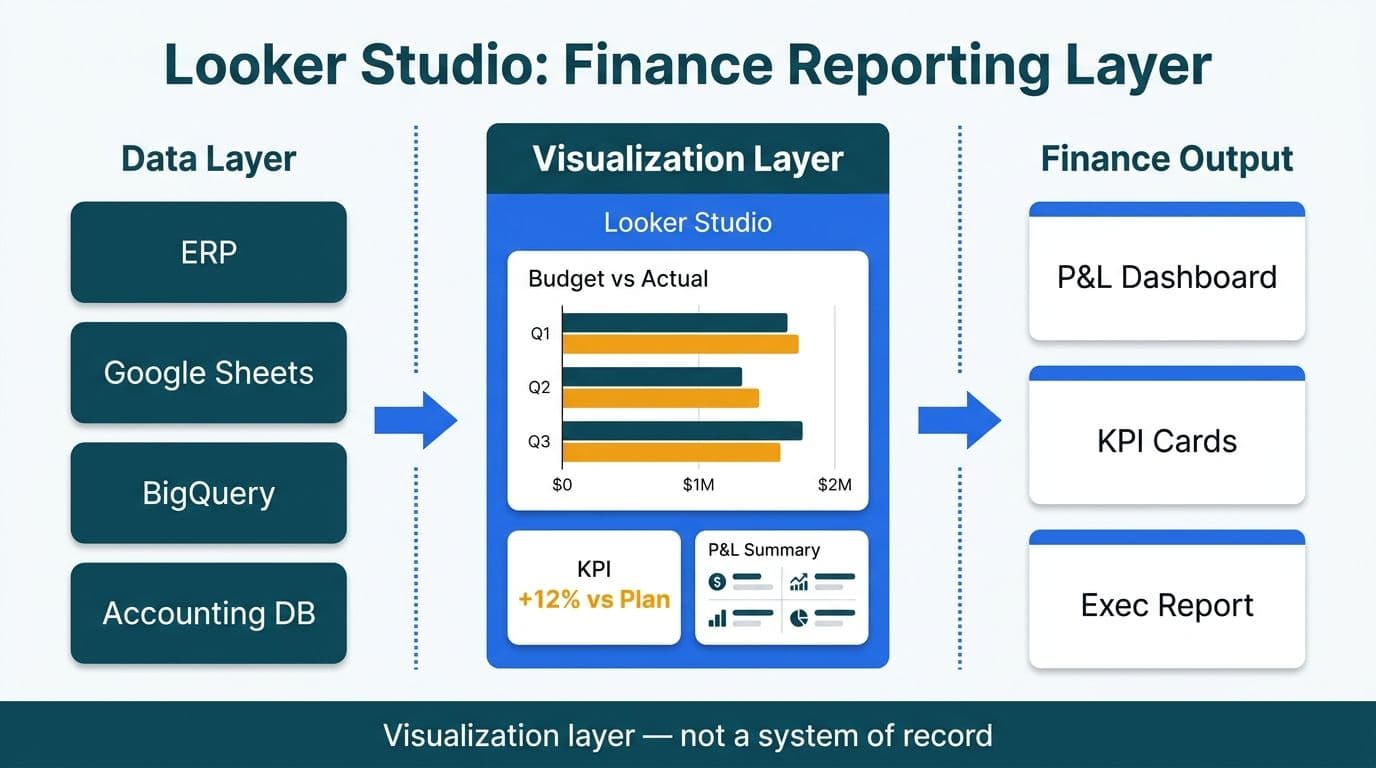
Looker Studio can serve as a practical reporting layer for mid-market finance teams covering P&L, budget-vs-actual, and KPI dashboards - provided the data architecture underneath it is sound and compliance obligations are addressed explicitly. The platform connects to most ERP and accounting systems through native and partner connectors, but finance directors should treat it as a visualization and distribution layer, not a financial system of record. That architectural distinction shapes every implementation decision.
Key Takeaways
Looker Studio connects natively to Google Sheets and BigQuery, with 800+ partner connectors covering QuickBooks, Xero, NetSuite, Salesforce, and most major ERP platforms.
SOX-regulated US companies must pair Looker Studio with external audit trail controls - the platform does not provide SOX-grade audit logging natively.
GDPR and PIPEDA affect data residency and processing agreements; UK/EU and Canadian finance teams must confirm connector data flows before deployment.
Budget-vs-actual reporting works well in Looker Studio when actuals and budget data share a consistent chart of accounts structure.
Finance directors should evaluate Looker Studio alongside their existing BI stack - it excels at rapid dashboard delivery and Google Workspace integration, while complex multi-entity consolidation requires a dedicated upstream tool.
What Data Sources Connect Natively to Looker Studio for Finance Reporting?
Looker Studio's native connectors cover Google's own ecosystem: Google Sheets, BigQuery, Google Analytics 4, Google Ads, and several Google Cloud services. For finance teams already using Google Workspace, this means a budget spreadsheet in Sheets can feed a live dashboard within minutes - no ETL pipeline required for straightforward use cases.
Beyond native connectors, the Looker Studio partner connector marketplace (documented by Google, 2026) lists more than 800 third-party integrations. Connectors relevant to finance reporting include:
QuickBooks Online - general ledger, accounts payable and receivable, trial balance exports
Xero - P&L, balance sheet, and cash flow statement data
NetSuite - multi-entity GL exports via SuiteAnalytics Connect or scheduled saved searches
Salesforce - pipeline and closed-won revenue for sales-finance alignment
Sage Intacct - project-based accounting and multi-dimensional GL reporting
Stripe and Chargebee - subscription revenue, MRR, and churn data for SaaS finance teams
Most finance-oriented connectors are built by third-party vendors rather than the accounting platforms themselves. Connector reliability, data refresh frequency, and schema stability vary by vendor. For a US SaaS finance team running monthly close cycles, testing your specific GL structure against a connector before go-live is essential - schema mismatches between the connector and the chart of accounts are the most common root cause of incorrect dashboard figures.
Where native or partner connectors fall short - as often happens with on-premise ERP systems or heavily customized NetSuite instances - the cleanest path is to push financial data into BigQuery first via a structured data pipeline, then connect Looker Studio to BigQuery. This improves query performance on large transaction datasets and establishes a single version of the truth for cross-functional reporting.
Our Certified Looker Studio consulting team evaluates connector fit as the first step of every finance engagement, because a mismatched data source is the most common root cause of incorrect numbers in a live dashboard.
How Does Looker Studio Handle P&L, Budget-vs-Actual, and KPI Reporting?
Looker Studio is a visualization and data blending platform - it does not contain a financial calculation engine, XBRL taxonomy, or GAAP-formatted reporting module. Finance directors who understand this distinction will structure implementations that succeed; those who treat it as a financial application will encounter avoidable gaps.
Profit and Loss Reporting
A P&L in Looker Studio is built by connecting a structured data source that already contains categorized revenue and expense lines. Looker Studio handles layout, filtering, and visual presentation. Calculated fields handle derived metrics: gross margin, EBITDA margin, and period-over-period variance. The platform supports Looker Studio string functions (REGEXP_MATCH, SUBSTR, CONCAT) for account code parsing when your chart of accounts uses structured alphanumeric codes - useful when a single GL export must be segmented by department prefix or cost center code.
The key limitation: multi-entity consolidation with currency conversion must be handled upstream in BigQuery or your ERP. Looker Studio does not natively support intercompany eliminations, and attempting to build that logic in calculated fields leads to brittle, hard-to-audit reports.
Budget-vs-Actual Reporting
This is where Looker Studio shows genuine practical strength for mid-market finance teams. The standard architecture pairs actuals from your accounting system (via connector or BigQuery) with a budget file maintained in Google Sheets. Looker Studio's data blending joins these on a shared dimension - typically account code and fiscal period - and calculated fields compute variance and variance percentage automatically.
A UK fintech firm with a 12-month rolling budget can maintain the budget in Sheets, pull actuals from Xero via connector, and publish a live budget-vs-actual dashboard accessible to department heads - without manual Excel exports or reconciliation runs. Date range controls let stakeholders view YTD, QTD, or any custom window without requiring BI developer involvement.
One prerequisite: the chart of accounts structure must be consistent between the actuals source and the budget file. Mismatched account codes are the single most common cause of incorrect variance figures. Establish and document a canonical account mapping before building the dashboard.
KPI Dashboards
Looker Studio's scorecard and time series components handle standard finance KPIs well: revenue, gross margin, operating expenses, EBITDA, DSO (days sales outstanding), DPO (days payable outstanding), and cash conversion cycle. Conditional formatting - traffic-light coloring on variance thresholds - is configurable without custom code and updates dynamically as underlying data refreshes.
For US healthcare finance teams, the same architecture supports revenue cycle KPIs (net collection rate, denial rate, days in A/R) alongside standard P&L metrics. PHI must not flow into the reporting layer unless appropriately de-identified or covered by a Business Associate Agreement with Google.
What Are the GDPR and SOX Compliance Implications of Looker Studio for Finance?
Compliance is where many finance director evaluations stall - and rightly so. The answer depends on jurisdiction, industry, and how the data flow is architected. Looker Studio is not itself a compliance-certified financial system, but it can operate within a compliant architecture when controls are applied at the right layer.
SOX Compliance (US Public Companies and Their Subsidiaries)
Sarbanes-Oxley requires that financial reporting systems maintain audit trails, enforce segregation of duties, and prevent unauthorized data modification. Looker Studio is a reporting layer, not a system of record, so the primary compliance burden falls on source systems - your ERP and data warehouse - rather than on Looker Studio itself.
What Looker Studio does provide: report-level sharing permissions, Google Workspace user-level access control, and viewer credentials settings that restrict which underlying data a given viewer can query. What it does not provide: immutable audit logs of who viewed which report and when, or version tracking on calculated field definitions. Google Cloud and Google Workspace carry their own compliance certifications; verify the current certification scope in Google's compliance documentation before relying on those certifications for SOX purposes.
For a SOX-regulated US company, the practical path is: maintain financial data integrity in your ERP and BigQuery with documented controls, apply SOX-grade access and change-management controls at the data layer, and use Looker Studio strictly as a read-only reporting interface with documented access control policies. Our AI Automation Compliance Checklist for Finance Teams covers the governance framework that should surround any BI deployment in regulated environments.
GDPR (UK and EU Organizations)
Post-Brexit, UK organizations operate under the UK GDPR (administered by the ICO), while EU entities fall under the original GDPR. In finance reporting, personal data surfaces in payroll dashboards, vendor contact records, and customer invoice data - each of which requires a lawful basis for processing and appropriate safeguards.
Key questions for a UK fintech firm or EU-based finance team evaluating Looker Studio: Where does each connector cache or store data in transit? Third-party connectors may route data through servers outside your preferred jurisdiction. Does your Data Processing Agreement with Google cover Looker Studio specifically? And are EU data residency requirements met? BigQuery supports EU multi-region storage; verify dataset location settings before connecting to Looker Studio.
Finance reports showing only aggregated figures carry minimal GDPR exposure. Payroll and vendor payment dashboards require a deliberate data minimization review before deployment.
PIPEDA and Provincial Privacy Law (Canada)
Canadian finance directors face PIPEDA at the federal level and, in Quebec, Law 25 - which resembles GDPR in its consent and breach notification requirements. A Canadian manufacturing company using Looker Studio for plant-level P&L reporting, with BigQuery hosted in a US region, should document that cross-border data transfer under its privacy framework. Hosting BigQuery in the northamerica-northeast1 (Montreal) or northamerica-northeast2 (Toronto) region eliminates the cross-border transfer concern for most standard finance reporting use cases.
HIPAA (US Healthcare Organizations)
For organizations subject to HIPAA, Looker Studio reports must not display PHI unless Google has signed a Business Associate Agreement covering the specific services in use. Finance KPIs derived from de-identified claims data - total revenue by service line, denial rates by payer - carry no PHI risk and are appropriate for Looker Studio dashboards without additional controls. Our HIPAA Compliant BI Tools guide covers the broader selection framework for healthcare finance teams balancing reporting capability against compliance requirements.
When Should Finance Directors Choose Looker Studio for Finance Reporting?
The right tool depends on use case complexity, existing infrastructure, and team capability. The table below maps common finance reporting scenarios to Looker Studio's suitability.
| Reporting Scenario | Looker Studio Fit | Notes |
|---|---|---|
| Budget-vs-actual (single entity) | Strong | Native data blending; Sheets + connector architecture works well |
| KPI scorecards and executive dashboards | Strong | Fast to deploy; embeds in Google Sites or custom portals |
| P&L reporting (single entity, GAAP) | Moderate | Requires structured source data; no built-in financial formatting |
| Multi-entity consolidation | Weak | Intercompany eliminations must be handled upstream |
| Regulatory filing (10-K, XBRL) | Not applicable | Not a financial reporting platform |
| Payroll and HR cost dashboards | Moderate | GDPR/PIPEDA data minimization review required |
| Revenue cycle reporting (US healthcare) | Moderate | BAA and PHI de-identification steps required |
| Real-time treasury and cash position | Moderate | Depends on data source refresh cadence |
Finance directors already invested in Google Workspace and Google Cloud will find the integration path shorter, and the total cost of ownership lower, than with alternative approaches. Teams on Microsoft-centric infrastructure may find their existing BI environment offers tighter native integration with their data warehouse - though Looker Studio can still function as a lightweight supplementary reporting layer in mixed environments where different teams use different tools.
For teams weighing the build-vs-buy decision on finance analytics capability, our guide on outsourcing finance analytics consulting covers when external expertise accelerates time-to-value versus building an in-house capability.
How Does Looker Studio Compare to Power BI for Finance Reporting?
Finance directors conducting a formal BI evaluation most commonly frame the platform decision as looker studio vs power bi for finance reporting. Both are mature platforms with substantial finance use cases and active enterprise adoption, but they differ in ways that affect licensing cost, ERP connector strategy, report governance workflow, and where compliance controls sit in the architecture. The scorecard below covers the dimensions finance directors weigh most at the selection stage.
| Dimension | Looker Studio (Free) | Looker Studio Pro | Power BI Pro |
|---|---|---|---|
| License cost | Free | Per workspace/month - verify current rate at Google Cloud pricing page | Per user/month - verify current rate at Microsoft pricing page |
| ERP and accounting connectors | 800+ partner connectors: QuickBooks, Xero, NetSuite, Sage Intacct, and others | Same as free tier | Native connectors for Dynamics 365 Finance and SAP; certified connectors for QuickBooks, Xero, and others |
| Collaboration and report governance | Share via Google link; report-level viewer permissions | Team workspaces; organization-level management controls | Workspaces with role-based access; deployment pipelines for dev/test/prod promotion |
| Google Workspace integration | Native | Native | Requires connector or export step |
| Microsoft 365 integration | Requires connector | Requires connector | Native: Excel, Teams, SharePoint, Dynamics 365 |
| GDPR data residency | BigQuery EU multi-region; DPA with Google | Same as free tier | EU Data Boundary; Azure EU region; DPA with Microsoft |
| HIPAA | BAA required from Google; PHI controls applied upstream in BigQuery | Same as free tier | BAA available from Microsoft; same upstream PHI control requirement applies |
| PIPEDA (Canada) | BigQuery Montreal or Toronto region eliminates cross-border transfer for most use cases | Same as free tier | Azure Canada Central or East region; same residency approach |
| SOX | Access and change controls delegated to BigQuery layer; no native immutable audit log | Same as free tier | Row-level security in Power BI service; audit logs available via Microsoft Purview (requires additional licensing) |
Several dimensions warrant context beyond the table cells:
Cost model: Looker Studio's free tier covers most internal finance reporting needs for mid-market teams. Power BI Pro's per-user licensing scales with headcount - distributing dashboards to department heads across a large organization carries a meaningfully different cost profile than a small finance team. Evaluate against your actual distribution requirements, not a theoretical maximum audience.
ERP connector strategy: Both platforms reach the major ERP and accounting systems, but the path differs. Looker Studio's finance-relevant connectors are primarily third-party and carry the reliability and schema-stability caveats described earlier in this guide. Power BI's native integrations with the Microsoft ERP ecosystem run deeper, which matters most for organizations on Dynamics 365 Finance or Azure SQL. For finance teams on non-Microsoft ERP - NetSuite, Sage Intacct, Xero - the practical connector gap between the two platforms narrows considerably.
Collaboration and governance: Power BI's deployment pipeline model provides structured promotion of reports from development through to production, with change tracking relevant for finance teams managing report lifecycle under SOX or internal audit scrutiny. Looker Studio Pro's team workspaces address multi-team management for Google-centric organizations, but the pipeline governance tooling is less mature as of mid-2026.
Compliance architecture: Both platforms support GDPR, HIPAA, and PIPEDA through data residency controls and BAA availability - the structural difference is where those controls sit. Looker Studio delegates most compliance enforcement to BigQuery, a deliberate design choice that integrates well for teams already running a Google Cloud data stack. Power BI's compliance controls are more integrated within the Power BI service itself, which can reduce the data engineering overhead for teams that do not already maintain a BigQuery environment.
The selection criterion that resolves most evaluations: if the organization runs Google Workspace and Google Cloud, Looker Studio reduces integration overhead and total cost of ownership. If the finance team is embedded in a Microsoft-centric environment - Azure data warehouse, Dynamics 365 or SAP ERP, Teams for collaboration - Power BI requires less integration work. Neither platform replaces the need for sound data architecture upstream, and neither provides SOX-grade audit logging natively without additional tooling at the data layer.
How Do You Build a Finance Reporting Architecture That Earns Stakeholder Trust?
The difference between a finance dashboard that earns trust and one that creates confusion is almost always data architecture, not dashboard design.
A real engagement illustrates the risk: an events production company had two reports showing different revenue figures, and no one could determine which was correct. When we reconciled them, the grand totals matched exactly - the only real difference was 34 filler rows from different date windows in the source pull. The dispute was never about the data; it was about inconsistent query logic upstream. The same failure mode appears regularly in Looker Studio implementations where the same metric is defined differently across two reports built by different analysts at different times.
The architecture that prevents this:
Step 1 - Establish a single source of truth. Push financial data into a dedicated layer (BigQuery for most mid-market teams, or a well-structured Google Sheet for smaller organizations). All Looker Studio reports connect to this layer, not directly to the accounting system. Connector schema changes cannot then silently break reports in production.
Step 2 - Define a canonical metric library. Before building dashboards, document your metric definitions: how is gross margin calculated, which accounts are included in operating expenses, and which date field drives the fiscal period filter. Looker Studio calculated fields should implement these definitions consistently across all reports. Version-controlling those definitions - even in a shared document - prevents the two-reports-two-numbers problem from recurring.
Step 3 - Apply access controls at the data layer. Use BigQuery's column-level or row-level security policies to govern which financial data each viewer can access. Report-level permissions in Looker Studio are a second line of defense, not a substitute. This matters most for SOX-regulated companies and organizations with sensitive data - executive compensation, M&A activity, or board-level forecasts - colocated in the same BigQuery dataset as operational finance data.
Step 4 - Label every report with the data-as-of timestamp. Finance stakeholders need to know whether they are viewing data as of this morning's connector sync, last night's batch run, or month-end close. Looker Studio's TODAY() and NOW() functions support dynamic date labels in report headers, removing the guesswork that leads to misplaced urgency over stale figures.
What Does Looker Studio Cost for Finance Reporting Implementation?
Looker Studio (the report-building interface) is free. Looker Studio Pro adds team workspaces, organization-level management controls, and SLA-backed support at a per-workspace monthly fee; verify current pricing on Google's official pricing page, as rates are updated periodically. For most mid-market finance teams, the free tier is sufficient for internal reporting. Pro becomes relevant when the organization manages dozens of reports across multiple teams or delivers branded dashboards to board members, auditors, or external stakeholders.
Implementation cost is separate from licensing. A well-architected finance reporting solution - data pipeline design, BigQuery setup, metric library documentation, and a suite of P&L, budget-vs-actual, and KPI dashboards - typically requires 40 to 120 hours of professional services depending on source system complexity, number of reporting entities, and compliance requirements. Use our instant project cost calculator to get a range specific to your configuration.
---
About Lets Viz: Lets Viz has delivered data analytics and BI implementations since 2020, serving US healthcare systems, UK fintech firms, Canadian manufacturers, and global SaaS businesses. The team holds a 5.0 Clutch rating and specializes in compliance-aware implementations - from HIPAA-adjacent healthcare dashboards to SOX-aware finance reporting stacks built on Google Cloud and Microsoft Azure.
Ready to evaluate Looker Studio for your finance team? Our Certified Looker Studio consulting practice covers data source assessment, compliance architecture, and end-to-end dashboard delivery for mid-market finance organizations across the US, UK, and Canada.