Looker Studio Ecommerce Dashboard: Shipping & Fulfilment Guide
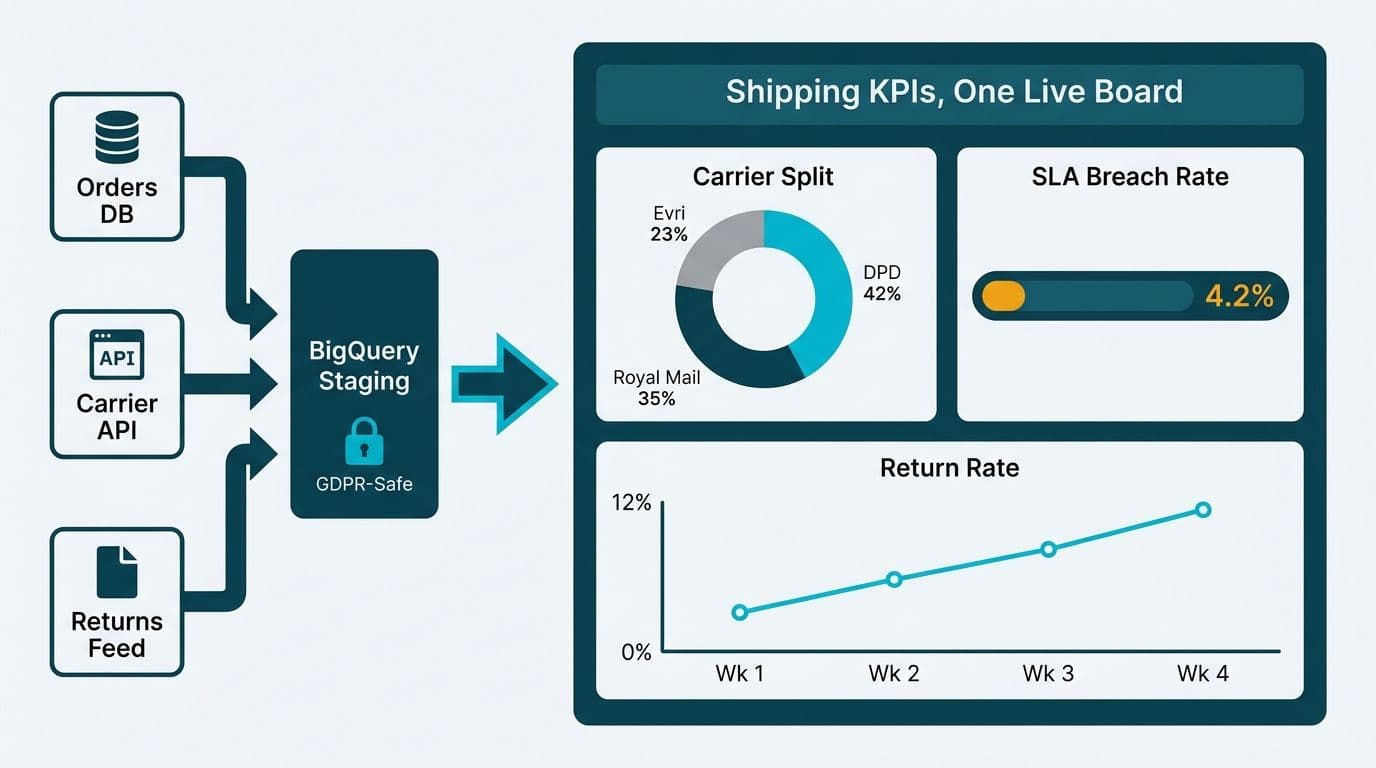
A Looker Studio ecommerce dashboard for shipping and fulfilment centralises carrier split, SLA breach rate, and return rate in a single live view. Connect your data through GDPR-compliant staging - BigQuery or a certified partner connector rather than direct API pulls - for any UK or EU customer records in the pipeline. The result is a board-ready operational report your logistics and finance teams can act on daily.
Key Takeaways
- Carrier split, SLA breach rate, and return rate are the three core KPIs for a Looker Studio ecommerce shipping and fulfilment dashboard.
- UK and EU operators must stage shipping data through GDPR-compliant infrastructure - BigQuery or a certified partner connector - before it reaches Looker Studio.
- Canadian organisations processing cross-border shipping data should apply PIPEDA's accountability principles to all third-party connector choices.
- Nulls stored as zeros in order data silently corrupt SLA breach rate calculations - validate at the source before building any metric.
- For production-scale operations, a BigQuery staging layer outperforms Looker Studio's built-in data blending on large shipment datasets.
What Metrics Should a Looker Studio Ecommerce Shipping Dashboard Track?
A shipping performance dashboard is only as useful as the KPIs it exposes. The three metrics that consistently matter most to operations and finance teams are carrier split, SLA breach rate, and return rate - each answering a distinct operational question.
Working with a Certified Looker Studio consulting partner before connecting any data source helps you define the right metric set upfront - preventing the common mistake of measuring what is easy to pull rather than what drives decisions.
Carrier split shows the proportion of shipments handled by each carrier over a selected period. It reveals whether volume is dangerously concentrated in one provider and supports rate-renegotiation conversations. In Looker Studio, this is a bar chart or donut chart built from a carrier name dimension and a shipment count metric.
SLA breach rate measures the percentage of orders delivered outside the promised window. A sustained high breach rate correlates directly with customer churn, increased returns, and elevated customer service workload. The calculation is: (orders delivered late / total orders shipped) x 100. The accuracy of this figure depends entirely on the integrity of timestamps in your source data - a topic covered in the SLA section below.
Return rate tracks the share of delivered orders subsequently returned. Finance directors use this alongside gross margin data to understand the true cost of fulfilment. A return rate broken down by carrier and product category reveals whether a carrier's handling practices are generating damage-driven returns, or whether the problem sits upstream in product fit.
Additional metrics worth surfacing on secondary dashboard tabs include transit time by carrier, first-scan delay (time from label creation to first carrier scan), hub-level dwell time for multi-leg shipments, and cost per shipment by carrier if your finance system feeds into the same pipeline.
For teams already using Looker Studio for finance reporting, a shipping dashboard extends naturally into the same workspace, allowing cost-of-fulfilment to flow alongside margin and revenue data in a single CFO-ready view.
How Do You Set Up GDPR-Compliant Data Connectors for Looker Studio?
This is where shipping dashboards become more complex for UK and EU operators - and where shortcuts create legal exposure. Looker Studio connects to data through connectors: native Google connectors (Sheets, BigQuery, GA4) or third-party partner connectors.
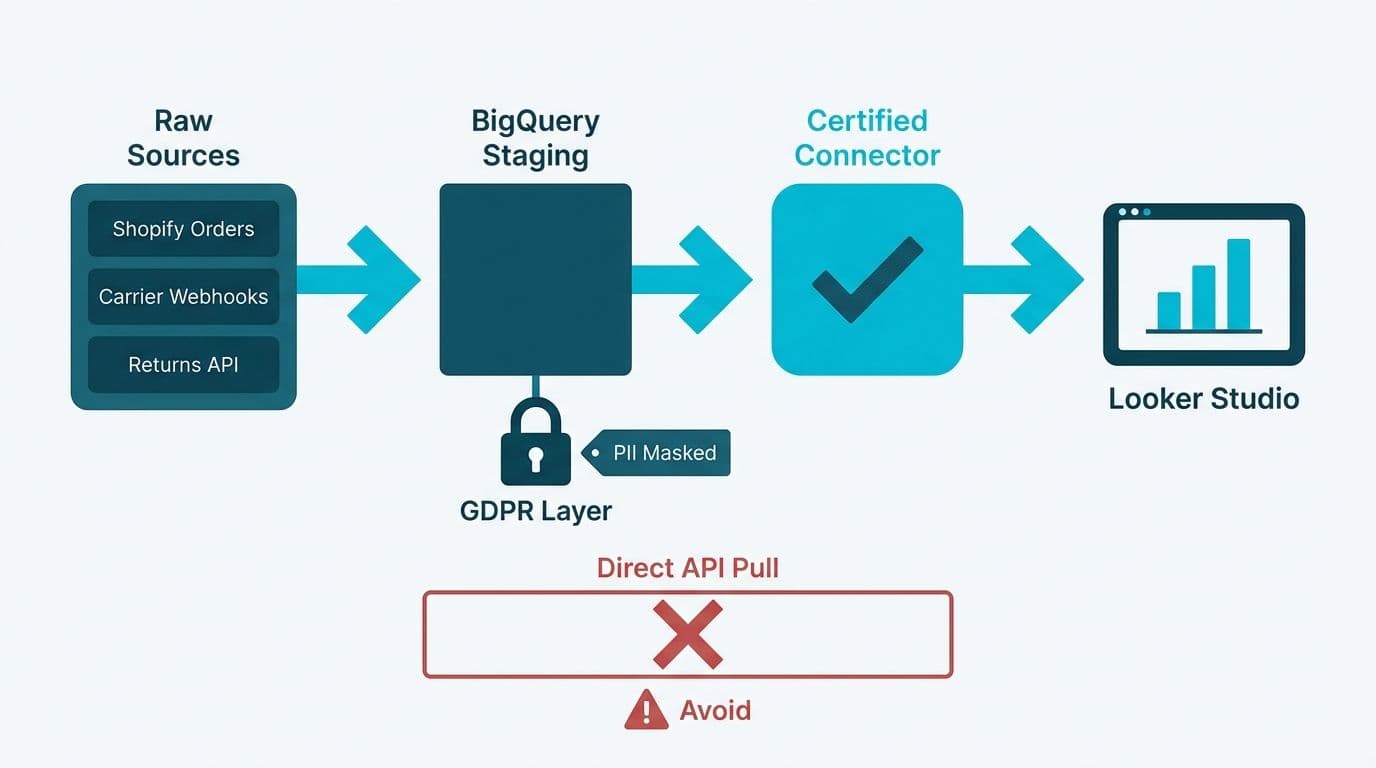
For GDPR compliance, the core issue is data residency and lawful transfer. Customer-identifiable shipping records - name, delivery address, order ID - constitute personal data under GDPR (EU Regulation 2016/679) and UK GDPR. Pulling this data directly from a carrier API into Looker Studio via an uncertified connector routes personal data outside the controlled data environment and may lack a valid transfer mechanism.
The recommended architecture for UK and EU operators:
1. Stage shipping data in BigQuery (Google Cloud region `europe-west2` for UK data, `europe-west1` or `europe-west4` for EU data) using a scheduled export or ETL pipeline from your order management system.
2. Anonymise or pseudonymise customer records at the staging layer - retain order ID and postcode district for geographic analysis, but strip full addresses and customer names before they reach Looker Studio.
3. Connect Looker Studio to BigQuery using the native BigQuery connector, covered by Google's Data Processing Addendum (DPA, 2025).
4. If using a third-party connector, verify it appears in Google's Partner Connectors directory and that the vendor has executed a Data Processing Agreement covering your specific data types.
For Canadian organisations, PIPEDA's accountability principle (Personal Information Protection and Electronic Documents Act, Schedule 1, Principle 1) requires contractual protections for any third party handling personal data. A US-based connector vendor must provide equivalent safeguards - review their sub-processor list and data transfer agreements before connecting Canadian customer records.
US teams in healthcare supply chain or pharmaceutical distribution should determine whether shipping records link to protected health information. If a shipment connects an order to a patient - for example, home delivery of durable medical equipment - HIPAA's Business Associate Agreement requirements apply to every pipeline component: ETL tool, BigQuery dataset, and Looker Studio workspace. For financial services teams, SOC 2 Type II certification of any third-party connector is a reasonable minimum control.
For a full comparison of connector options by cost and compliance posture, see our guide to Looker Studio data connectors: free vs paid.
How Do You Build Carrier Split Analysis in a Looker Studio Dashboard?
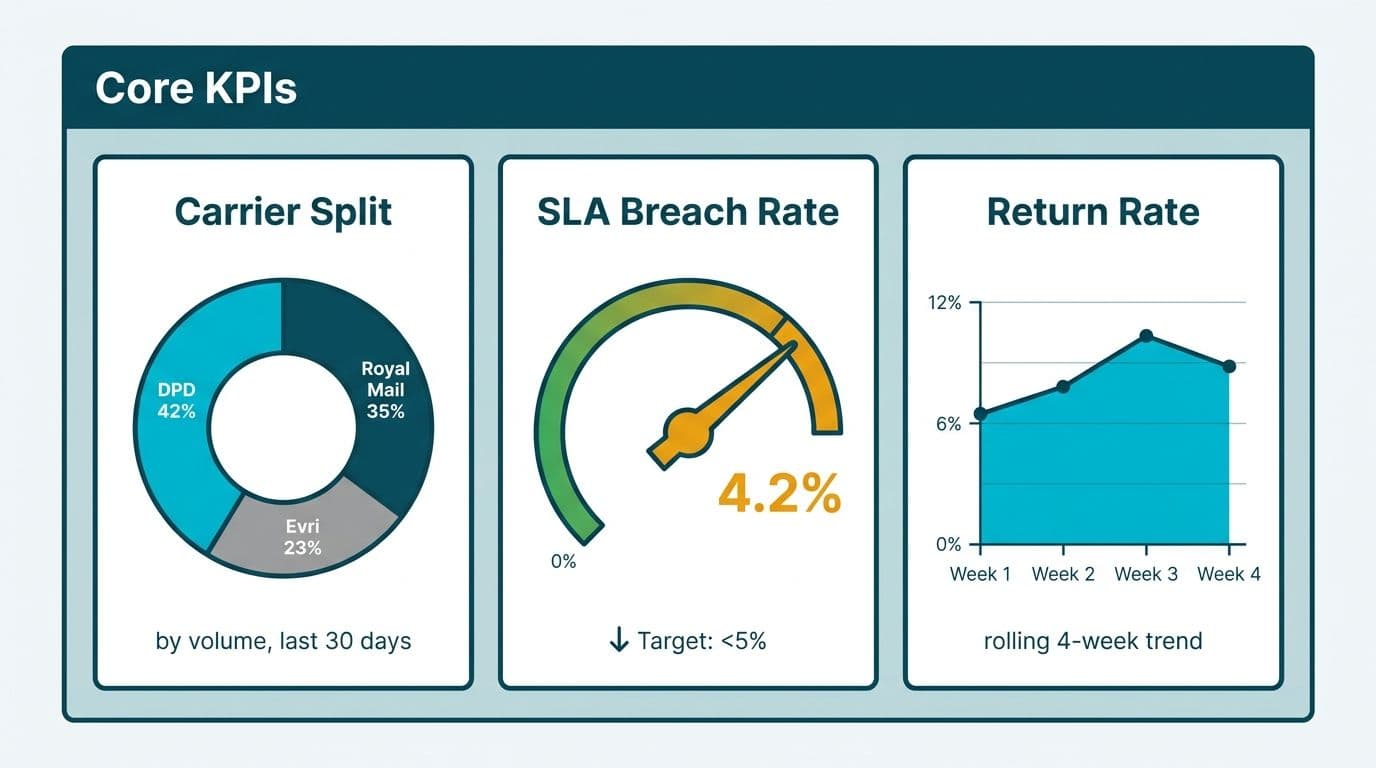
Carrier split analysis requires a carrier name dimension in your source data. Most order management systems export this field natively. If your data originates from a warehouse management system, verify that carrier assignment is recorded at the shipment level rather than only at the order level - a single order may involve multiple carriers for different line items.
In Looker Studio, build the carrier split chart in five steps:
1. Add a Bar chart or Pie chart to your canvas.
2. Set Dimension to `carrier_name`.
3. Set Metric to `COUNT(shipment_id)`.
4. Add a Date Range Control linked to your `ship_date` field for period filtering.
5. Add `delivery_status` as a secondary dimension to create a stacked view showing each carrier's on-time versus late proportion within its volume share.
This pattern - stacked bar for dimensional breakdown, scorecard for headline numbers, date control for period filtering - is the same structure used across Looker Studio sales pipeline dashboard examples and transfers directly to shipping operations. A carrier with 40% of your volume and a 20% SLA breach rate is a more urgent problem than a carrier with 5% of volume and the same rate; the stacked view makes that immediately visible in a weekly operations review.
| Data Source | Setup Effort | GDPR Suitability | Real-Time Capable | Best For |
|---|---|---|---|---|
| Google Sheets (manual export) | Low | Medium | No | Small teams, fewer than 5,000 shipments/month |
| BigQuery (staged ETL) | High | High | Near real-time | Mid-market and enterprise |
| Partner connector (direct carrier API) | Medium | Varies by vendor | Yes | Teams without a data warehouse |
| PostgreSQL or MySQL via SQL | Medium | High (self-hosted) | No (scheduled refresh) | Teams with existing OMS databases |
For teams connecting through SQL sources, our guide to connecting SQL to Looker Studio covers PostgreSQL, MySQL, and BigQuery connection patterns in detail, including credential management and refresh scheduling.
What Is SLA Breach Rate and How Do You Calculate It in Looker Studio?
SLA breach rate is the proportion of orders delivered after the contractually promised date. It is the headline accountability metric for carrier performance reviews and the trigger for penalty clause calculations in enterprise carrier contracts.
In Looker Studio, create a calculated field in your data source:
```
(COUNT_IF(delivery_status = "late") / COUNT(shipment_id)) * 100
```
If your source stores timestamps rather than a pre-labelled delivery status:
```
(COUNT_IF(actual_delivery_date > promised_delivery_date) / COUNT(shipment_id)) * 100
```
The critical data quality check before building this metric: time-based metrics are highly vulnerable to how source systems handle records where a final event has not yet occurred. A home-services client's support dashboard showed excellent first-response times - until we found that their platform stored `0 hours` rather than null for tickets that had never received a response, making every ignored ticket count as instant resolution. We rebuilt the metric on real event data and validated it row-for-row across 105,704 tickets before going live.
The same failure mode applies directly to shipping SLA calculations. If your OMS stores a sentinel date (`1900-01-01` or a far-future placeholder) rather than NULL for `actual_delivery_date` on shipments still in transit, those orders register as on-time deliveries - pushing breach rate artificially low. Before building the metric, audit your date fields for unexpected value distributions and zero-timestamp patterns. Remediate sentinel values at the source or filter them out in the BigQuery staging layer before the field reaches Looker Studio.
Visualise SLA breach rate as a Scorecard for the period headline and a Time Series chart for weekly trend - so stakeholders can see whether carrier performance is improving or deteriorating, not just the current snapshot.
How Do You Track Return Rate in a Looker Studio Ecommerce Fulfilment Dashboard?
Return rate requires a returns events table joined to the original shipment records. Most ecommerce platforms expose return events via API or database export, with `order_id` as the standard join key.
For a production dashboard, pre-aggregate the join in BigQuery rather than relying on Looker Studio's data blending:
```sql
SELECT
s.carrier_name,
s.product_category,
COUNT(s.shipment_id) AS total_delivered,
COUNT(r.return_id) AS total_returned,
ROUND(COUNT(r.return_id) / COUNT(s.shipment_id) * 100, 2) AS return_rate_pct
FROM shipments s
LEFT JOIN returns r ON s.order_id = r.order_id
WHERE s.delivery_status = 'delivered'
GROUP BY 1, 2
```
This pre-aggregated view connects to Looker Studio as a single table, avoiding query performance degradation that blended sources encounter on datasets above 50,000 rows.
Surface return rate as a Scorecard for the overall period rate alongside a Table broken down by carrier and product category. Finance directors can then distinguish carrier-driven returns (high rate on one carrier across all categories) from product-fit returns (high rate on one category across all carriers) - two problems with different remedies and different cost implications.
Note that return rate and refund rate are distinct metrics. Return rate measures physical returns; refund rate captures total financial exposure including orders refunded without a physical return - lost-in-transit claims, damage settlements. A complete fulfilment dashboard should surface both.
What Changes for Healthcare and Finance Teams Building Shipping Dashboards?
US healthcare supply chain teams managing medical device or pharmaceutical distribution face additional data governance requirements at the dashboard layer. If any shipment record links to a patient - for example, home delivery of durable medical equipment or specialty pharmacy orders - that record constitutes protected health information under HIPAA. Every pipeline component including ETL tools, BigQuery datasets, and Looker Studio workspaces must be covered by a Business Associate Agreement. Google's standard BAA for Google Cloud and Workspace covers BigQuery and Looker Studio (Google HIPAA implementation guide, 2025).
For UK fintech teams, shipping data for physical cards, statements, or financial credentials intersects with UK GDPR and FCA operational resilience requirements. SLA breach rate takes on regulatory significance when delivery failures affect customer access to financial services. A card issuance team unable to demonstrate delivery SLA performance may face scrutiny under the FCA's operational resilience framework. The shipping dashboard belongs in the operational resilience MI pack, not treated as a logistics side project.
Canadian operations teams should note that PIPEDA governs federally regulated industries - banking, telecoms, and interprovincial transport - and applies to personal data crossing provincial or national borders. A Canadian retailer shipping cross-border to the US must confirm the US carrier's data handling meets PIPEDA's accountability standard. Our compliance comparison guide covering HIPAA, GDPR, and PIPEDA in enterprise technology deployments provides a useful cross-jurisdictional reference for teams navigating multiple regulatory regimes simultaneously.
Building the Dashboard in Phases: A Practical Checklist
A phased approach prevents the most common mistake: connecting data before it has been validated.
Phase 1 - Data audit (1-2 weeks): Identify source tables for shipments, orders, returns, and carrier events. Profile null and sentinel values in `actual_delivery_date` and `delivery_status`. Standardise carrier name variants - the same carrier frequently appears under multiple name strings across OMS and carrier system exports.
Phase 2 - Staging layer (1-2 weeks): Build BigQuery staging tables with appropriate anonymisation for GDPR or PIPEDA compliance. Write and test carrier split, SLA breach rate, and return rate SQL queries. Validate row counts against the source system before connecting Looker Studio.
Phase 3 - Dashboard build (1 week): Build scorecards for the three headline KPIs. Add a carrier split bar chart with delivery status as a secondary dimension. Add a weekly SLA trend time series to show trajectory rather than a point-in-time snapshot. Add a return rate table by carrier and product category. Wire date range and carrier filter controls to all charts.
Phase 4 - Access control and documentation: Set Looker Studio sharing to Restricted rather than open link-sharing. Apply row-level security in BigQuery if the dashboard is shared with carrier partners. Document data lineage for internal audit purposes and, where required by GDPR or PIPEDA, for data protection impact assessment records.
---
About Lets Viz: Lets Viz is a data analytics consultancy serving US healthcare, UK fintech, Canadian manufacturing, and global SaaS clients since 2020, with a 5.0 Clutch rating. Our team designs and deploys production-grade Looker Studio dashboards that connect cleanly to enterprise data pipelines, pass compliance review, and earn the adoption of the operational teams they serve.
Ready to build a shipping performance dashboard your logistics leads and finance directors will rely on? Explore our Certified Looker Studio consulting services to see how we approach data quality, connector compliance, and dashboard design for mid-market operations teams.