HEDIS, QOF & CIHI Quality Measures Dashboard in Power BI
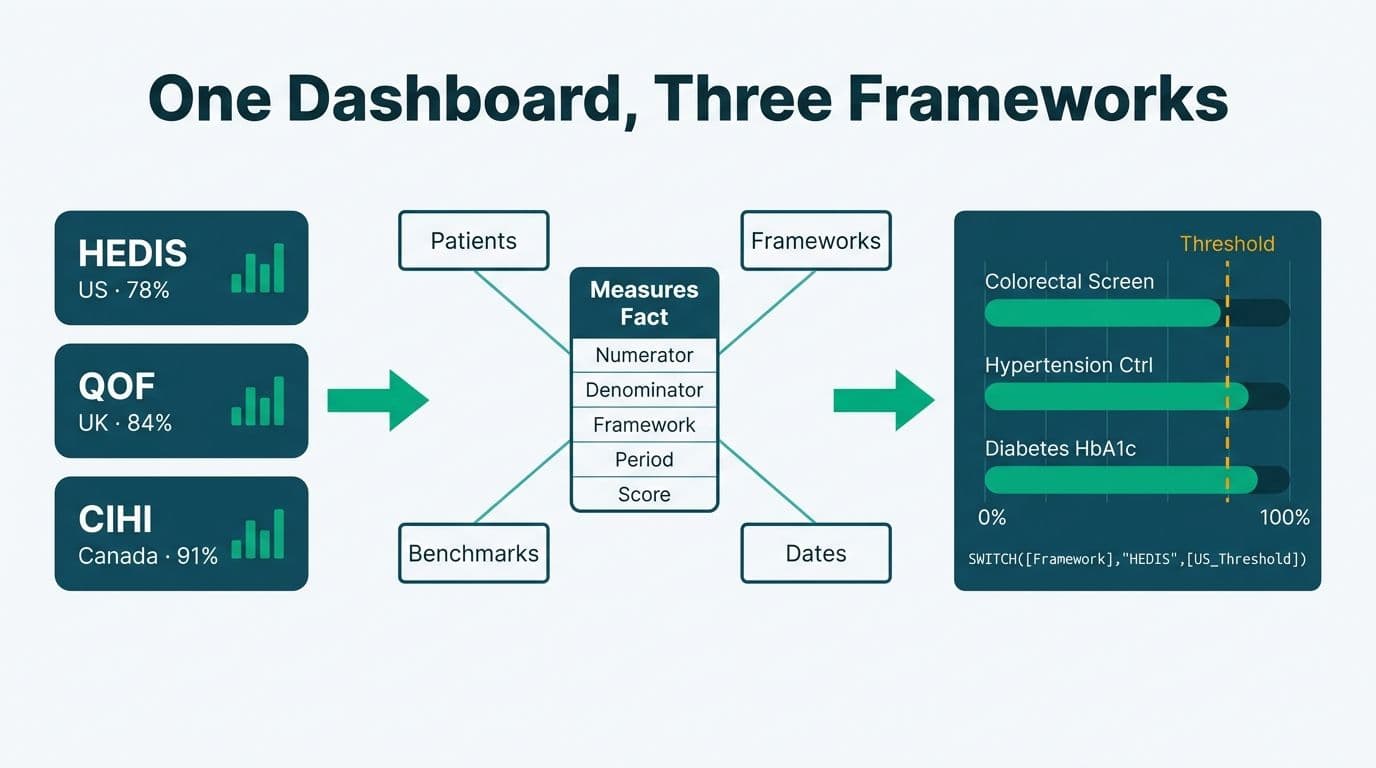
A unified clinical quality measures reporting dashboard in Power BI connects HEDIS (US), QOF (UK), and CIHI (Canada) into a single semantic model, letting hospital administrators and CIOs track measure performance, run automated benchmarking against national thresholds, and drill through to the patient cohorts behind every score - without rebuilding reports for each regulatory framework.
Key Takeaways
- HEDIS, QOF, and CIHI share numerator/denominator logic that maps cleanly to one Power BI star schema.
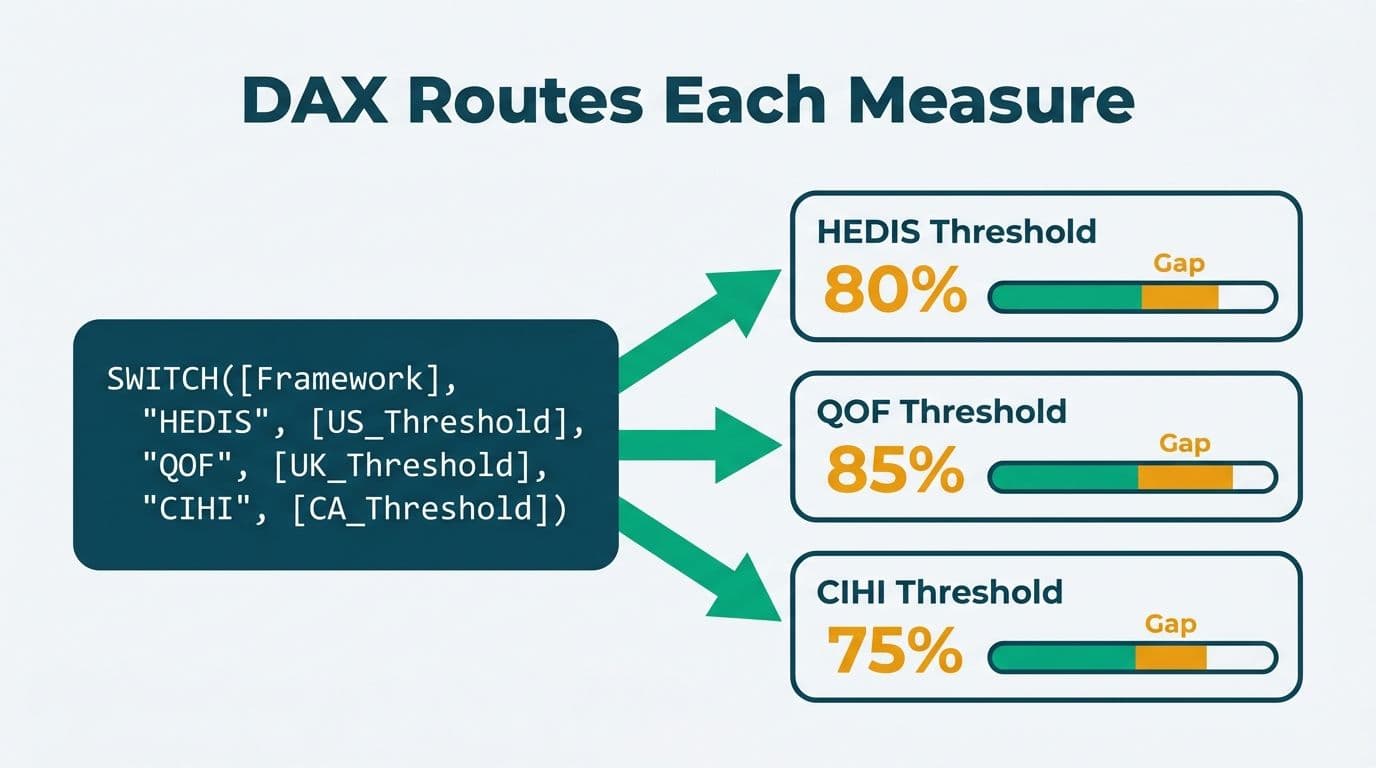
- A DAX `SWITCH` function routes each measure to its correct benchmark threshold, eliminating duplicate report pages.
- Row-level security and field-level controls satisfy HIPAA (US), GDPR (UK/EU), and PIPEDA (Canada) in a single dataset.
- Drill-through pages link aggregated measure scores to patient cohort records for root-cause investigation.
- A managed analytics service removes the overhead of tracking regulatory update cycles across three jurisdictions.
Lets Viz delivers Managed Power BI services for healthcare and finance teams -- fully managed analytics, from data model to decision-ready dashboard.
What Are HEDIS, QOF, and CIHI - and Why Is Unified Reporting So Hard?
Each framework defines clinical quality differently, which is what makes consolidation non-trivial. HEDIS (Healthcare Effectiveness Data and Information Set), maintained by NCQA, covers roughly 90 measures across preventive care, chronic disease management, and behavioral health in the US. QOF (Quality and Outcomes Framework) is the UK NHS primary-care incentive program comprising approximately 76 indicators scored against nationally set thresholds. CIHI (Canadian Institute for Health Information) publishes pan-Canadian indicators including the Hospital Standardized Mortality Ratio (HSMR) and Ambulatory Care Sensitive Conditions (ACSC) rate used by provincial health authorities.
The structural problem is definitional misalignment. A "diabetes patient with controlled HbA1c" is a HEDIS Comprehensive Diabetes Care (CDC) numerator member, a QOF DM017 numerator patient, and a CIHI Diabetes Indicator component - but the lookback window, eligible age band, and exclusion logic differ in each jurisdiction. A Power BI model that hard-codes a single framework produces the right numbers for one market and breaks when a health system operating across borders tries to compare rates.
The QOF framework has also evolved considerably since NHS England restructured primary care contracting in 2023, adding mental health and cardiovascular prevention indicators that parallel HEDIS behavioral health and lipid management measures. CIHI pan-Canadian indicators, meanwhile, are designed for population-level health system benchmarking rather than practice-level quality improvement - meaning the patient-level granularity available from CIHI is coarser than what HEDIS or QOF require at the denominator tier. This distinction affects how you structure the drill-through layer of the model.
The solution is a jurisdiction dimension in the data model, not three separate report files. Link a `Jurisdiction` table to your fact tables and let DAX handle the branching logic at measure calculation time.
How Do You Build a Unified Clinical Quality Measures Reporting Dashboard in Power BI?
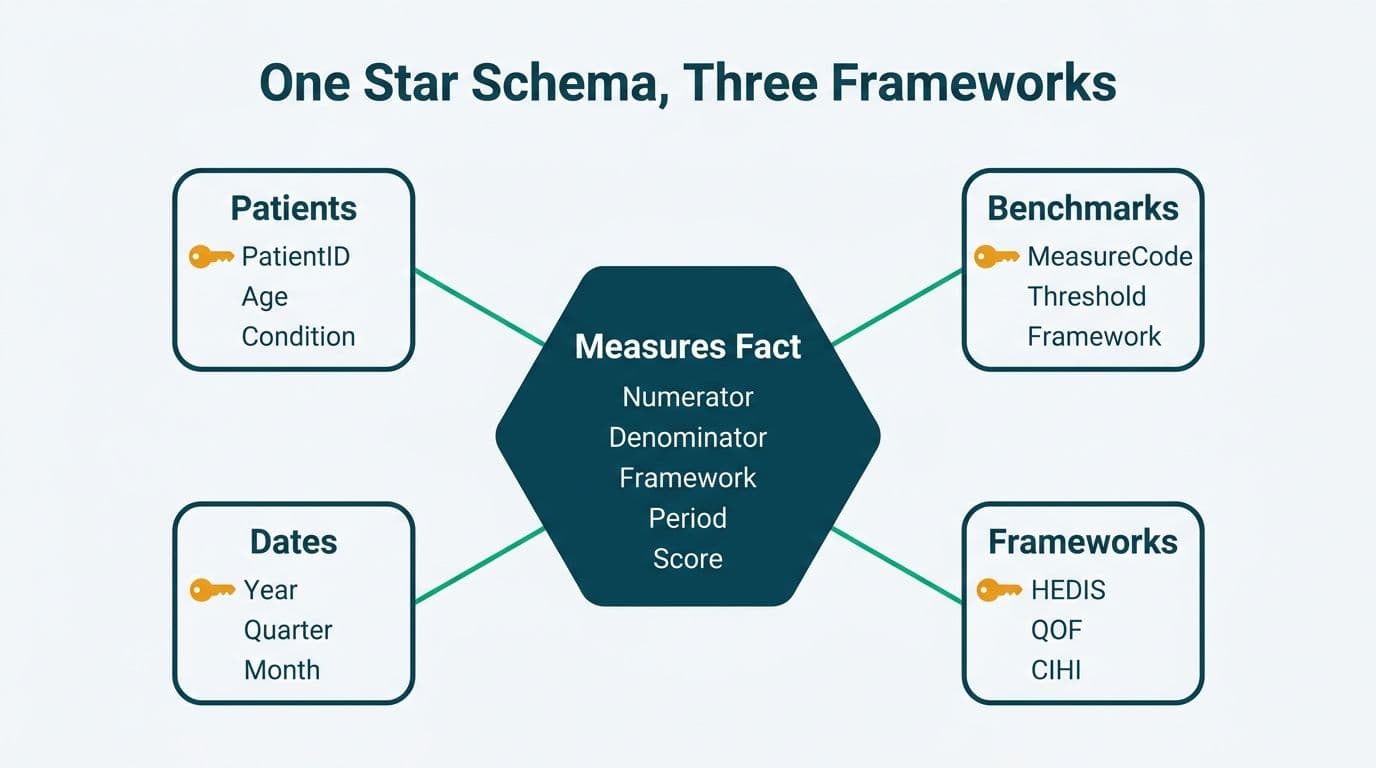
The foundation is a star schema with four core tables: `FactPatientMeasure`, `DimMeasure`, `DimJurisdiction`, and `DimPatient`. Our Managed Power BI for healthcare teams practice builds this pattern for multi-site health systems that need a single pane of glass across regulatory frameworks.
FactPatientMeasure contains one row per patient-measure-period combination:
| Column | Example value |
|---|---|
| PatientKey | 8821047 |
| MeasureKey | CDC-HbA1c |
| JurisdictionKey | US-HEDIS |
| MeasurementDate | 2026-03-15 |
| IsNumerator | 1 |
| IsDenominator | 1 |
| IsExclusion | 0 |
| PerformanceYear | 2026 |
DimMeasure carries the display name, framework (`HEDIS`, `QOF`, `CIHI`), clinical domain (preventive, chronic, acute), and the current benchmark value for that performance year. Storing benchmarks in the dimension table - rather than hard-coding them in DAX - lets you update regulatory thresholds annually without touching a single report visual.
DimJurisdiction holds jurisdiction-level metadata: the regulatory body (NCQA, NHS England, CIHI), the applicable privacy law (HIPAA, GDPR, PIPEDA), and the site or facility identifier. This table drives row-level security partitioning so a UK Trust analyst's query never touches US HIPAA-protected records, and a Canadian provincial authority's session is scoped to CIHI indicators only.
The central measure rate across the entire model is then:
```dax
Measure Rate =
DIVIDE(
CALCULATE(SUM(FactPatientMeasure[IsNumerator]),
FactPatientMeasure[IsExclusion] = 0),
CALCULATE(SUM(FactPatientMeasure[IsDenominator]),
FactPatientMeasure[IsExclusion] = 0)
)
```
This single expression works for every measure in every jurisdiction because the numerator/denominator classification is resolved in the ETL layer, not repeated in DAX.
How Does the DAX SWITCH Function Handle Multi-Framework Benchmarking?
The DAX SWITCH function is the most readable way to route a measure to its regulatory benchmark without duplicating report pages. This is one of the most practically useful DAX SWITCH function examples in healthcare reporting because the benchmark changes not just by measure, but by jurisdiction and performance year - a two-dimensional routing problem that `SWITCH(TRUE(), ...)` handles cleanly.
A working DAX SWITCH function healthcare reporting pattern:
```dax
Benchmark Value =
VAR _measure = SELECTEDVALUE(DimMeasure[MeasureCode])
VAR _jurisdiction = SELECTEDVALUE(DimJurisdiction[JurisdictionCode])
RETURN
SWITCH(
TRUE(),
_jurisdiction = "US-HEDIS" && _measure = "CDC-HbA1c", 0.638,
_jurisdiction = "UK-QOF" && _measure = "DM017", 0.650,
_jurisdiction = "CA-CIHI" && _measure = "DIAB-HbA1c", 0.620,
BLANK()
)
```
The `TRUE()` form evaluates each condition in order and returns the first match, handling the combinatorial expansion of measure-by-jurisdiction pairs far more readably than nested `IF` statements. When NCQA releases updated HEDIS benchmarks for a new performance year, you update the constants - or, better, move the benchmark into `DimMeasure` entirely and replace the `SWITCH` with a filtered `CALCULATE(MAX(DimMeasure[BenchmarkValue]), ...)` scoped to the current performance year. That eliminates hard-coded numbers and makes the model self-updating when you refresh the dimension from your regulatory data feed.
For governance patterns that keep these models maintainable year over year, see our Power BI Governance Best Practices: 12-Point Checklist.
How Do You Implement Drill-Through to Patient Cohorts from a Quality Measures Summary?
Drill-through is where a quality measures dashboard earns its operational value. A summary page showing "HEDIS CDC-HbA1c: 63.4% vs 63.8% benchmark" is informative. A drill-through to the specific patients in the performance gap - with their last visit date, attributed provider, and next scheduled appointment - is actionable.
In Power BI, configure a drill-through page scoped to `DimPatient`. Set `MeasureCode` and `JurisdictionCode` as drill-through filters. A report user right-clicks any bar on the summary visual and lands on a patient-level table filtered to exactly that measure's non-compliant denominator population.
The cohort table should surface:
- Patient identifier - de-identified per jurisdiction: hash-based pseudonymization for GDPR in UK deployments, Limited Data Set token under HIPAA Safe Harbor for US records, and de-identification consistent with PIPEDA guidance for Canadian organizations.
- Last qualifying service date - the most recent date that would have counted toward the numerator.
- Days since last service - a calculated column driving conditional formatting to flag patients overdue for outreach.
- Attributed provider - the clinician responsible, enabling targeted care-gap closure rather than bulk outreach to an entire panel.
- Next scheduled appointment - pulled from your scheduling system via DirectQuery or an incremental-refresh import.
This structure turns the dashboard into a care-gap workflow. A US accountable care organization (ACO) administrator can export the cohort, route it to care coordination, and track closure rates within the same reporting cycle. For ACO teams, this integrates directly into an ACO shared savings performance analytics dashboard because HEDIS rates are a direct input to the CMS quality score that determines shared savings eligibility under the MSSP program.
What Compliance Architecture Does a Multi-Jurisdiction Healthcare Analytics Dashboard Require?
HIPAA, GDPR, and PIPEDA each impose different controls at the data layer, but a well-designed Power BI Premium or Microsoft Fabric model can satisfy all three without maintaining separate datasets per jurisdiction.
Row-level security by jurisdiction is the structural foundation. A single RLS role table mapping `user_email` to `JurisdictionKey` ensures a UK Trust analyst sees only QOF patient rows, a Canadian provincial authority sees only CIHI-scoped records, and US analysts operate under HIPAA's Minimum Necessary standard with column-level restrictions on direct identifiers.
Sensitivity labels via Microsoft Purview propagate from the dataset to every downstream report, Excel export, and screenshot. Apply `Highly Confidential - PHI` for US deployments and the GDPR Article 9 `Special Category Health Data` label for UK and EU environments. Canada's PIPEDA does not mandate a labeling standard, but Quebec Law 25 and Ontario's PHIPA are driving de facto requirements for explicit consent tracking - a `ConsentFlag` column in `DimPatient` handles this without schema changes to the core fact tables.
Audit logging via the Power BI Admin API records every drill-through event, export, and row-level query. Feed this log to a healthcare revenue cycle analytics dashboard or a SIEM platform to meet HIPAA's audit trail requirements under the Security Rule. For teams running ServiceNow alongside Power BI, our article on ServiceNow ITSM for Healthcare IT Teams: HIPAA, GDPR and PIPEDA covers linking audit events across both platforms. Implementation cost context is available in our Power BI Healthcare Reporting: Implementation Cost Guide.
How Does Automated Benchmarking Work Across HEDIS, QOF, and CIHI?
Automated benchmarking means the dashboard compares each measure rate against the current-year regulatory threshold without a human updating a config file each time a framework publishes new specifications. There are three implementation tiers:
Tier 1 - Manual table refresh: Maintain `DimMeasure[BenchmarkValue]` in a SharePoint or OneLake Excel file. Refresh it annually when NCQA, NHS England, and CIHI publish updated thresholds. Simple and fully auditable - appropriate for single-jurisdiction deployments.
Tier 2 - API feed: NCQA provides HEDIS measure specification data programmatically. NHS England publishes QOF indicator data via the NHS BSA Open Data Portal. CIHI provides indicator downloads via its data portal. A Power BI dataflow or Fabric Pipeline Python step pulls these at publication time and updates `DimMeasure` automatically.
Tier 3 - Power BI Model Context Protocol (MCP): The emerging Power BI Model Context Protocol MCP specification allows external AI agents to query and update semantic model metadata programmatically via the Power BI REST API. An AI workflow agent can monitor each framework's publication feed, parse the updated benchmark table, and push new threshold values to `DimMeasure` without manual intervention. MCP-connected language models can also generate narrative commentary directly from the semantic model - flagging, for instance, which patient age cohort accounts for the largest gap against the HEDIS CDC-HbA1c benchmark - without a separate data export. See how this connects to broader automation patterns in our article on connecting AI workflow automation to Power BI.
The cross-framework comparison is most legible in a single table visual with conditional formatting on the Gap column:
| Framework | Measure | Your Rate | Benchmark | Gap |
|---|---|---|---|---|
| HEDIS | CDC-HbA1c | 63.4% | 63.8% | -0.4 pp |
| QOF | DM017 | 67.1% | 65.0% | +2.1 pp |
| CIHI | DIAB-HbA1c | 61.8% | 62.0% | -0.2 pp |
| HEDIS | BCS | 71.2% | 75.9% | -4.7 pp |
| QOF | CAN004 | 68.3% | 70.0% | -1.7 pp |
Red for negative gaps, green for positive - this becomes an instant priority queue for quality improvement leadership without any additional DAX.
When Should a Health System Outsource vs Build a Quality Reporting Dashboard In-House?
The healthcare analytics outsourcing vs in-house cost ROI question surfaces at every multi-framework quality project. The honest framing is not "build vs buy" but "build vs maintain." The initial build is finite. The ongoing maintenance - tracking three sets of annual specification updates, regression-testing every measure definition change, and managing user access as clinical staff rotate - runs indefinitely.
A US-only HEDIS deployment at a single facility can often be maintained in-house after the initial model build. A health system operating across the US, Canada, and the UK faces a compounding burden: NCQA releases updated HEDIS Technical Specifications each October, NHS England updates QOF indicators annually in April, and CIHI refreshes its indicator methodology on a rolling basis. A missed specification update can shift a measure rate by several points and invalidate a quarter of performance data before anyone notices.
A managed analytics service for healthcare providers typically includes:
- Annual benchmark refresh aligned to each framework's publication calendar.
- Regression testing when measure specifications change - a lookback window update in a single HEDIS measure can cascade through the semantic model and shift rates across multiple sites.
- Compliance audit support - generating dataset access logs and RLS configuration evidence for HIPAA, GDPR, or PIPEDA auditors on request.
- Telehealth analytics dashboard metrics onboarding as virtual encounter codes are added to HEDIS and QOF eligibility criteria year over year.
Suppose a 20-clinician US primary-care practice running HEDIS reporting decides to build in-house. The initial model build is a one-time project cost. But annual maintenance - specification updates, compliance review, access management, and regression testing - typically requires a part-time senior BI developer with clinical informatics depth. For a health system already operating across jurisdictions, that cost multiplies with each framework added, and the risk of a silent specification mismatch grows with every performance year.
---
About Lets Viz: Lets Viz has delivered data analytics and managed Power BI solutions to US healthcare organizations, UK fintech firms, Canadian manufacturing companies, and global SaaS teams since 2020. Rated 5.0 on Clutch, the team specializes in HIPAA-compliant semantic models, multi-jurisdiction compliance architecture, and clinical quality measure automation for health systems operating across regulatory boundaries.
Managed Power BI for healthcare teams describes how Lets Viz builds and maintains HEDIS, QOF, and CIHI reporting dashboards on a fixed monthly engagement - reach out to start the conversation.