EARLIER Function in DAX: Power BI Row Context Guide
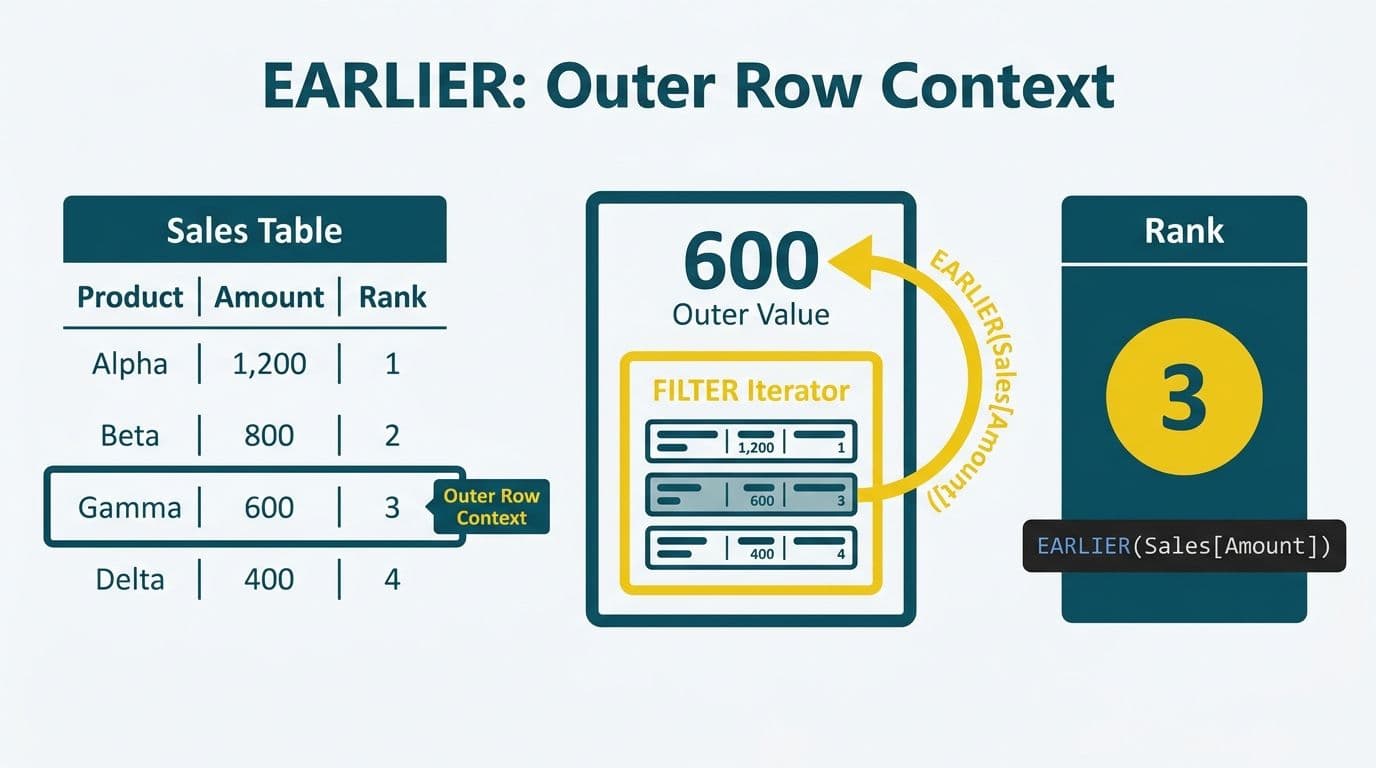
The EARLIER function in DAX Power BI solves a precise scoping problem: when a calculated column iterates through rows, any nested FILTER or iterator creates a second row context that hides the original row's values. EARLIER retrieves the value from that outer row context so you can compare the current row against every other row in the same table. EARLIEST reaches one additional level further up for triple-nested scenarios.
Key Takeaways
- EARLIER captures a column's value from the outer row context inside a nested iteration - essential for in-table ranking and comparisons in calculated columns
- Use EARLIER for ranking patterns, cumulative running totals, and self-table conditional comparisons without CALCULATE
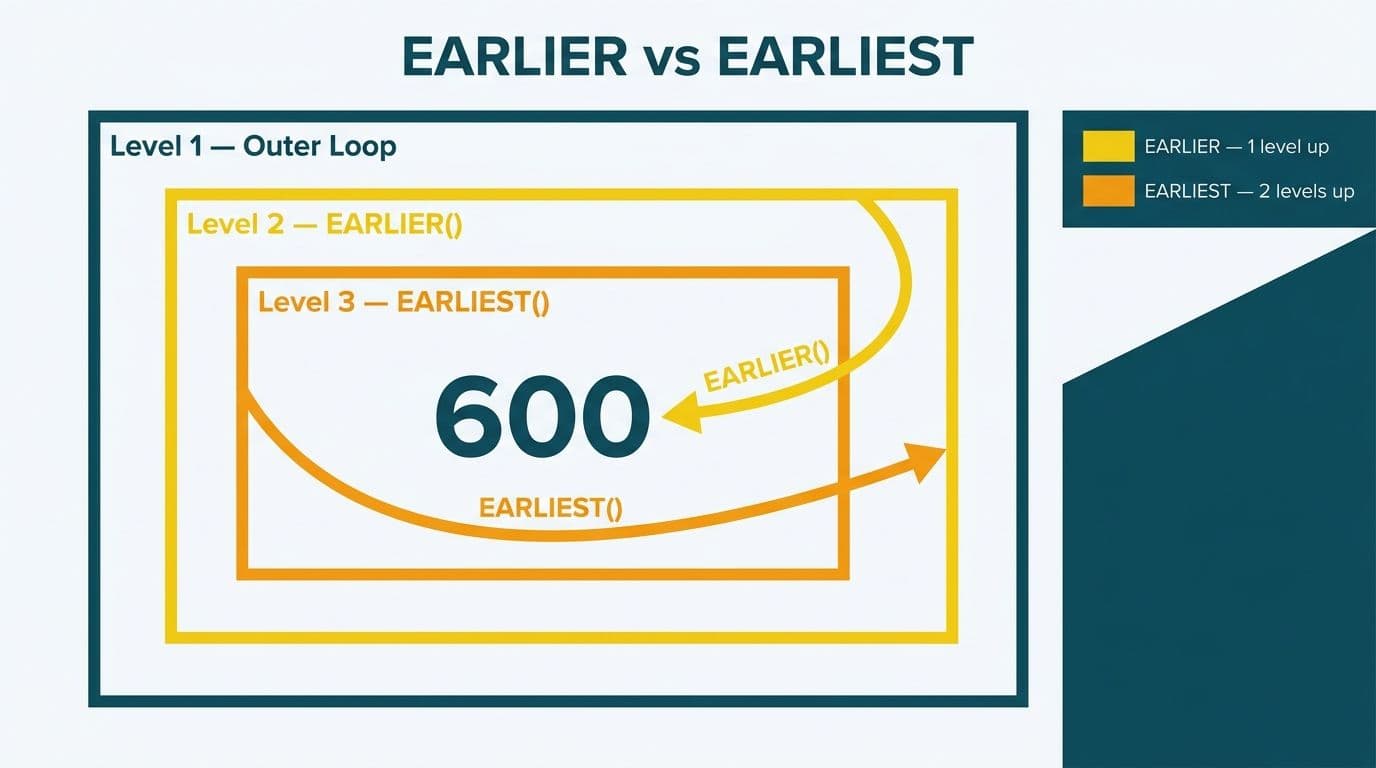
- EARLIEST retrieves values two context levels up - needed when a FILTER or iterator is nested inside another iterator, inside a calculated column
- VAR/RETURN syntax offers a more readable alternative to EARLIER in most modern DAX scenarios, but EARLIER remains required in some calculated-table nesting patterns
- EARLIER operates only in row context (calculated columns, ADDCOLUMNS, SELECTCOLUMNS) and cannot be used inside measures
What Is the EARLIER Function in DAX Power BI and Why Does Row Context Matter?
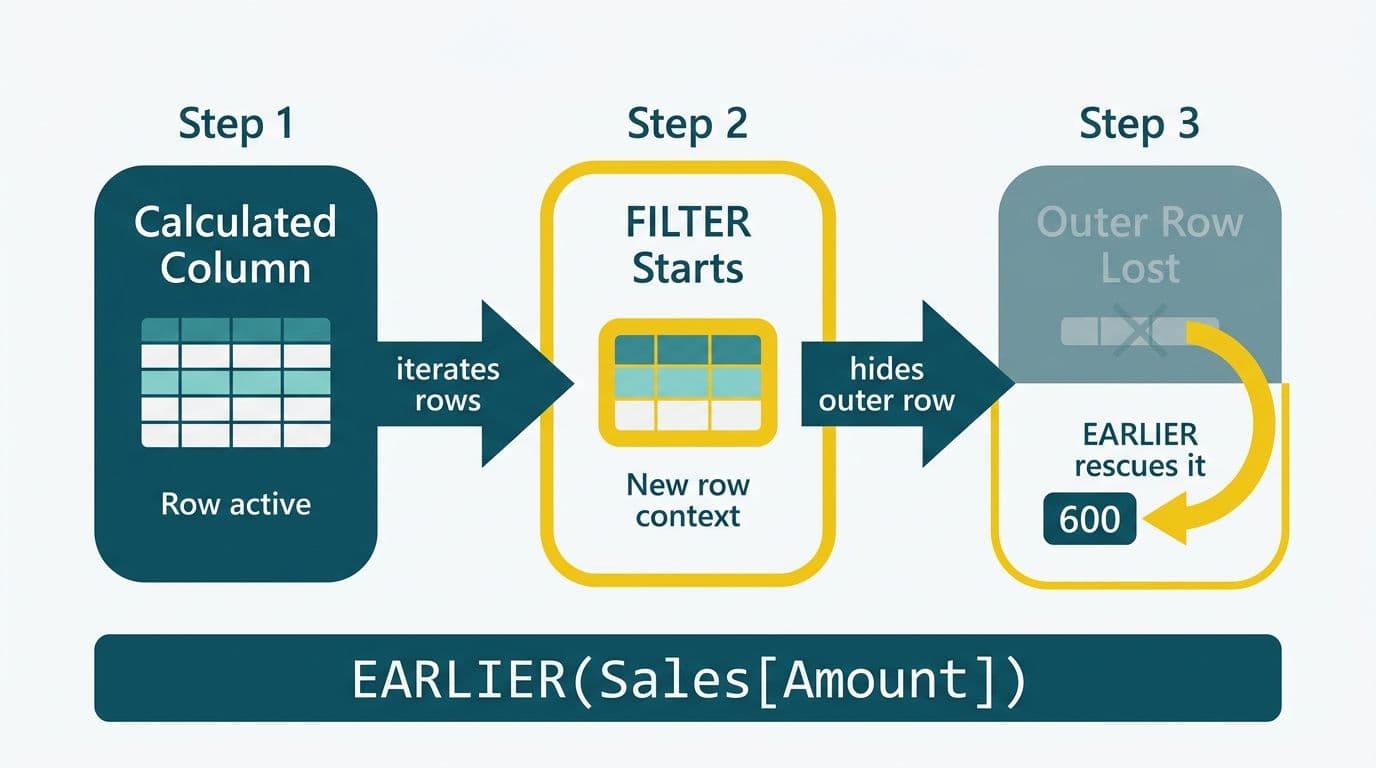
EARLIER is a DAX function that returns the value of a specified column at the previous - outer - row context evaluation level. To understand why this matters in practice, you need a clear picture of how row context works in Power BI.
When Power BI evaluates a calculated column, it creates a row context that walks through the table one row at a time, evaluating the expression for each row. That is the outer row context. The moment you introduce a nested iterator - FILTER, SUMX, AVERAGEX, or ADDCOLUMNS - Power BI opens a second, inner row context to walk through the same (or another) table. At that point, any column reference inside the inner iterator refers to the inner row context, not the original outer row. EARLIER is the bridge back to that outer row.
This distinction is foundational for any calculated column that compares one row against other rows in the same table - a pattern that appears in ranking models, SLA scorecards, and benchmarking dashboards across healthcare and finance analytics.
Consider what happens without EARLIER. If you write `FILTER(Sales, Sales[Revenue] > Sales[Revenue])`, the inner `Sales[Revenue]` resolves to the inner row context. The filter condition becomes a tautology - every row compared against itself - and you get no meaningful ranking. With `EARLIER(Sales[Revenue])`, the condition correctly reads: find all rows where this inner row's Revenue exceeds the outer row's Revenue (the row currently being evaluated in the calculated column).
Enterprise BI teams pulling operational data from platforms like ServiceNow into Power BI - building SLA dashboards, incident scoring models, or ticket-response benchmarks - encounter this row-context mechanic constantly. Our ServiceNow + Power BI / Tableau consulting practice implements these calculated column patterns on live ITSM data regularly, and row context is a prerequisite for building models that produce accurate, auditable results.
How Does the EARLIER Function Work in a Calculated Column with Row Context?
The canonical use of the EARLIER function in a DAX Power BI row context is a ranking calculated column. Assume a Sales table with columns [Salesperson] and [Revenue]. The goal is a [Revenue Rank] calculated column where rank 1 is the highest revenue.
```dax
Revenue Rank =
COUNTROWS(
FILTER(
Sales,
Sales[Revenue] > EARLIER(Sales[Revenue])
)
) + 1
```
Step by step:
1. Power BI evaluates this expression for each row in Sales - the outer row context becomes active
2. `EARLIER(Sales[Revenue])` captures the current row's Revenue value, locking it at the outer context level before the inner iteration begins
3. `FILTER(Sales, ...)` opens an inner row context, walking every row in the Sales table
4. For each inner row, the condition checks whether that inner row's Revenue exceeds the outer row's captured Revenue
5. `COUNTROWS` counts how many rows pass the filter - that is, how many rows have higher revenue than the current outer row
6. Adding 1 converts the count into a 1-based rank
The result: the row with the highest Revenue gets COUNTROWS = 0, so rank = 1. The second-highest gets COUNTROWS = 1, so rank = 2. Tied rows return identical ranks.
You can extend this pattern to rank within a category by adding a second EARLIER call:
```dax
Revenue Rank Within Region =
COUNTROWS(
FILTER(
Sales,
Sales[Region] = EARLIER(Sales[Region]) &&
Sales[Revenue] > EARLIER(Sales[Revenue])
)
) + 1
```
Here `EARLIER(Sales[Region])` restricts the inner iteration to only rows in the same region as the current outer row, while `EARLIER(Sales[Revenue])` provides the comparison threshold. Both EARLIER calls retrieve values from the same outer row context.
A US hospital system building a calculated column to rank diagnostic codes by average treatment cost within each clinical department would use exactly this pattern - `EARLIER(Visits[Department])` for the equality filter and `EARLIER(Visits[Cost])` for the comparison. Under HIPAA, the calculated column values should be generated in a workspace where row-level security is applied before any results are exported or distributed.
For teams managing Power BI governance across large report libraries, Power BI governance best practices covers how to document and audit calculated column patterns like EARLIER across a production semantic model.
How Do You Use EARLIER for Running Totals in Power BI?
Running totals - cumulative sums across a sorted sequence - are the second standard EARLIER use case in Power BI calculated columns. The pattern uses EARLIER to anchor the current row's date (or other sort key) so the inner FILTER can select all prior rows.
```dax
Running Revenue by Date =
SUMX(
FILTER(
Sales,
Sales[OrderDate] <= EARLIER(Sales[OrderDate])
),
Sales[Revenue]
)
```
For each row, `EARLIER(Sales[OrderDate])` captures the current row's date. FILTER returns all Sales rows with an OrderDate on or before that date. SUMX sums Revenue across those rows, producing a cumulative total through the current row's date.
This pattern addresses direct requirements in regulated finance environments:
- Budget consumption tracking: summing spend through each period day versus a target, common in US finance teams operating under SOC 2 audit requirements
- Patient census accumulation: tracking cumulative admissions through each date in a reporting period for hospital capacity dashboards
- Transaction exposure monitoring: summing counterparty positions up to each settlement date for UK fintech firms with GDPR reporting obligations
For a Canadian manufacturing company tracking cumulative defect counts per assembly line - where the underlying data may include personally identifiable operator records subject to PIPEDA - the running total pattern delivers a direct in-table column without requiring a time-intelligence function or a separate measure:
```dax
Cumulative Line Defects =
SUMX(
FILTER(
Production,
Production[AssemblyLine] = EARLIER(Production[AssemblyLine]) &&
Production[Date] <= EARLIER(Production[Date])
),
Production[DefectCount]
)
```
This uses two EARLIER calls: one for the equality filter (same assembly line) and one for the date range filter (date on or before the current row). Both retrieve values from the same outer row context.
For broader finance reporting patterns in Power BI, Power BI for accounting and finance firms covers calculated column design across common finance model structures and data types.
When Should You Use EARLIEST vs. EARLIER in DAX Power BI?
EARLIEST retrieves a column value two context levels up - the level active before both the current inner iteration and the immediately outer iteration. You need it when three nested row contexts are simultaneously active.
This scenario arises in calculated tables built with nested ADDCOLUMNS or SELECTCOLUMNS calls:
```dax
Product Analysis =
ADDCOLUMNS(
ADDCOLUMNS(
Products,
"Category Avg Price",
AVERAGEX(
FILTER(Products, Products[Category] = EARLIER(Products[Category])),
Products[Price]
)
),
"Exceeds Category Avg",
IF(
Products[Price] > EARLIEST(Products[Price]),
"Yes", "No"
)
)
```
In the outer ADDCOLUMNS (context level 1), each Products row is the original row context. The inner ADDCOLUMNS column definition (context level 2) uses EARLIER to reference the level-1 category. Inside the second ADDCOLUMNS column definition (context level 3), EARLIEST reaches back to level 1 to retrieve the original Products[Price] for the final comparison.
In practice, most Power BI models do not require EARLIEST because:
1. Modern DAX VAR syntax captures outer values without requiring context-level counting
2. Three-level nesting is often a signal that the calculated table structure itself should be simplified
3. EARLIEST makes code significantly harder to audit, maintain, and hand off between developers
Use EARLIEST when maintaining legacy calculated tables that predate VAR support, or when the three-level structure is genuinely required by the data model and VAR scope does not propagate correctly across nested ADDCOLUMNS levels.
EARLIER vs. VAR in DAX: Which Should Your Team Use?
VAR/RETURN syntax, available since DAX 2015, solves the same problem as EARLIER in most calculated-column scenarios. Both are fully supported in Power BI, Analysis Services, and Excel as of 2026. The choice is primarily about readability, maintainability, and the specific nesting pattern involved.
| Scenario | Prefer EARLIER | Prefer VAR |
|---|---|---|
| New calculated column development | Only if ADDCOLUMNS nesting requires it | Default choice for all new work |
| Legacy model maintenance | Yes - refactoring adds regression risk | If model is being actively refactored |
| Code readability | Lower (context-level counting is implicit) | Higher (named variables are self-documenting) |
| Three-level calculated-table nesting | EARLIEST may be required | VAR scope may not propagate across nested ADDCOLUMNS |
| Team onboarding | Steeper learning curve for new DAX developers | More accessible and easier to review |
The VAR equivalent of the revenue-ranking pattern:
```dax
Revenue Rank (VAR) =
VAR CurrentRevenue = Sales[Revenue]
RETURN
COUNTROWS(
FILTER(Sales, Sales[Revenue] > CurrentRevenue)
) + 1
```
The VAR version assigns the outer row's Revenue to a named variable before FILTER opens. Inside FILTER, `CurrentRevenue` is already a scalar - no context resolution needed. Intent is explicit and easier to read in code reviews or governance audits.
Microsoft's DAX documentation recommends VAR over EARLIER for new development but does not deprecate EARLIER. Teams running Power BI as a managed service, with regular model reviews and developer handoffs, should standardise on VAR for new calculated columns and explicitly document any retained EARLIER patterns. Power BI managed service for finance teams outlines how ongoing semantic model governance handles these design decisions at scale.
Practical Patterns: Conditional Comparisons with EARLIER in Healthcare and Finance
The most operationally useful EARLIER patterns combine ranking, filtering, and conditional output in a single calculated column. Three patterns that appear regularly in healthcare and finance Power BI deployments:
Pattern 1: Flag rows exceeding a category average (US healthcare)
A US hospital system needs a calculated column flagging each patient visit where length of stay exceeds the average for the admission category, for use in care management dashboards. Under HIPAA, the workspace applying this column should have row-level security configured before calculated results are shared or exported.
```dax
LOS Flag =
VAR CategoryAvg =
AVERAGEX(
FILTER(
Visits,
Visits[AdmissionCategory] = EARLIER(Visits[AdmissionCategory])
),
Visits[LengthOfStay]
)
RETURN
IF(Visits[LengthOfStay] > CategoryAvg, "Review", "Within Range")
```
This hybrid uses EARLIER inside a VAR-assigned AVERAGEX expression - valid DAX and often the cleanest structure when you need a category-scoped aggregate as the comparison baseline.
Pattern 2: Rank transactions within a risk tier (UK fintech)
A UK fintech firm building transaction-level risk reports under GDPR needs each transaction ranked by value within its risk classification tier:
```dax
Transaction Rank in Tier =
COUNTROWS(
FILTER(
Transactions,
Transactions[RiskTier] = EARLIER(Transactions[RiskTier]) &&
Transactions[Value] > EARLIER(Transactions[Value])
)
) + 1
```
Pattern 3: Cumulative production variance per line (Canadian manufacturing)
A Canadian manufacturer tracking production variance per assembly line, with PIPEDA-aligned data handling for any personally identifiable operator records:
```dax
Cumulative Line Variance =
SUMX(
FILTER(
Production,
Production[Line] = EARLIER(Production[Line]) &&
Production[Date] <= EARLIER(Production[Date])
),
Production[Variance]
)
```
All three patterns share the same core mechanic: EARLIER anchors the outer row's values so the inner FILTER can evaluate every other row against them. The category or line equality filter narrows the comparison scope; the numeric or date comparison does the actual ranking or accumulation.
When operational scale demands systematic model changes - updating calculated column logic across a large library in one pass rather than case by case - the same scripted automation used to patch 340 DAX article meta-titles via the CMS API in a single operation applies directly to DAX model maintenance via Tabular Editor or the XMLA endpoint.
For teams integrating Power BI calculated columns into AI-connected reporting pipelines, connecting AI workflow automation to Power BI covers the orchestration layer between automated data processing and semantic model refresh cycles.
---
About Lets Viz: Lets Viz is a data analytics consultancy serving US healthcare providers, UK fintech firms, Canadian manufacturing companies, and global SaaS businesses since 2020. The team specialises in Power BI semantic model design, DAX optimisation, and enterprise BI implementation, and holds a 5.0 rating on Clutch. Every article in this series is written by practitioners who build and maintain production models.
If your team needs help implementing EARLIER patterns, ranking logic, or complex calculated columns in a Power BI environment connected to ServiceNow or other enterprise data sources, ServiceNow + Power BI / Tableau consulting covers the full implementation stack - from semantic model design to validated dashboard delivery.