DAX EARLIER Function: Time Intelligence for Finance Reporting
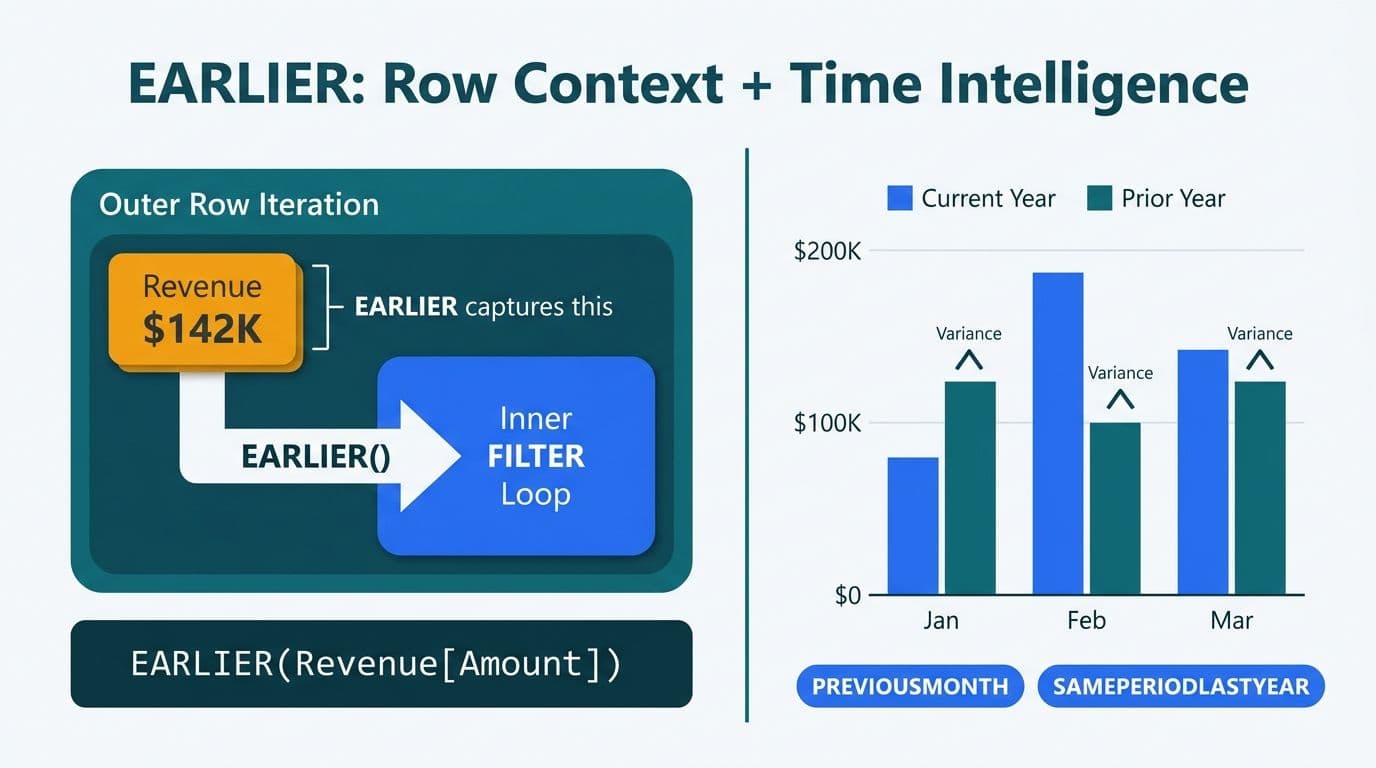
The DAX EARLIER function captures a row's evaluation context before an outer iteration rewrites it - enabling row-level comparisons against aggregated totals inside the same table. For FP&A reporting, EARLIER is the foundation for ranked variance calculations, while PREVIOUSMONTH, SAMEPERIODLASTYEAR, and DATESINPERIOD deliver the period-over-period intelligence finance directors need directly inside Power BI.
Key Takeaways
- EARLIER() captures the current row's value inside a nested FILTER or SUMX - the prerequisite for rank and variance calculations in DAX calculated columns.
- PREVIOUSMONTH() and SAMEPERIODLASTYEAR() return shifted date ranges; combine them with CALCULATE() to build MoM and YoY variance measures.
- DATESINPERIOD() constructs arbitrary rolling windows - rolling 12-month, rolling 90-day - that neither PREVIOUSMONTH nor DATESYTD can handle alone.
- UK (April start) and US federal healthcare (October start) fiscal calendars require a manually built Date table; Power BI's auto date hierarchy does not support non-January fiscal starts.
- Certified DAX measure definitions should be locked before connecting AI automation pipelines to Power BI output - errors in the measure layer propagate silently downstream.
What Is the DAX EARLIER Function and When Should You Use It?
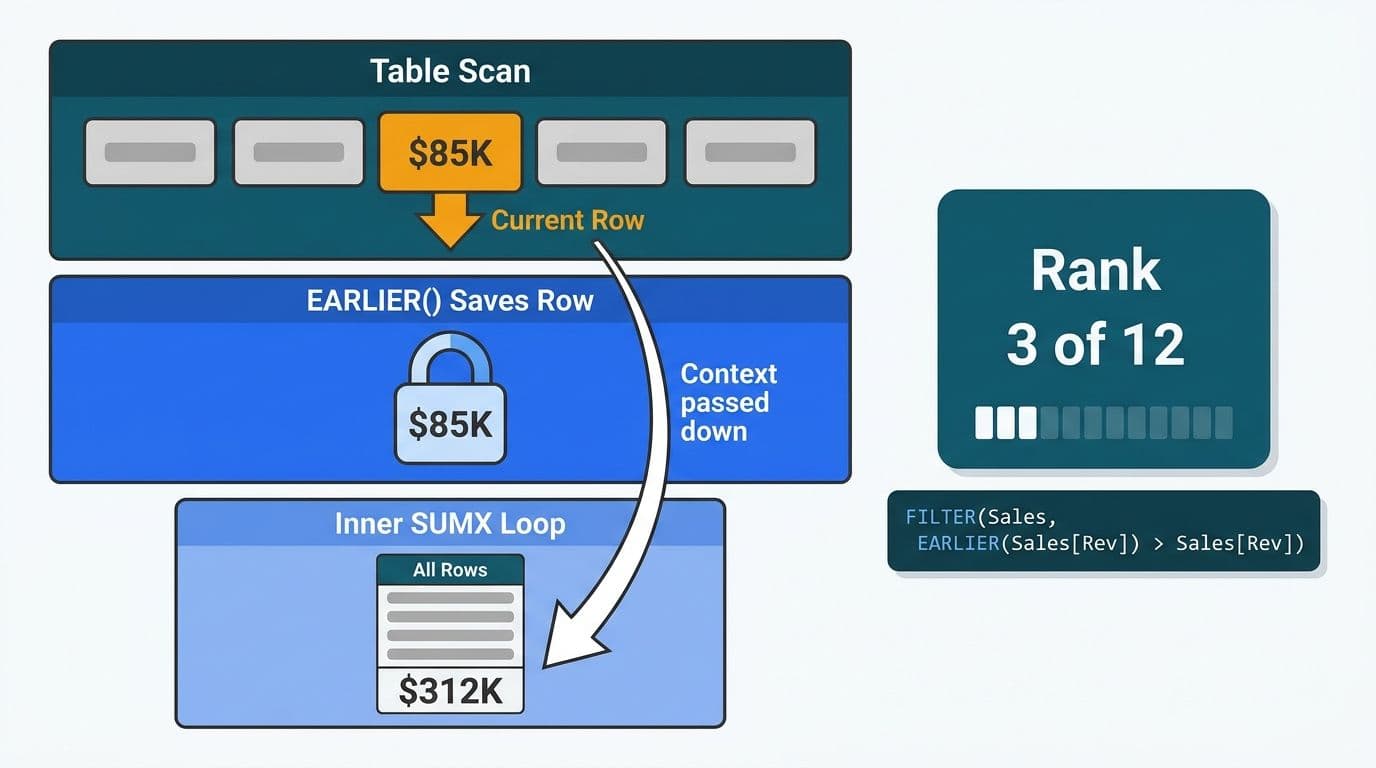
EARLIER(column) returns the value of a column in the outer row context when Power BI evaluates a formula inside a nested iteration. The function solves a specific problem: when you write a FILTER or SUMX inside a calculated column, the inner expression loses track of which row it started on. EARLIER restores that reference.
The clearest FP&A use case is ranking. A US hospital network's revenue cycle team wanting to rank each cost center by quarterly spend - without a separate SQL layer - can write this directly as a calculated column:
```dax
Cost Center Rank =
COUNTROWS(
FILTER(
CostCenters,
CostCenters[QuarterlySpend] > EARLIER(CostCenters[QuarterlySpend])
)
) + 1
```
`EARLIER(CostCenters[QuarterlySpend])` holds the current row's spend value while FILTER iterates every other row in the table. Without EARLIER, DAX cannot distinguish the starting row from the rows being scanned.
When to use VAR instead: Microsoft's DAX reference documentation recommends replacing EARLIER with a VAR/RETURN pattern in new development because variables are easier to debug and perform better on large tables. EARLIER remains valid for calculated columns where row context is unambiguous, and it is the pattern you will encounter when auditing legacy Power BI models built before variables were idiomatic - a task finance teams frequently face when inheriting dashboards from a prior implementation.
Finance teams building AI-assisted reporting stacks often discover that DAX audit skills are the first bottleneck: the outputs from AI automation consulting pipelines are only as trustworthy as the measure definitions feeding them.
The VAR equivalent of the ranking formula:
```dax
Cost Center Rank v2 =
VAR CurrentSpend = CostCenters[QuarterlySpend]
RETURN
COUNTROWS(
FILTER(CostCenters, CostCenters[QuarterlySpend] > CurrentSpend)
) + 1
```
Both produce identical results. Prefer VAR for new development; recognize EARLIER when reading existing models.
How Do PREVIOUSMONTH and SAMEPERIODLASTYEAR Work in DAX Finance Examples?
PREVIOUSMONTH and SAMEPERIODLASTYEAR are time-intelligence modifier functions used inside CALCULATE() to replace the current period's date filter with a shifted range.
PREVIOUSMONTH(dates) returns the entire prior calendar month:
```dax
Revenue PreviousMonth =
CALCULATE(
[Total Revenue],
PREVIOUSMONTH('Date'[Date])
)
```
Month-over-month variance - the first metric most FP&A directors review at close - follows directly:
```dax
MoM Variance % =
DIVIDE(
[Total Revenue] - [Revenue PreviousMonth],
[Revenue PreviousMonth],
BLANK()
)
```
BLANK() as the alternate result prevents the first data month from displaying a misleading -100% variance when no prior month exists.
SAMEPERIODLASTYEAR(dates) shifts the current filter range back exactly 12 months:
```dax
Revenue SPLY =
CALCULATE(
[Total Revenue],
SAMEPERIODLASTYEAR('Date'[Date])
)
```
A UK fintech firm producing IFRS management accounts would use SAMEPERIODLASTYEAR to generate the comparative period columns the standard requires - without it, analysts rebuild the prior-year filter manually via DATEADD, which is more verbose and prone to edge-case errors around fiscal year boundaries.
Prerequisite: both functions require a continuous, gap-free Date table with an active relationship to the fact table. ERPs that skip weekends or public holidays can create gaps that cause SAMEPERIODLASTYEAR to return BLANK() for shifted dates. Validate continuity with:
```dax
DateTableGaps = COUNTROWS(FILTER('Date', ISBLANK('Date'[Date])))
```
This should return 0. Fill any gaps before deploying time-intelligence measures to a finance audience.
How Do You Build a Fiscal-Year Calendar in Power BI for FP&A?
Power BI's auto date hierarchy assumes a January 1 fiscal year start. Finance teams at UK businesses (April 1), Canadian manufacturers (often April or March), and US federal healthcare organizations (October 1) need a custom Date table with explicit fiscal columns.
The FiscalYear column for an April 1 start:
```dax
FiscalYear =
IF(
'Date'[Month] >= 4,
'Date'[Year],
'Date'[Year] - 1
)
```
This assigns FY2026 to any date from April 2026 onward and FY2025 to January-March 2026 - correct for UK, Australian, and many Canadian organizations.
| Region | Fiscal Year Start | DAX Month Threshold | DATESYTD Year-End Arg |
|---|---|---|---|
| US (most companies) | January 1 | Calendar year (no adjustment) | 12/31 |
| US Federal / Healthcare | October 1 | Month >= 10 | 9/30 |
| UK / Australia | April 1 | Month >= 4 | 3/31 |
| Canada (common) | April 1 | Month >= 4 | 3/31 |
Once FiscalYear is defined, fiscal YTD revenue uses DATESYTD with the year-end string argument:
```dax
Revenue FYTD (UK / Canada) =
CALCULATE(
[Total Revenue],
DATESYTD('Date'[Date], "3/31")
)
```
Canadian organizations subject to PIPEDA - and UK and EU organizations under GDPR - should verify that Power BI datasets containing personal financial data are deployed to compliant Azure regions (Canada Central or Canada East for Canada; EU data center regions for GDPR scope) before publishing fiscal dashboards broadly.
For the governance controls that accompany these datasets - sensitivity labeling, certification, row-level security - the Power BI Governance Best Practices: 12-Point Checklist covers the framework US healthcare (HIPAA), UK fintech (GDPR), and Canadian manufacturing (PIPEDA) teams typically implement before production deployment.
How Does DATESINPERIOD Build Rolling Windows in Finance Reporting?
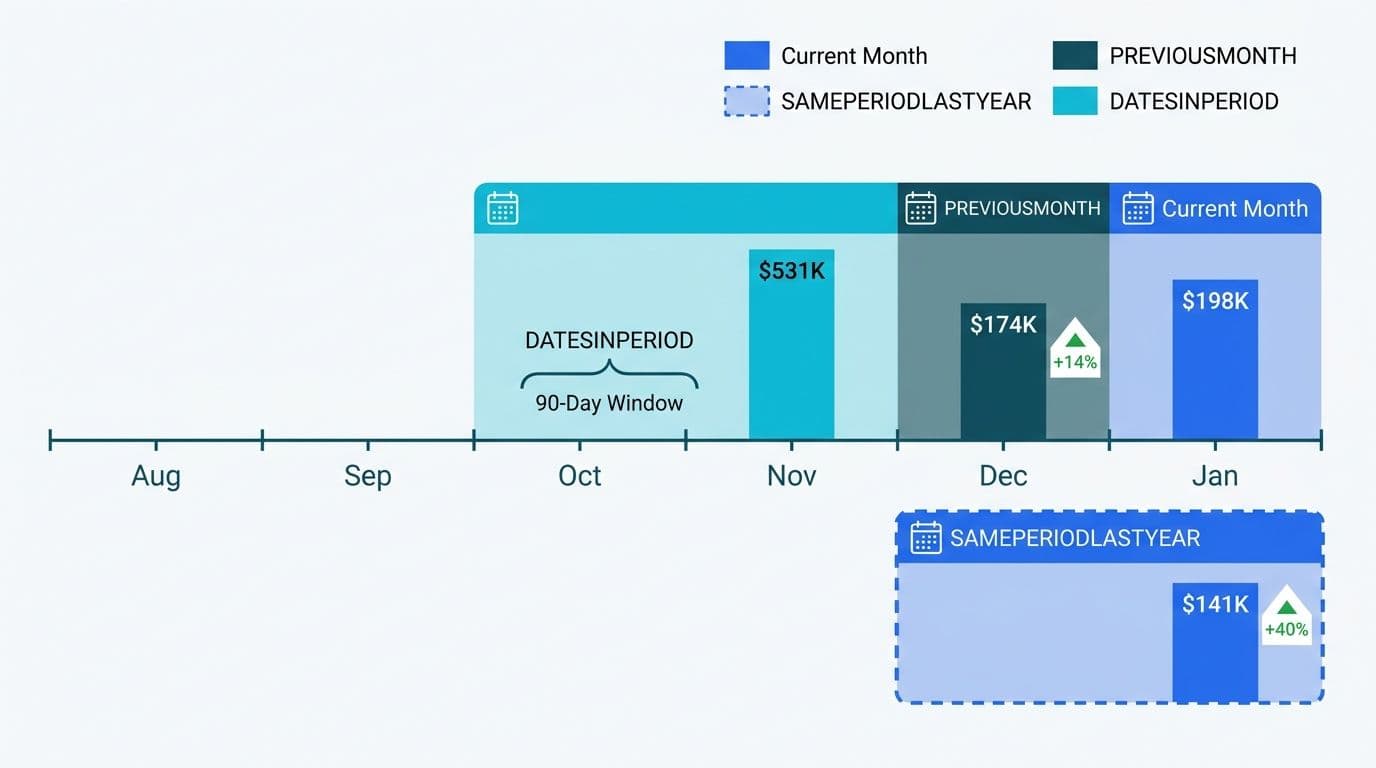
DATESINPERIOD(dates, last_date, number_of_intervals, interval) returns a table of dates anchored to a calculated endpoint and spanning backward by the specified count and interval. It is the correct DAX function when neither a calendar-month boundary nor a fiscal-year reset defines the analytical window.
Trailing twelve months (TTM) revenue - the standard metric for PE-backed companies and CFO board packs:
```dax
Revenue TTM =
CALCULATE(
[Total Revenue],
DATESINPERIOD(
'Date'[Date],
LASTDATE('Date'[Date]),
-12,
MONTH
)
)
```
Rolling 90-day cash collections for a US healthcare billing team managing HIPAA-covered remittance data:
```dax
Collections 90D =
CALCULATE(
[Cash Collected],
DATESINPERIOD(
'Date'[Date],
LASTDATE('Date'[Date]),
-90,
DAY
)
)
```
LASTDATE('Date'[Date]) anchors the window to the most recent date in the current filter context, so the measure automatically adjusts as the report user drills into different time periods.
Key behavioral difference: PREVIOUSMONTH always returns the full prior calendar month regardless of the current selection. DATESINPERIOD anchors to the last visible date in context. For a report filtered to the first 10 days of August, DATESINPERIOD(-90, DAY) counts back 90 days from August 10; PREVIOUSMONTH returns all of July. Neither is wrong - they answer different analytical questions.
| Function | Window Type | Partial-Period Behavior | Primary FP&A Use Case |
|---|---|---|---|
| PREVIOUSMONTH | Prior full calendar month | Always full prior month | MoM close reporting |
| SAMEPERIODLASTYEAR | Same range, -12 months | Mirrors current selection | YoY comparisons |
| DATESINPERIOD | Arbitrary rolling window | Anchored to last date in context | TTM, rolling 90D, rolling 13-week |
| DATESYTD | Year-to-date | Resets at fiscal year-end | YTD budget vs actual |
A Canadian manufacturing firm presenting quarterly FP&A to its board would typically use SAMEPERIODLASTYEAR for the statutory comparative period and DATESINPERIOD(-12, MONTH) for the TTM EBITDA line - both in the same report, answering different questions simultaneously.
Worked Example: Building a Period-over-Period Variance Dashboard
The following measure set covers the full FP&A variance dashboard pattern for a mid-market finance team. Assume a Date table named `Date`, a fact table named `Actuals`, and a base measure `[Total Revenue]`.
Step 1 - Base measure:
```dax
Total Revenue = SUM(Actuals[RevenueAmount])
```
Step 2 - Prior-period comparison measures:
```dax
Revenue PM = CALCULATE([Total Revenue], PREVIOUSMONTH('Date'[Date]))
Revenue SPLY = CALCULATE([Total Revenue], SAMEPERIODLASTYEAR('Date'[Date]))
Revenue TTM = CALCULATE([Total Revenue], DATESINPERIOD('Date'[Date], LASTDATE('Date'[Date]), -12, MONTH))
```
Step 3 - Variance measures:
```dax
MoM $ Variance = [Total Revenue] - [Revenue PM]
MoM % Variance = DIVIDE([Total Revenue] - [Revenue PM], [Revenue PM], BLANK())
YoY $ Variance = [Total Revenue] - [Revenue SPLY]
YoY % Variance = DIVIDE([Total Revenue] - [Revenue SPLY], [Revenue SPLY], BLANK())
```
Step 4 - Governance and certification: US healthcare finance teams with HIPAA or SOC 2 obligations typically promote this measure set into a certified shared dataset so that subsidiary reports cannot override definitions. The Power BI Managed Service for Finance Teams: What to Expect article details how that certification layer is structured for healthcare and financial-services organizations.
For organizations running on Microsoft Fabric, the Fabric Lakehouse Finance Analytics: Power BI Reporting for FP&A guide shows how to publish this measure set into a shared semantic model that multiple finance reports consume - the architecture that prevents measure sprawl across separate .pbix files.
How Does DAX Time Intelligence Fit Into Automated Month-End Financial Close?
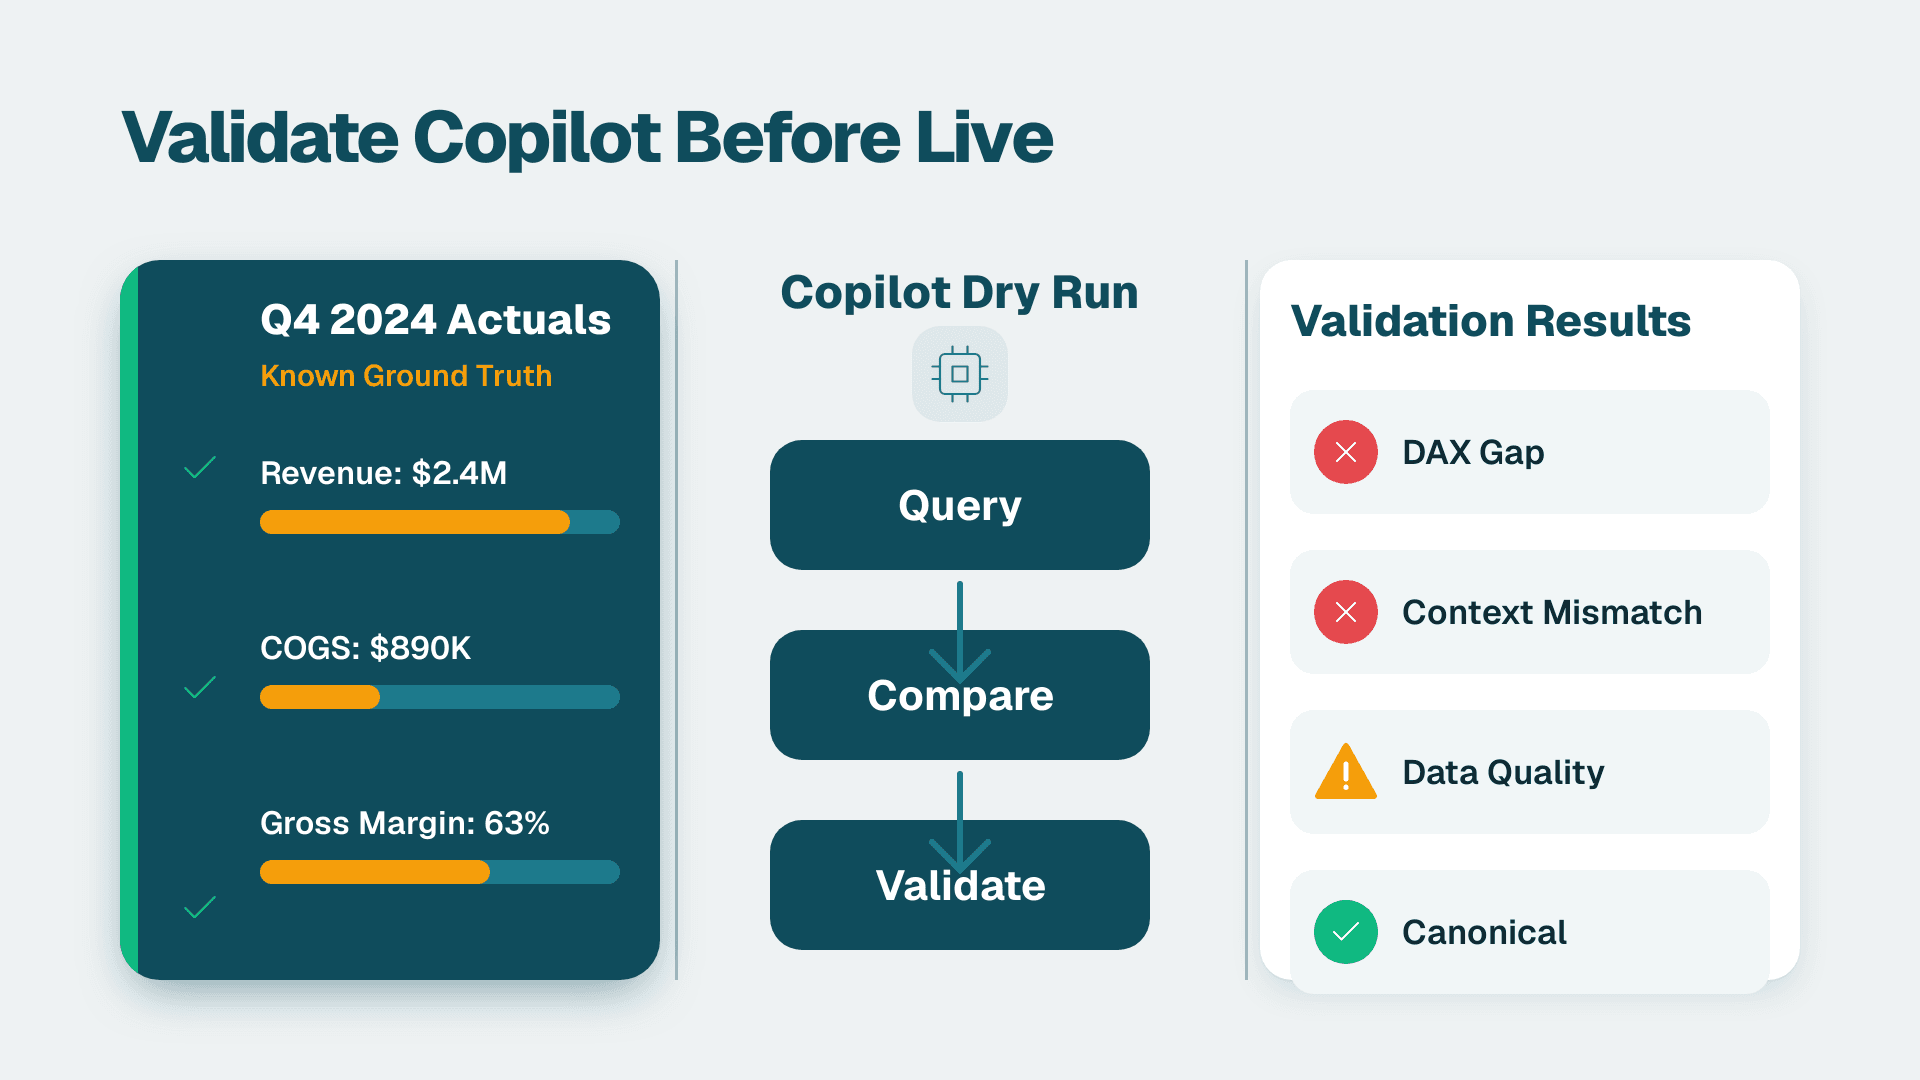
DAX measures are the analytical layer; they do not move data or trigger actions. Finance teams working to automate month-end financial close with AI tools consistently find that reliable DAX definitions are a prerequisite - not an afterthought - before connecting automation on top.
A common mid-market automation sequence runs: ERP extract, automated data validation, Power BI dataset refresh, then AI-generated variance commentary or anomaly alerts. At the commentary stage, the AI layer reads DAX output - PREVIOUSMONTH variance, YoY delta, TTM trend - and generates narrative explanations or flags items exceeding tolerance thresholds. If the underlying MoM measure double-counts a revenue line due to a broken Date table relationship, every downstream automation step inherits that error silently. Validation before automation is not optional.
For finance teams evaluating where to start with AI automation - workflow orchestration, AI-generated narratives, or anomaly detection - the AI Automation for Accounts Payable: A Process Walkthrough shows how a validated analytical foundation maps to an automated close workflow. Build a stable, auditable DAX measure layer first, then extend automation on top of it.
---
About Lets Viz: Lets Viz has partnered with finance and operations teams since 2020, delivering Power BI and data analytics solutions to US healthcare providers, UK fintech firms, Canadian manufacturers, and global SaaS companies. The practice holds a 5.0 rating on Clutch and specializes in FP&A reporting architecture, time-intelligence DAX design, and AI-assisted analytics for mid-market organizations operating under HIPAA, GDPR, and PIPEDA compliance frameworks.
If your finance team is ready to move beyond static reports and connect a validated DAX model to an automated month-end close workflow, our AI automation consulting team can audit your existing measure library, close the governance gaps, and map the automation layer that turns period-over-period variance analysis into a self-running finance engine.