Clinical Trial Data Reporting in Power BI: A GCP & GDPR Guide
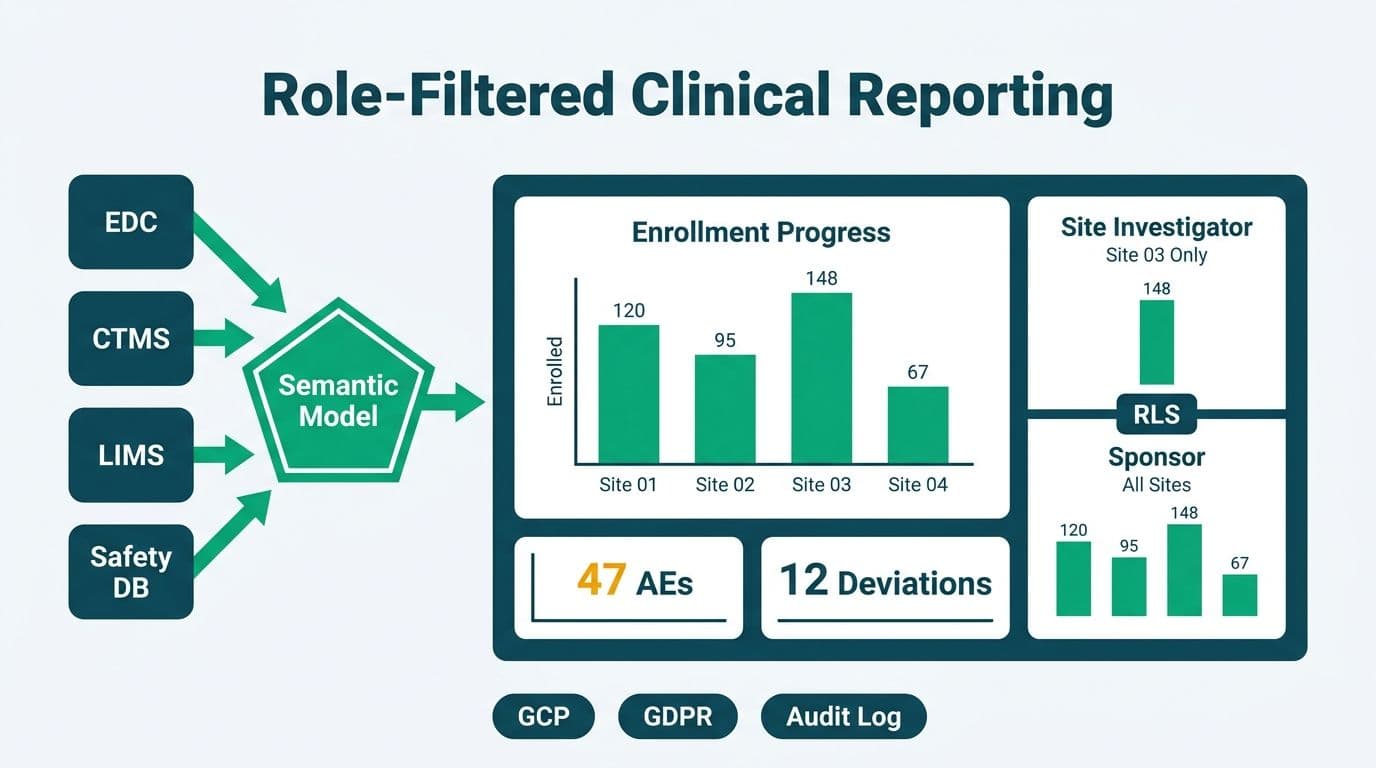
Clinical trial data reporting in Power BI gives CROs, pharma sponsors, and research hospitals a single governed view of enrollment progress, endpoint status, adverse events, and protocol deviations - filtered by role so site investigators see only their own subjects while sponsors see all sites. Row-level security and audit logging keep the setup compliant with ICH E6 GCP and GDPR requirements.
Key Takeaways
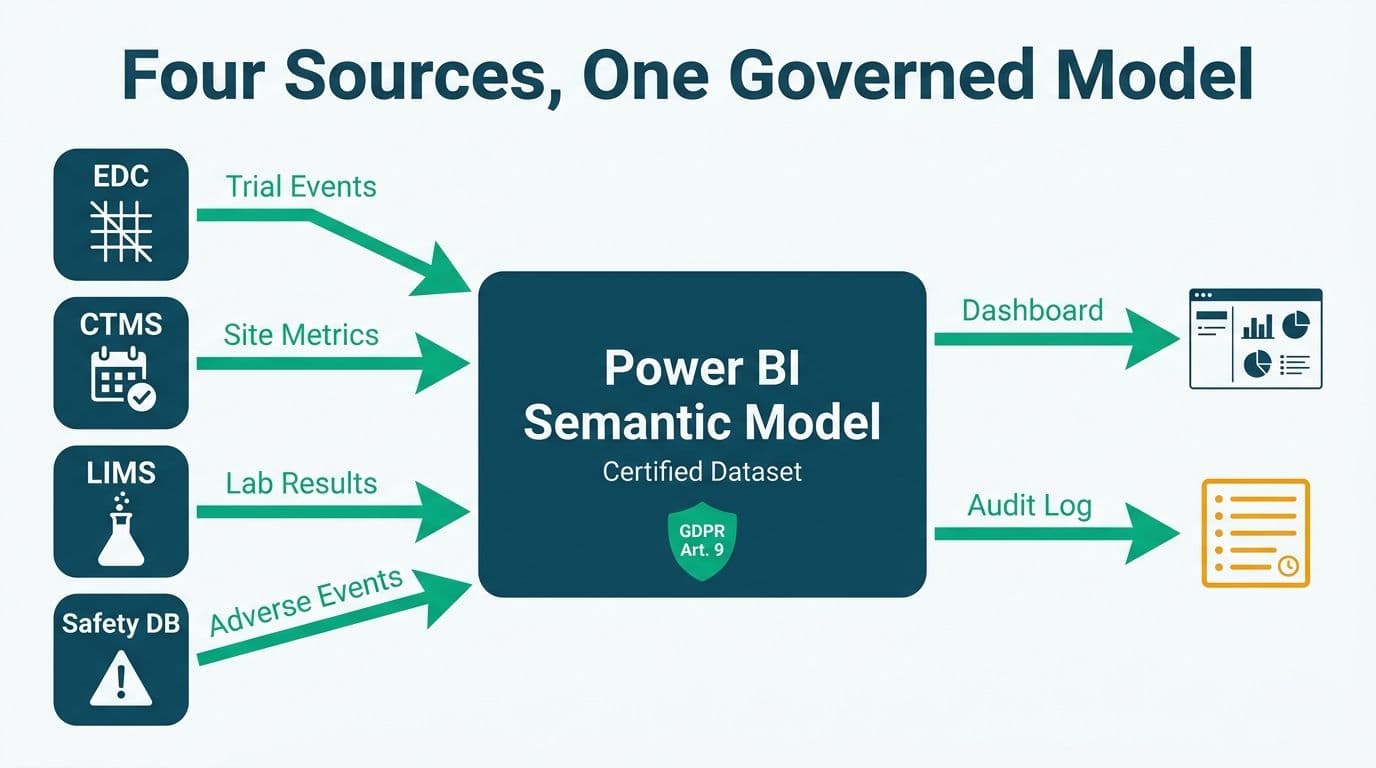
- Power BI integrates EDC, CTMS, LIMS, and safety database feeds into one auditable dashboard environment for clinical trials
- Row-level security (RLS) restricts participant data to authorized personnel at the dataset level, satisfying ICH E6 GCP access control requirements
- Dashboard modules should map to GCP inspection readiness areas: enrollment, endpoints, adverse events, protocol deviations, and data quality
- US trial sites operating as HIPAA-covered entities need a Microsoft Business Associate Agreement in place before storing identifiable participant data in Power BI Service workspaces
- On-premises Power BI Report Server keeps protected health information inside a national firewall; the cloud service suits multi-country sponsor workflows when data residency rules permit
What Is Clinical Trial Data Reporting in Power BI?
Clinical trial data reporting in Power BI is the practice of ingesting study data from electronic data capture systems, clinical trial management systems (CTMS), laboratory information management systems (LIMS), and pharmacovigilance databases into Power BI's columnar data model, then surfacing that data through role-filtered dashboards that investigators, data managers, and sponsors can access without seeing records outside their authorization scope.
The architecture aligns with ICH E6(R3) GCP's expectations for data integrity, traceability, and validated computer systems. It also satisfies GDPR Article 89's requirement that scientific research data be subject to appropriate safeguards - primarily pseudonymization and strict access controls.
Clinical data analysts who design and maintain these reporting environments combine GCP domain knowledge with technical skills in DAX, Power Query, and semantic model design. The governance architecture they build must satisfy both the clinical operations team's need for real-time visibility and the compliance team's requirement for an auditable, access-controlled system a health authority inspector could review without reservation.
Managed Power BI for healthcare teams covers the full implementation lifecycle - from data connector setup and semantic model design to RLS policy deployment - for organizations that cannot staff that work internally. For teams evaluating whether Power BI is the right foundation, our guide to HIPAA compliant BI tools for hospital data visualization benchmarks the options available to US healthcare organizations.
How Do You Set Up Enrollment Tracking in a Clinical Trial Power BI Dashboard?
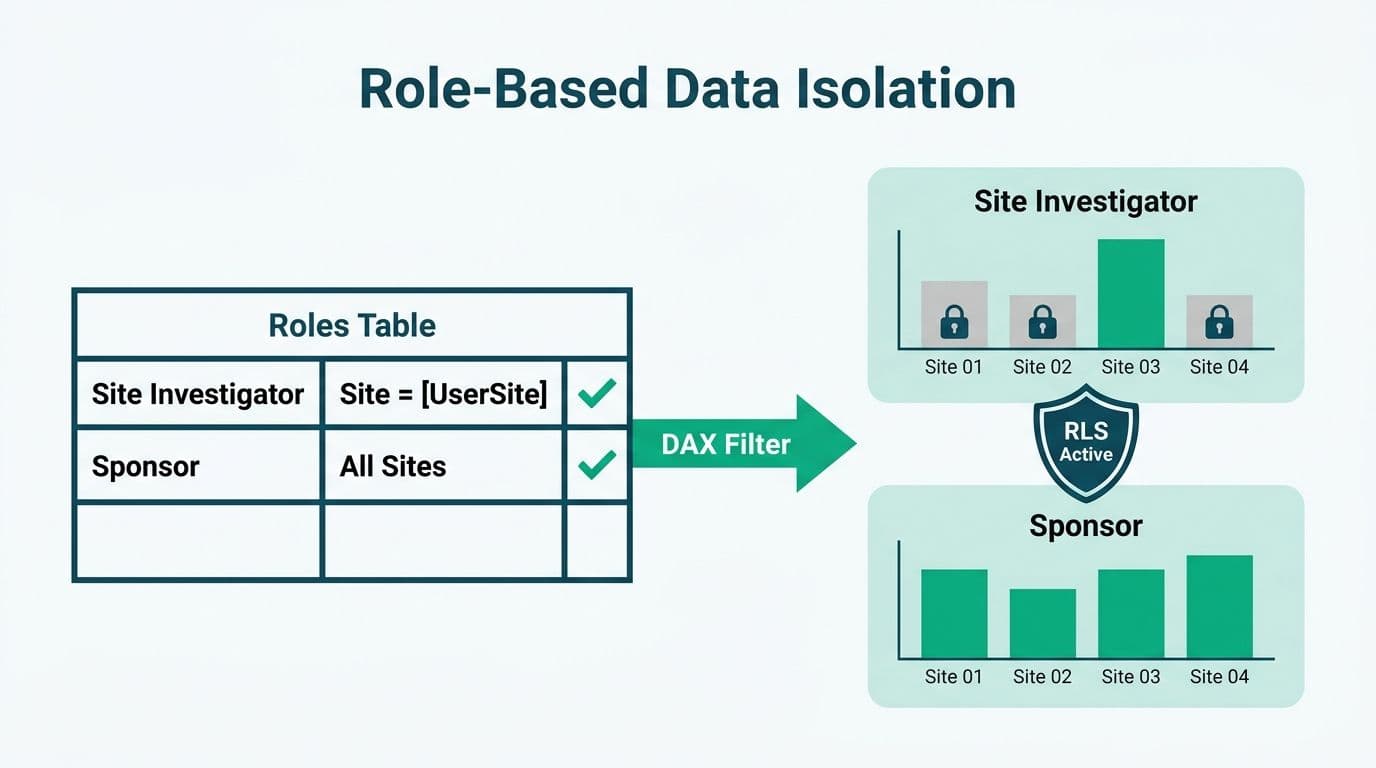
Enrollment tracking is typically the first dashboard module a trial team builds. The goal is a real-time view of screening, consent, randomization, and dropout rates by site, arm, and demographic cohort - the numbers a medical monitor reviews weekly and a sponsor submits to the Data Safety Monitoring Board quarterly.
A standard enrollment module connects to the CTMS or EDC via Power BI's DirectQuery mode (for near real-time refresh) or a scheduled import (for systems without live API access). Core DAX measures include:
- Enrolled vs. target by site and overall, with a percent-to-goal gauge
- Screen failure rate broken down by primary exclusion criterion - critical for identifying protocol amendments that could improve recruitment
- Enrollment velocity expressed as subjects per site per week, used to project the primary completion date based on current pace
- Dropout and withdrawal rate segmented by arm, timepoint, and primary reason
US example
A US academic medical center running a Phase III oncology trial might pull enrollment data from its EDC into a Power BI Premium workspace overnight. The principal investigator's login surfaces only their site's subjects; the sponsor medical monitor sees the cross-site view. This separation is enforced through dynamic power bi row level security policies keyed to the user's email address and their site assignment in an Azure Active Directory security group. Under HIPAA, the academic center and sponsor operate under a Business Associate Agreement with Microsoft covering the Power BI Service, as documented in Microsoft's 2025 Online Services Terms.
UK and EU example
Under GDPR Article 89, clinical trial data processed for scientific research must be pseudonymized where possible. A UK CRO managing a multi-site European trial would configure Power BI to display only pseudonymized participant IDs in the enrollment dashboard, with the subject linkage table held in a separate, restricted dataset accessible only to the data custodian. GDPR's data minimization principle maps naturally to Power BI's field-level suppression and measure-level permissions, which prevent report viewers from exporting underlying participant records even when they can see aggregate enrollment figures.
Canada example
A Canadian research hospital operating under PIPEDA and Health Canada's adaptation of ICH E6 would typically route enrollment data through a Power BI Report Server instance hosted in its own data center. This keeps participant data within Canadian jurisdiction and avoids the cross-border transfer restrictions that apply when cloud workloads process records tied to identifiable individuals.
How Do You Track Endpoints and Adverse Events in Power BI?
Endpoint tracking and adverse event monitoring are where clinical operations teams spend the most inspection preparation time. Power BI handles both through calculated measures in DAX and structured data shapes imported from the EDC or safety database.
Primary endpoint tracking typically involves time-to-event measures (progression-free survival, time to response) or repeated-measure scores aggregated across visits. DAX's `CALCULATE` and `FILTER` functions let analysts slice these by arm, visit window, and eligibility subgroup without pre-aggregating in the source system - preserving the granular audit trail GCP requires.
Protocol deviation tracking draws on coded entries from the EDC. A deviation dashboard should surface deviation count by category (eligibility, dosing, visit window, consent), rate per site and per subject, open versus resolved status with aging, and days to resolution - a metric GCP inspectors check to confirm that corrective and preventive actions were taken promptly.
Adverse event reporting uses a parallel data structure. AE entries classified by system organ class and preferred term using MedDRA coding feed into a matrix visual that maps AE frequency by severity grade against treatment arm, giving the medical monitor a CIOMS-style overview without requiring an Excel export. When the safety database supports a live API, DirectQuery keeps the AE count current between scheduled EDC imports, so the medical monitor is never working from stale safety data.
What Data Governance Controls Does Power BI Offer for GCP and GDPR Compliance?
Power BI's governance stack for clinical trials rests on four controls: row-level security, sensitivity labels, audit logging, and deployment pipelines.
Row-level security (RLS) is the foundational control. ICH E6 GCP requires that site personnel access only their subjects' data. Dynamic RLS roles in Power BI use the `USERPRINCIPALNAME()` DAX function to filter dataset rows at query time based on the signed-in user's identity, returning only the rows their site assignment permits. This scales across large multi-site trials without requiring a static role list per site. For teams migrating from legacy platforms, our Cognos security model vs Power BI RLS comparison maps equivalent access controls across both architectures.
Sensitivity labels from Microsoft Purview (documented in Microsoft's 2025 compliance guidance) allow data custodians to classify datasets as confidential and enforce downstream controls: disabling export to unmanaged devices, blocking download outside approved applications, and generating alerts when datasets are accessed at unusual volume or from unusual locations.
Audit logging via the Microsoft Fabric Admin Portal records every report view, dataset export, and data refresh with a timestamp and the user's principal name. When a health authority inspector requests evidence that only authorized personnel accessed study data, this log is the electronic audit trail ICH E6 Section 5.5.3 expects from validated computerized clinical data systems.
Deployment pipelines separate development, validation, and production workspaces. A new adverse event dashboard is tested against synthetic participant data before it touches live records, enforcing a change-control workflow: a developer promotes a report from development to validation, a QA reviewer approves it, and only then does it reach production - satisfying GCP's validated computer systems requirement without a separate validation platform.
Clinical Trial Data Reporting in Power BI: Dashboard Module Reference
The table below maps each clinical trial domain to its Power BI module, typical data source, and primary governance control. This structure supports inspection readiness under ICH E6(R3): each domain is access-controlled, auditable, and tied to a data lineage trail.
| Trial Domain | Dashboard Module | Typical Data Source | Primary Governance Control |
|---|---|---|---|
| Enrollment | Screening funnel, site velocity, projected close | CTMS, EDC | Dynamic RLS by site |
| Primary endpoint | Time-to-event, repeated-measure score | EDC, LIMS | RLS by arm + sensitivity label |
| Adverse events | AE frequency by MedDRA SOC/PT and grade | Safety database, EDC | RLS by site + export disabled |
| Protocol deviations | Count by category, days to resolution | EDC | RLS by site |
| Data quality | Missing field rate, open query rate | EDC | Data custodian access only |
| Regulatory readiness | Integrated visit-window summary | EDC + CTMS | Production pipeline only |
What Should a Power BI Healthcare Dashboard Template Include for Clinical Trials?
A reusable power bi healthcare dashboard template for clinical trials needs more than visuals - it needs a semantic model that enforces consistent metric definitions so that "enrolled" means the same thing in a site investigator's filtered view as it does in the sponsor's cross-trial summary.
Core template components:
- Date table with visit-window logic (planned date, actual date, window compliance flag, days off schedule)
- Subject dimension with pseudonymized ID, site code, treatment arm, enrollment date, and withdrawal date
- Event fact table pre-joined to MedDRA hierarchy for adverse event classification
- Deviation fact table with category coding aligned to the protocol deviation management plan
- Data quality measures tracking missing field rates by form, visit, and site
- RLS role scaffold with a dynamic filter table mapping user email to site code and sponsor flag
Templates deployed via Power BI Report Server differ from cloud-deployed templates in their refresh architecture: on-premises deployments use SQL Server Agent for scheduling; cloud deployments use Power BI dataflows and Fabric pipelines. Our comparison of Power BI Report Server vs Power BI Service for healthcare covers the refresh and licensing implications in detail.
The underlying data modeling discipline is consistent regardless of deployment mode. Our hospital readmission rate analytics dashboard guide illustrates how the same structured approach - subject dimension, event fact table, standardized date logic - applies across different clinical metric domains.
When Should a Trial Site Choose Power BI Report Server Over the Cloud Service?
The choice between Power BI Report Server (on-premises) and Power BI Service (cloud) turns on data residency requirements, existing Microsoft licensing, and the trial's collaboration model.
Choose Power BI Report Server when:
- Your IRB or data use agreement prohibits participant data from leaving a specific national jurisdiction - common for Canadian trials under PIPEDA and for EU member states with stricter GDPR implementations
- Your organization lacks a Microsoft 365 GCC High tenant that satisfies US federal data sovereignty requirements for federally funded trials
- Your CTMS or EDC system cannot provision a cloud-compatible API and your entire data pipeline runs on-premises
Choose Power BI Service when:
- Your sponsor organization is on Microsoft 365 and can add the clinical trial workspace to an existing Power BI Premium capacity under an established Microsoft BAA
- You need real-time collaboration across a CRO in London, a sponsor team in New Jersey, and a contract lab in Toronto - cloud workspaces handle cross-organization sharing natively through Azure Active Directory B2B
- Your HIPAA Business Associate Agreement with Microsoft is already in place (Microsoft's 2025 BAA covers Power BI Service workspaces)
For most multi-country industry-sponsored trials, the cloud path is operationally simpler. Deploying on-premises servers at each participating site creates more compliance surface area rather than less, and Microsoft's regional data center options across the EU, UK, US, and Canada allow organizations to select a data residency region aligned with local regulatory requirements.
---
About Lets Viz: Lets Viz has delivered governed analytics for US healthcare systems, UK fintech firms, Canadian manufacturers, and global SaaS companies since 2020, earning a 5.0 rating on Clutch. Our Power BI practice spans HIPAA-regulated clinical data environments, row-level security architecture, and full-lifecycle dashboard delivery from semantic model design through inspection-readiness validation.
Ready to move your trial reporting off spreadsheets and into a governed Power BI environment? Managed Power BI for healthcare teams outlines our engagement model and delivery approach for regulated clinical data settings.