AI Explain NRR to Your SaaS Board: What to Validate First
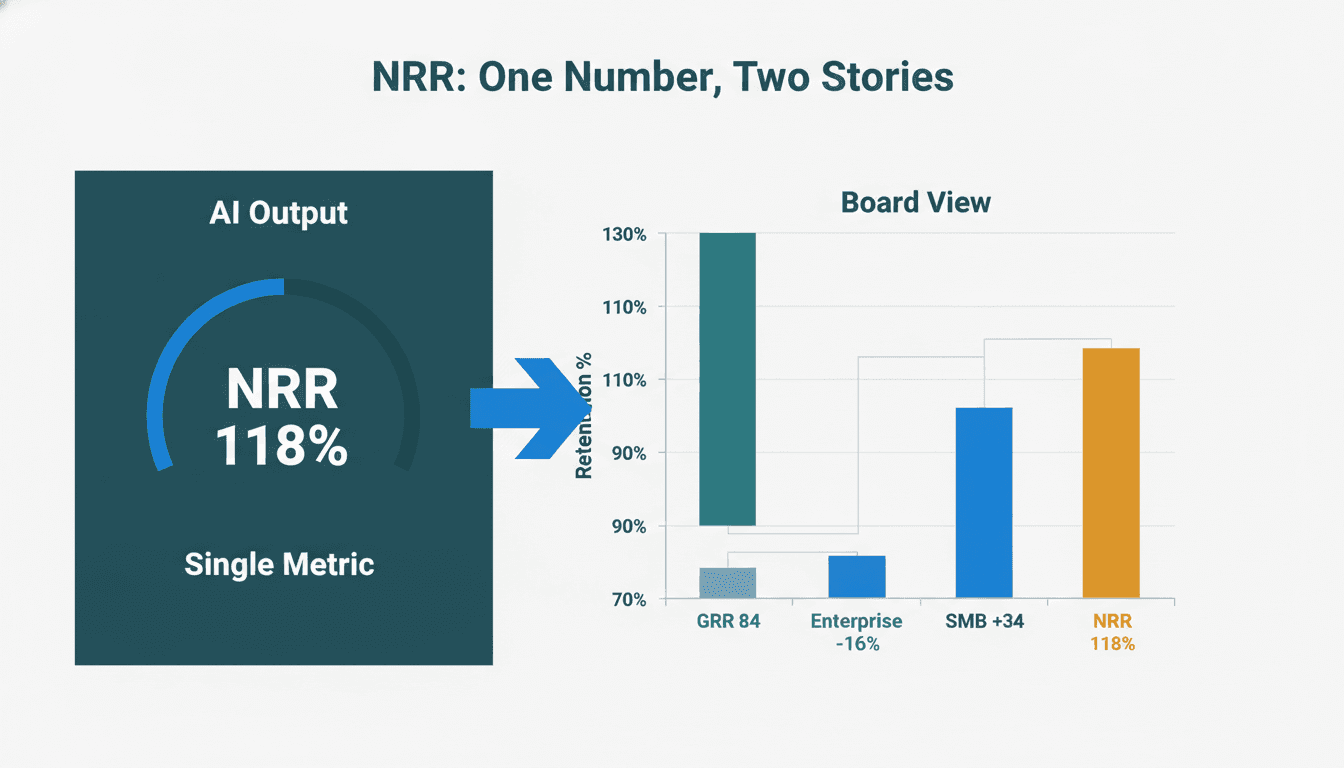
Net Revenue Retention (NRR) is the percentage of recurring revenue retained from an existing customer cohort after accounting for expansion, contraction, and churn. When AI tools generate NRR commentary for a board deck, they routinely return a single headline number that is accurate in isolation but misleading as a story. The specific failure mode: enterprise accounts churning while SMB expansion props up the aggregate figure, a pattern that stays invisible until the upsell engine slows. The correct approach separates gross retention from net retention and validates the data model before any AI-generated slide reaches a board member.
Key Takeaways
- NRR and GRR are different diagnostics: a high NRR paired with a low GRR signals expansion-masked churn that boards need to see as separate lines, not a blended rate.
- AI summarization tools return what the data model exposes - if NRR is pre-aggregated into a single field, no AI layer can decompose it into GRR without explicit waterfall measure design.
- The correct board NRR narrative starts with Gross Revenue Retention, then layers in expansion to arrive at NRR - not the reverse.
- Five validation checks catch the majority of AI-generated NRR errors before the boardroom: cohort integrity, churn bucket classification, expansion attribution, currency normalization, and segment breakout.
- Copilot for Power BI produces reliable NRR narrative only when the semantic model includes separate, described measures for each waterfall component.
What Is NRR and Why Does AI Get It Wrong in SaaS Finance?
NRR measures whether an existing customer cohort is generating more or less revenue than it did in the prior period - expansion credit included, churn and contraction deducted. A 110% NRR means the existing base is contributing 10% more in aggregate. AI gets this wrong not because it miscalculates, but because it answers the question asked rather than the question that matters for governance.
The structural failure is specific. Most AI query layers - including the natural-language summarization interfaces sitting on top of BI platforms - operate against whatever metric columns are pre-aggregated in the data model. If the semantic model stores a single net revenue field rather than a decomposed MRR waterfall (new MRR, expansion MRR, contraction MRR, churn MRR), the AI has no mechanism to distinguish Gross Revenue Retention from NRR. It returns the net figure, labels it correctly, and the incompleteness is structurally invisible to anyone reviewing only the output.
Consider a US SaaS finance team reporting 120% NRR for the quarter. Three enterprise accounts, each at $200K ARR, churned during the period. A broad cohort of SMB accounts expanded by a combined $800K. The board deck shows 120% NRR and no visible signal of concern. What is missing from that figure is that the enterprise segment GRR is running at approximately 70%, indicating a retention problem that SMB expansion cannot sustain if growth slows or if enterprise budget freezes extend into subsequent quarters. The AI produced a technically correct NRR and told an incomplete story.
This is not an edge case. It is the default output of any AI tool querying a model that does not pre-separate the waterfall components, and it is exactly the failure mode that finance leaders need to recognize before relying on AI-generated board narratives.
What Is the Difference Between NRR and GRR, and Why Do Boards Need Both?
GRR (Gross Revenue Retention) measures only what was retained - no expansion credit applied. It is the floor beneath NRR and the cleaner signal for product stickiness and underlying churn risk. Boards and audit committees use GRR to assess whether the core customer base is stable or eroding before growth initiatives are applied to the headline number.
| Metric | Formula | Diagnostic Signal | Typical Mid-Market Range |
|---|---|---|---|
| GRR | (Start MRR - Churn MRR - Contraction MRR) / Start MRR | Core retention before upsell | 80-90% |
| NRR | (Start MRR + Expansion MRR - Churn MRR - Contraction MRR) / Start MRR | Net growth from existing cohort | 100-120% healthy |
| NDR | Identical to NRR; alternate investor label | Same as NRR | Same as NRR |
The diagnostic gap between GRR and NRR is the critical signal AI conflates. If NRR is 110% and GRR is 72%, the business is running a structural retention deficit that expansion revenue is currently covering. That arrangement is not sustainable if the upsell motion decelerates - a scenario common during enterprise budget cycles in the UK and EU, where GDPR compliance reviews frequently trigger SaaS rationalization that compresses contraction and churn into the same renewal quarter.
For UK and EU boards, this timing effect matters: GDPR-driven contract reviews often produce delayed signals, with contraction hitting one to two quarters after the compliance audit. An AI-generated NRR that does not segment by renewal cohort or fiscal period will miss this lag entirely, presenting a smooth retention trend over a period that contains a structural inflection.
AI summarization tools collapse this distinction because they return what is stored. This is precisely why Power BI consulting (Copilot-ready) engagements involving board-deck automation always begin with a data model audit rather than a visualization sprint - the dashboard layer can only be as honest as the metric decomposition beneath it.
How Should AI Explain NRR in the Correct Board Deck Narrative Structure?
The correct NRR narrative structure for a board presentation moves from gross retention down to net retention, not the reverse. This sequencing gives board members the ability to evaluate product stickiness before expansion is credited - separating the "did we retain customers" question from the "did we grow them" question.
Step 1 - Define and state starting cohort MRR. Beginning-of-period recurring revenue for the same customer list as the prior close. New logos are excluded entirely. State customer count alongside the dollar figure so the board can evaluate concentration risk within the retained base.
Step 2 - Subtract churn MRR. Accounts that cancelled entirely, expressed in dollar terms first, then as a percentage of starting MRR. A single large enterprise cancellation can make a churn rate look controlled while the dollar impact is material - presenting both removes the ambiguity.
Step 3 - Subtract contraction MRR. Accounts that reduced spend but remained active. This line is commonly driven by budget rationalization. Canadian SaaS companies serving regulated industries under PIPEDA should note that procurement policy reviews at large Canadian firms often concentrate contractions into fiscal year-end, making Q4 contraction lines appear larger than the underlying churn risk warrants - a distinction the board narrative should surface explicitly.
Step 4 - Present GRR. Calculated as (Start MRR - Churn MRR - Contraction MRR) divided by Start MRR. This is the single most important retention figure for boards assessing product-market stickiness independent of the sales and upsell motion.
Step 5 - Add expansion MRR. Seat additions, tier upgrades, and cross-sells from prior-period customers only. Upsells within a new logo's first contract term belong in a separate new-business expansion line.
Step 6 - Present NRR. With the full waterfall visible, the board can see what the expansion motion contributed and whether it is genuinely outpacing churn or covering a retention deficit that will compound if growth slows.
When Copilot for Power BI generates NRR narrative, a well-structured semantic model and a deliberate prompt pattern can produce this six-step waterfall automatically. Without those inputs, Copilot defaults to whatever aggregated measure the model exposes - typically a single NRR percentage with a period-over-period delta and no GRR breakout.
For teams routing board decks through automated Power BI report distribution, the report template itself should enforce this waterfall structure so every scheduled export includes the GRR line regardless of which analyst triggers the render.
What Should You Validate in NRR Before Presenting to the Board?
Validation is the professional firewall between an AI-generated summary and a board-ready number. These five checks catch the majority of AI NRR errors before they reach the boardroom.
Cohort integrity. Confirm the denominator is start-of-period MRR for the identical customer list, not all currently active accounts. AI tools that query "active customers" pull in new logos and inflate the starting MRR base, which artificially deflates apparent churn rates and overstates retention across the board.
Churn bucket classification. Verify that churned accounts appear in the churn MRR line, not as zero-revenue active accounts. In many CRM-to-billing data pipelines, a cancelled account remains marked active in the CRM until someone manually closes it. The AI reads their $0 MRR as contraction rather than churn - understating churn, overstating GRR, and producing a misleadingly stable retention picture. This is one of the most common sources of silent NRR inflation in mid-market SaaS reporting.
Expansion attribution. Confirm expansion MRR is drawn exclusively from prior-period customers. New logos whose second-month invoice is being classified as upsell revenue will inflate NRR without any genuine retention dynamic underneath the number.
Currency normalization. For SaaS companies with UK, EU, and Canadian cohorts alongside US accounts, verify the semantic model converts all revenue to a single reporting currency before computing retention percentages. An AI summary aggregating GBP, EUR, CAD, and USD without currency conversion produces a numerically incorrect aggregate that can resemble a retention trend while reflecting exchange rate movement. For Canadian organizations processing board-level financial data through AI summarization layers, PIPEDA-aligned data handling requirements should also be confirmed for any Copilot features that transmit data outside the designated Fabric region.
Segment breakout. Run NRR and GRR separately for enterprise, mid-market, and SMB segments before presenting a portfolio-level figure. Portfolio-level validation will not surface the enterprise churn scenario described in this article - the entire purpose of this step is to make segment-level problems visible before the board deck smooths them into a headline rate.
The row-level validation discipline here is not optional. When we rebuilt a support metric for a home-services company whose system stored zero hours for unanswered tickets - causing every ignored ticket to appear instantly resolved - we validated the corrected measure across 105,704 individual ticket records with zero mismatches before it was presented to leadership. NRR cohort validation requires the same standard: a sample audit of the underlying revenue transaction table is not a substitute for full-population verification when the output is a board-level retention figure.
How Does Copilot for Power BI Handle NRR in SaaS Finance Reporting?
Copilot for Power BI, as documented in Microsoft's 2025 Fabric release notes, generates DAX expressions and natural-language summaries based on the measures and column metadata it detects in the semantic model. It does not infer metric intent from column names alone - it responds to what is explicitly modeled and described.
Three implementation requirements enable reliable AI-generated NRR narrative for board SaaS finance use cases.
Decomposed waterfall measures. Create explicit Power BI measures for each NRR component: `[Starting MRR]`, `[Churn MRR]`, `[Contraction MRR]`, `[Expansion MRR]`, `[New MRR]`, `[GRR %]`, `[NRR %]`. A single aggregated `[NRR]` measure is structurally insufficient for AI decomposition - Copilot will summarize the result but cannot explain the composition or generate a GRR line without pre-modeled source measures.
Measure descriptions. Copilot reads the description field of each measure in the semantic model to understand context and intent. A `[GRR %]` measure described as "Gross Revenue Retention: percentage of start-of-period MRR retained after churn and contraction, before expansion - use alongside NRR % to assess retention independent of upsell motion" gives Copilot the framing to surface GRR in any NRR-related query without requiring the analyst to prompt for it explicitly.
Calculation groups for period logic. Rolling 12-month NRR over a sliding cohort window is a standard board ask. A calculation group handles the cohort period offset cleanly, and Copilot can reference it in natural-language queries without generating filter context errors. The DAX CALCULATE function finance examples reference covers the filter context patterns that underpin cohort-level retention measures in Power BI.
For BI leads building a broader AI data strategy framework for finance reporting - covering ARR bridge, margin analysis, and pipeline coverage alongside NRR - the validation and decomposition patterns described here generalize across each of those domains. An AI anomaly detection pipeline for financial reporting adds a systematic detection layer that flags when AI-generated summaries diverge from expected ranges, providing an automated check on the board-deck pipeline rather than relying entirely on pre-export manual validation.
---
About Lets Viz: Lets Viz has delivered data analytics and BI consulting since 2020, working with US SaaS finance teams, UK fintech firms, Canadian manufacturing operations, and global mid-market businesses across industries. The practice holds a 5.0 Clutch rating and specializes in Copilot-ready Power BI semantic layer design, board-grade financial reporting, and AI data strategy for finance teams. Engagements align to SOC 2 requirements for US clients, GDPR for UK and EU organizations, and PIPEDA for Canadian companies as applicable.
If your board deck relies on AI-generated NRR commentary, the semantic model and cohort logic behind it should be validated before the next meeting. Power BI consulting (Copilot-ready) starts with a data model audit that confirms your NRR waterfall, GRR breakout, and cohort boundaries are sound - so the number your AI explains is the number your board should act on.