Tableau Funtion: WINDOW_COVARP( )
 Reviewed by Neetu Singla — Founder, Lets Viz Technologies — AI & Data Consultant. Last reviewed July 3, 2026.
Tableau Function: WINDOW_COVARP( )
Category: Table Calculation Functions
What Is the Function?
Purpose of the Function
The WINDOW_COVARP() function in Tableau is a table calculation that computes the population covariance between two aggregated expressions within a defined window of rows in a partition.
In simple terms, WINDOW_COVARP() answers:
“How do these two measures move together across the entire population within this window?”
Unlike WINDOW_COVAR(), which calculates sample covariance, WINDOW_COVARP() uses the population covariance formula.
Type of Calculations
Table calculations
Window-based statistical analysis
Population covariance calculation
Post-aggregation analytics
It measures how two variables change together across a defined window, assuming the data represents the entire population, not a sample.
Practical Use Cases
Analyzing full dataset relationships
Financial portfolio variance modeling
Measuring KPI co-movement
Rolling covariance analysis
Supporting correlation and variance calculations
WINDOW_COVARP(expression1, expression2, [start, end])
| Parameter | Type | Description |
|---|---|---|
| expression1 | Aggregate / table calculation | First numeric expression used in the covariance calculation. Must be aggregated. |
| expression2 | Aggregate / table calculation | Second numeric expression used in the covariance calculation. Must be aggregated. |
| start (optional) | Integer | Starting row offset relative to the current row. |
| end (optional) | Integer | Ending row offset relative to the current row. |
How It Works?
Mathematical / Logical Principle
WINDOW_COVARP() calculates population covariance using:
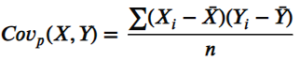
Where:
Xi, Yi = individual values
Xˉ, Yˉ = means
n = total number of rows in window
Difference from WINDOW_COVAR()
| Function | Formula Denominator |
|---|---|
| WINDOW_COVAR() | n – 1 (sample) |
| WINDOW_COVARP() | n (population) |
Return Value
Data Type: Numeric (Decimal)
Meaning:
Positive → Variables move in the same direction
Negative → Variables move in opposite directions
Zero → No linear relationship
Scale-dependent value
When Should We Use It?
Use WINDOW_COVARP() when:
Your data represents the entire population
You need exact population-level covariance
Performing financial modeling
Computing portfolio variance
Building full-dataset statistical dashboards
Basic Usage
Population covariance across full partition
WINDOW_COVARP(SUM([Sales]), SUM([Profit]))
Returns one covariance value repeated across partition
Column Usage
Rolling 6-period population covariance
WINDOW_COVARP(SUM([Sales]), SUM([Profit]), -5, 0)
Computes covariance for current and previous five rows
Covariance per region
WINDOW_COVARP(SUM([Sales]), SUM([Profit]))
(with Compute Using set per Region)
Calculates covariance independently per region
Advanced Usage
Manual population correlation
WINDOW_COVARP(SUM([Sales]), SUM([Profit]))
/
(
WINDOW_STDEVP(SUM([Sales]))
*
WINDOW_STDEVP(SUM([Profit]))
)
Derives correlation using population formulas
Dynamic window size parameter
WINDOW_COVARP(
SUM([Sales]),
SUM([Profit]),
-[Window Size],
0
)
Enables interactive rolling covariance analysis
Tips and Tricks
Use when working with full datasets rather than samples
Ensure consistent sorting for time-based analysis
Use
WINDOW_CORR()if you need standardized outputSensitive to outliers
Scale-dependent results can be misleading for comparison
Related Functions
Functions commonly used alongside or as alternatives to WINDOW_COVARP():
WINDOW_COVAR()WINDOW_CORR()WINDOW_STDEV()WINDOW_STDEVP()WINDOW_VAR()WINDOW_VARP()
We’ve got plenty of resources to help you master Tableau functions. For more details, check out the official Tableau documentation. Or, if you’re ready for more practice, let’s dive into related functions and build your Tableau skills further!
If you’re ready to harness the full power of Tableau and elevate your data analytics capabilities, our expert Tableau consulting services are here to guide you. Whether you need support with building advanced calculated fields, creating dynamic visual dashboards, or optimizing your data sources for peak performance, our team of experienced Tableau consultants delivers customized solutions designed for your business needs. Visit our Tableau Consulting page to discover how we can help your organization turn data into impactful, insight-driven decisions.
It calculates the population covariance between two measures within a defined window.
WINDOW_COVARP() uses n in the denominator (population), while WINDOW_COVAR() uses n-1 (sample).
Yes, it is evaluated after aggregation and depends on the view layout.
When your dataset represents the entire population rather than a sample.
No, it measures linear co-movement only.
Working with Tableau — or thinking about Power BI?
We work both sides. Tableau-certified for production work and complex calcs, and we've shipped 12+ Tableau-to-Power BI migrations with 100% parity testing and 30–60% license savings.
Tableau-certified12+ migrations100% parity
