Tableau Funtion: WINDOW_VAR()
 Reviewed by Neetu Singla — Founder, Lets Viz Technologies — AI & Data Consultant. Last reviewed July 3, 2026.
Tableau Function: WINDOW_VAR( )
Category: Table Calculation Functions
What Is the Function?
WINDOW_VAR() is a table calculation function in Tableau that computes the sample variance of an expression within a specified window (partition) of data in a visualization.
Purpose
It measures how spread out values are from their mean within a defined window, using the sample variance formula (dividing by n−1).
Type of Calculation
Table Calculation
Statistical dispersion measure
Operates on aggregated numeric measures (e.g.,
SUM(Sales))Computed after the query results are returned to Tableau
Practical Use Cases
Measuring volatility in monthly sales
Comparing variability across regions or categories
Creating statistical process control dashboards
Detecting unstable KPIs
Supporting advanced calculations (e.g., standard deviation, risk metrics)
Analyzing financial performance dispersion
WINDOW_VAR(expression, [start, end])
| Parameter | Type | Description |
|---|---|---|
expression | Column (Aggregated Measure) | The numeric field to calculate sample variance for (e.g., SUM(Sales)) |
start | Scalar (Integer, Optional) | Offset from the current row defining the start of the window |
end | Scalar (Integer, Optional) | Offset from the current row defining the end of the window |
How It Works?
Mathematical Principle
Sample variance formula:
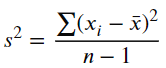
Where:
xi= individual values
xˉ = mean
n = number of observations
Tableau’s Process:
Aggregates the expression within the window
Calculates the mean
Computes squared differences from the mean
Divides by n − 1
Returns the variance
Return Value
Data Type: Numeric (Float)
Meaning: Returns the sample variance of the values within the defined window.
Variance represents the average of squared deviations from the mean (using n−1 in the denominator).
When Should We Use It?
Use WINDOW_VAR() when:
Analyzing variability within categories
Measuring sales dispersion across time
Supporting statistical modeling
Building volatility dashboards
Creating custom statistical calculations
Comparing consistency between business units
Basic Usage
Calculate sample variance across entire partition:
WINDOW_VAR(SUM(Sales))
Column Usage
Calculate monthly sales variance within each Region:
WINDOW_VAR(SUM(Sales))
Set:
Partition by → Region
Compute Using → Month
Advanced Usage
Rolling 6-Month Variance
WINDOW_VAR(SUM(Sales), -5, 0)
Calculates variance for:
Current month
Previous 5 months
Variance-Based Control Limits
Upper limit using standard deviation:
WINDOW_AVG(SUM(Sales)) +
2 * SQRT(WINDOW_VAR(SUM(Sales)))
Z-Score Using Variance
(SUM(Sales) - WINDOW_AVG(SUM(Sales)))
/ SQRT(WINDOW_VAR(SUM(Sales)))
Tips and Tricks
- Use when you need variance specifically (not standard deviation)
- Combine with
SQRT()to derive standard deviation - Configure Compute Using carefully
- Sort time dimensions correctly for rolling calculations
Common Pitfalls:
Returns
NULLwith fewer than two valuesConfusing sample vs. population variance
Incorrect partitioning leads to misleading insights
Table calculations impact performance on large datasets
Related Functions
WINDOW_VARP()(Population variance)WINDOW_STDEV()WINDOW_STDEVP()VAR()(Aggregate function)WINDOW_AVG()WINDOW_SUM()
We’ve got plenty of resources to help you master Tableau functions. For more details, check out the official Tableau documentation. Or, if you’re ready for more practice, let’s dive into related functions and build your Tableau skills further!
If you’re ready to harness the full power of Tableau and elevate your data analytics capabilities, our expert Tableau consulting services are here to guide you. Whether you need support with building advanced calculated fields, creating dynamic visual dashboards, or optimizing your data sources for peak performance, our team of experienced Tableau consultants delivers customized solutions designed for your business needs. Visit our Tableau Consulting page to discover how we can help your organization turn data into impactful, insight-driven decisions.
WINDOW_VAR() calculates sample variance (divides by n−1), while WINDOW_VARP() calculates population variance (divides by n).
No. It returns variance. Use SQRT(WINDOW_VAR(...)) to calculate standard deviation.
It returns NULL when the window contains fewer than two values.
Yes:
WINDOW_VAR(SUM(Sales), -5, 0)No. It is a table calculation computed in Tableau after query results are returned.
Working with Tableau — or thinking about Power BI?
We work both sides. Tableau-certified for production work and complex calcs, and we've shipped 12+ Tableau-to-Power BI migrations with 100% parity testing and 30–60% license savings.
Tableau-certified12+ migrations100% parity
