Tableau Funtion: WINDOW_CORR( )
 Reviewed by Neetu Singla — Founder, Lets Viz Technologies — AI & Data Consultant. Last reviewed July 3, 2026.
Tableau Function: WINDOW_CORR( )
Category: Table Calculation Functions
What Is the Function?
Purpose of the Function
The WINDOW_CORR() function in Tableau is a table calculation that computes the Pearson correlation coefficient between two aggregated expressions within a defined window of rows in a partition.
In simple terms, WINDOW_CORR() answers:
“How strongly are these two measures related within this window?”
Type of Calculations It Performs
Table calculations
Window-based statistical calculations
Correlation analysis
Post-aggregation analytics
It measures the linear relationship between two numeric expressions across a specified window.
Practical Use Cases
Measuring relationship between Sales and Profit
Evaluating correlation between marketing spend and revenue
Analyzing performance metrics over time
Detecting positive or negative trends within rolling windows
Building statistical dashboards
WINDOW_CORR(expression1, expression2, [start, end])
| Parameter | Type | Description |
|---|---|---|
| expression1 | Aggregate / table calculation | The first numeric expression used in the correlation calculation. Must be aggregated. |
| expression2 | Aggregate / table calculation | The second numeric expression used in the correlation calculation. Must be aggregated. |
| start (optional) | Integer | Starting row offset relative to the current row. |
| end (optional) | Integer | Ending row offset relative to the current row. |
How It Works?
Mathematical / Logical Principle
WINDOW_CORR() calculates the Pearson correlation coefficient:
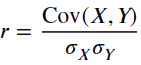
Where:
Cov(X, Y) = covariance between X and Y
σX = standard deviation of X
σY = standard deviation of Y
Conceptually:
WINDOW_CORR = Correlation between expression1 and expression2 within the defined windowReturn Value
Data Type: Numeric (Decimal)
Range:
-1to1Meaning:
1→ Perfect positive correlation0→ No linear correlation-1→ Perfect negative correlation
When Should We Use It?
Use WINDOW_CORR() when you need to:
Analyze statistical relationships between two measures
Detect strength and direction of trends
Perform rolling correlation analysis
Build analytical dashboards with advanced metrics
Compare metrics dynamically within partitions
Basic Usage
Correlation across full partition
WINDOW_CORR(SUM([Sales]), SUM([Profit]))
Returns a single correlation value repeated across the partition
Column Usage
Rolling 6-period correlation
WINDOW_CORR(SUM([Sales]), SUM([Profit]), -5, 0)
Computes correlation for the current row and previous five rows
Correlation within regions
WINDOW_CORR(SUM([Sales]), SUM([Profit]))
(with Compute Using set per Region)
Measures correlation independently per region
Advanced Usage
Highlight strong relationships
IF ABS(WINDOW_CORR(SUM([Sales]), SUM([Profit]))) > 0.7
THEN "Strong Correlation"
ELSE "Weak/Moderate"
END
Categorizes relationship strength
Dynamic window using parameter
WINDOW_CORR(
SUM([Sales]),
SUM([Profit]),
-[Window Size],
0
)
Allows interactive rolling analysis
Tips and Tricks
Ensure sufficient data points (minimum 2 rows)
Always define sorting for time-based analysis
Use absolute value (
ABS()) to measure strength regardless of directionSensitive to outliers
Only measures linear relationships
Related Functions
Functions commonly used alongside or as alternatives to WINDOW_CORR():
WINDOW_COVAR()WINDOW_AVG()WINDOW_SUM()WINDOW_STDEV()CORR()(database-level correlation, if supported)RUNNING_AVG()
We’ve got plenty of resources to help you master Tableau functions. For more details, check out the official Tableau documentation. Or, if you’re ready for more practice, let’s dive into related functions and build your Tableau skills further!
If you’re ready to harness the full power of Tableau and elevate your data analytics capabilities, our expert Tableau consulting services are here to guide you. Whether you need support with building advanced calculated fields, creating dynamic visual dashboards, or optimizing your data sources for peak performance, our team of experienced Tableau consultants delivers customized solutions designed for your business needs. Visit our Tableau Consulting page to discover how we can help your organization turn data into impactful, insight-driven decisions.
It calculates the Pearson correlation coefficient between two measures within a defined window.
It returns values between -1 and 1.
Yes, it is evaluated after aggregation and depends on the view layout.
Yes, by specifying start and end offsets.
No, it only measures linear correlation.
Working with Tableau — or thinking about Power BI?
We work both sides. Tableau-certified for production work and complex calcs, and we've shipped 12+ Tableau-to-Power BI migrations with 100% parity testing and 30–60% license savings.
Tableau-certified12+ migrations100% parity
