Tableau Funtion: WINDOW_COVAR( )
 Reviewed by Neetu Singla — Founder, Lets Viz Technologies — AI & Data Consultant. Last reviewed July 3, 2026.
Tableau Function: WINDOW_COVAR( )
Category: Table Calculation Functions
What Is the Function?
Purpose of the Function
The WINDOW_COVAR() function in Tableau is a table calculation that computes the covariance between two aggregated expressions within a defined window of rows in a partition.
In simple terms, WINDOW_COVAR() answers:
“How do these two measures move together within this window?”
Type of Calculations
Table calculations
Window-based statistical analysis
Covariance calculations
Post-aggregation analytics
It measures the degree to which two variables change together, but unlike correlation, it does not normalize the result.
Practical Use Cases
Understanding directional relationships between two measures
Supporting correlation analysis
Identifying co-movement between KPIs
Performing rolling statistical analysis
Building advanced financial or performance dashboards
WINDOW_COVAR(expression1, expression2, [start, end])
| Parameter | Type | Description |
|---|---|---|
| expression1 | Aggregate / table calculation | First numeric expression used in the covariance calculation. Must be aggregated. |
| expression2 | Aggregate / table calculation | Second numeric expression used in the covariance calculation. Must be aggregated. |
| start (optional) | Integer | Starting row offset relative to the current row. |
| end (optional) | Integer | Ending row offset relative to the current row. |
How It Works?
Mathematical / Logical Principle
WINDOW_COVAR() calculates the covariance using:
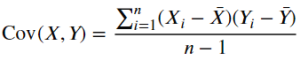
Where:
Xi, Yi = individual values
, Yˉ = means
n = number of rows in window
Conceptually:
WINDOW_COVAR = Average of product of deviations within window
Unlike correlation, covariance is influenced by the scale of the data.
Return Value
Data Type: Numeric (Decimal)
Meaning:
Positive value → Variables increase or decrease together
Negative value → One increases while the other decreases
Near zero → Weak or no linear relationship
Scale-dependent (not standardized)
When Should We Use It?
Use WINDOW_COVAR() when you need to:
Analyze joint variability between two measures
Support advanced statistical calculations
Detect co-movement in financial data
Compute rolling covariance for time-series
Build statistical dashboards
Basic Usage
Covariance across entire partition
WINDOW_COVAR(SUM([Sales]), SUM([Profit]))
Returns a single covariance value repeated across rows
Column Usage
Rolling 6-period covariance
WINDOW_COVAR(SUM([Sales]), SUM([Profit]), -5, 0)
Computes covariance over current and previous five rows
Covariance within partitions
WINDOW_COVAR(SUM([Sales]), SUM([Profit]))
(with Compute Using set per Region)
Calculates covariance independently per region
Advanced Usage
Manual correlation calculation
WINDOW_COVAR(SUM([Sales]), SUM([Profit]))
/
(
WINDOW_STDEV(SUM([Sales]))
*
WINDOW_STDEV(SUM([Profit]))
)
Derives correlation from covariance
Flag strong co-movement
IF ABS(WINDOW_COVAR(SUM([Sales]), SUM([Profit]))) > [Threshold]
THEN "Strong Co-Movement"
ELSE "Weak"
END
Categorizes relationship strength
Tips and Tricks
Ensure sufficient data points (minimum 2 rows)
Always define sorting for time-based analysis
Use
WINDOW_CORR()when you need standardized comparisonScale-dependent results can be misleading
Sensitive to outliers
Related Functions
Functions commonly used alongside or as alternatives to WINDOW_COVAR():
WINDOW_CORR()WINDOW_STDEV()WINDOW_VAR()WINDOW_AVG()CORR()(database-level, if supported)RUNNING_AVG()
We’ve got plenty of resources to help you master Tableau functions. For more details, check out the official Tableau documentation. Or, if you’re ready for more practice, let’s dive into related functions and build your Tableau skills further!
If you’re ready to harness the full power of Tableau and elevate your data analytics capabilities, our expert Tableau consulting services are here to guide you. Whether you need support with building advanced calculated fields, creating dynamic visual dashboards, or optimizing your data sources for peak performance, our team of experienced Tableau consultants delivers customized solutions designed for your business needs. Visit our Tableau Consulting page to discover how we can help your organization turn data into impactful, insight-driven decisions.
It calculates the covariance between two measures within a defined window.
WINDOW_COVAR() measures raw covariance, while WINDOW_CORR() standardizes the result between -1 and 1.
Yes, sorting determines row order within the window.
Yes, by specifying start and end offsets.
No, it measures linear co-movement only.
Working with Tableau — or thinking about Power BI?
We work both sides. Tableau-certified for production work and complex calcs, and we've shipped 12+ Tableau-to-Power BI migrations with 100% parity testing and 30–60% license savings.
Tableau-certified12+ migrations100% parity
