When to Move From Excel to a BI Tool for Financial Reporting
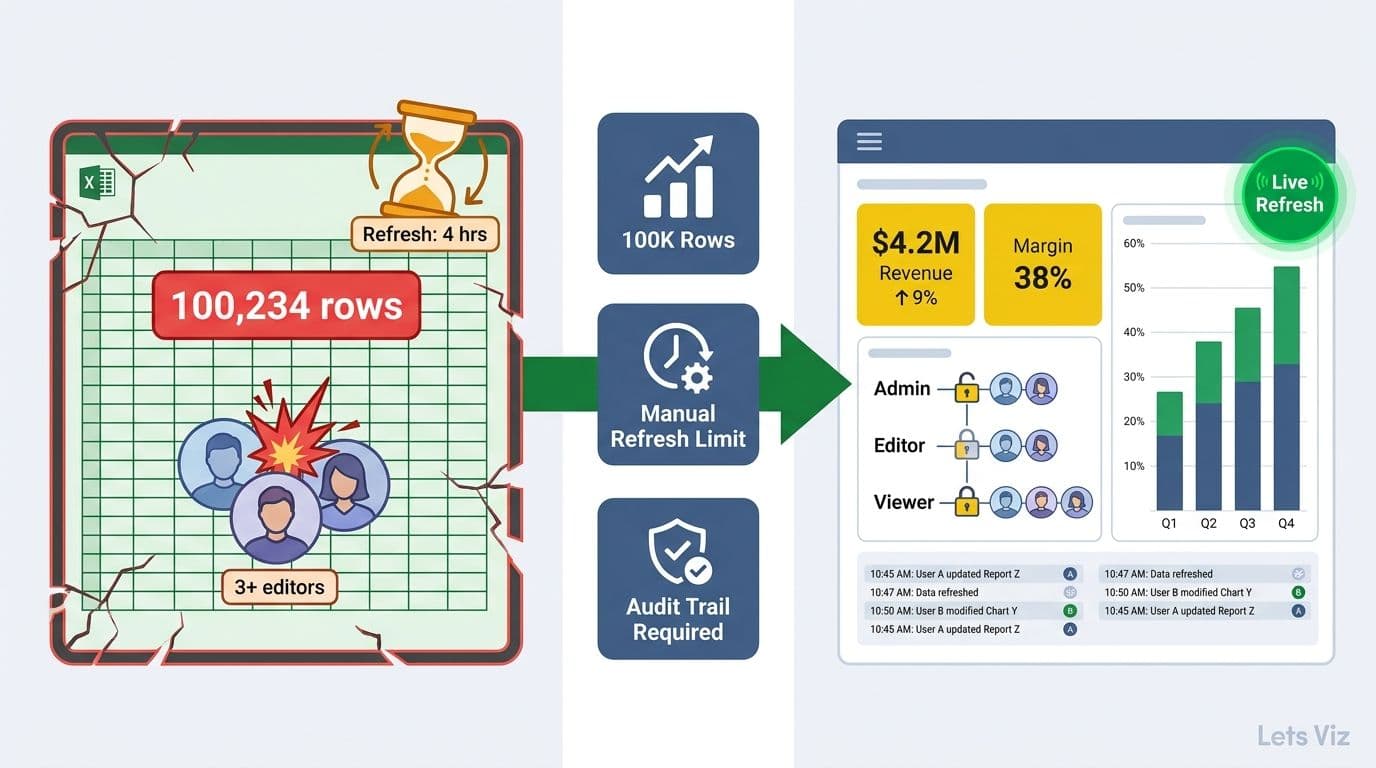
Move from Excel to a BI tool for financial reporting when you cross any one of three measurable thresholds: your source data exceeds roughly 100,000 rows and analysis slows noticeably, your team needs refresh cycles shorter than it can sustain manually, or more than three stakeholders need concurrent access to consistent numbers. In regulated industries such as healthcare and financial services, compliance requirements for audit trails and role-based access control typically push this decision earlier - before any of the three technical thresholds are reached.
Key Takeaways
Data volume: Row counts above 100,000 rows or connections to three or more source systems push Excel to its performance ceiling
Refresh cadence: Any reporting requirement faster than a sustainable weekly manual cycle is a BI tool use case
Collaboration scale: Three or more concurrent stakeholders with different access levels require a BI platform's permission model
Regulated industries: Healthcare and financial services organisations face compliance pressure that makes the move from Excel to a BI tool non-negotiable at scale
Transition model: Run both tools in parallel for 90 to 120 days - the BI platform owns reporting and distribution, Excel retains ad hoc modelling
What Are the Signs Your Excel-Based Financial Reports Are Failing?
The earliest signal is time allocation: when a finance analyst spends more than 30% of the working week on data preparation and distribution rather than analysis, the tooling is misaligned with the job. Version conflicts, broken formula chains on large files, and manual copy-paste steps between systems are not workflow problems - they are architecture problems.
Excel was designed for ad hoc analysis and scenario modelling. It was not designed to serve as the distribution layer for operational reporting. When a single financial report requires pulling from multiple source systems, running on a fixed schedule, and reaching a stakeholder list with differing access levels, you have a reporting pipeline - and pipelines need purpose-built infrastructure.
Knowing which metrics belong in that pipeline matters before selecting the tooling. What Metrics Should a Financial Reporting Dashboard Include? covers the scope of KPIs that structured dashboards handle well and Excel handles poorly at scale - from operating cash flow to department-level variance analysis.
According to Market Research Future (2026), the Healthcare Financial Analytics Market is projected to grow at an 8.58% CAGR through 2035, driven by the growing gap between what legacy and EMR-native reporting delivers and what finance leaders need. This acceleration reflects broad recognition that spreadsheet-centric financial reporting cannot keep pace with the complexity of modern financial operations.
How Does Data Volume Set the Excel-to-BI Threshold?
The practical data volume threshold is approximately 100,000 to 500,000 rows, depending on calculation complexity and the hardware running the file. Beyond this range, pivot table refreshes slow to minutes, lookup chains become brittle under any schema change, and live database connections time out under concurrent use.
For healthcare finance teams tracking hospital CFO dashboard metrics across multiple cost centres, service lines, and payer categories, this threshold arrives sooner than most anticipate. A single month of itemised billing data at a mid-sized hospital can exceed 200,000 rows before any enrichment with general ledger or payroll data.
The volume concern is not row count alone - it is source system complexity. A finance team joining general ledger data, payroll actuals, and capital expenditure from three separate systems inside a single Excel file is maintaining three fragile connections. A BI platform handles this at the semantic model layer, refreshing all sources on a single governed schedule and maintaining defined relationships that survive upstream schema changes.
| Data Scale | Recommended Approach | Rationale |
|---|---|---|
| Under 50,000 rows, single source | Excel | Sufficient performance for ad hoc analysis |
| 50,000 to 500,000 rows, one or two sources | Excel with Power Query | Manageable with disciplined file governance |
| Over 500,000 rows or three or more sources | BI tool | Performance and maintainability require it |
| Any volume with daily or live refresh needed | BI tool | Excel cannot schedule automated refreshes reliably |
| Regulated industry with audit trail mandate | BI tool regardless of volume | Compliance requirements outweigh size considerations |
5 Key Financial KPIs Every CFO Should Track illustrates how quickly KPI complexity scales once finance teams combine operational and financial data sources - a combination that tests even Power Query-connected Excel models.
What Refresh Cadence Justifies Moving to a BI Tool?
Any reporting requirement shorter than a sustainable weekly manual refresh cycle is effectively a BI tool use case. Daily P&L tracking, real-time cash position monitoring, and intraday operational dashboards are architecturally incompatible with manual spreadsheet processes. A finance analyst at a £55,000 annual salary spending four hours each working day on manual data pulls, paste operations, and distribution emails allocates roughly £27,500 per year to a task that a scheduled BI refresh completes without human intervention — not counting the error-correction cycles that follow each manual step. That labour cost alone typically exceeds the annual licensing cost of a mid-market BI platform within the first two months of operation.
Refresh cadence also governs data quality risk. When analysts manually pull and paste data, errors compound across cycles. In regulated industries - healthcare finance, banking, and insurance - a single incorrect figure in a widely distributed report can trigger compliance reviews or inform flawed operational decisions.
How healthcare finance teams use AI analytics to automate data pipelines illustrates why automation at the refresh layer is increasingly treated as a compliance requirement rather than a convenience. MedInsight's 2026 healthcare analytics review identified AI-driven automation, real-time cost visibility, and predictive variance analysis as the three dominant themes reshaping how health systems manage financial data infrastructure - with automated refresh pipelines underpinning all three.
For healthcare organisations, the contrast between a healthcare analytics dashboard and EMR reporting tools is sharpest at this question. EMR-native reports run on fixed schedules with fixed schemas designed for clinical operations. A BI platform can pull from the EMR's data warehouse and combine it with financial and operational data on a user-defined refresh schedule - giving hospital CFOs the near-real-time view their decisions require.
How to Build a Power BI Financial Dashboard for Healthcare details the data pipeline architecture that bridges EMR data and financial systems without the fragility of manual Excel processes.
How Many Collaborators Tip the Decision Toward BI?
The collaboration threshold is approximately three to five concurrent stakeholders with different data access requirements. Below this count, a well-governed shared Excel file with disciplined version management is workable. Above it, coordination costs - resolving version conflicts, managing edit rights, ensuring every stakeholder views the same refreshed numbers - consume more analyst time than the reporting itself produces value.
The argument sharpens when stakeholders hold different permission levels. A CFO, a department head, and an external auditor should not access the same raw Excel file. A BI platform enforces row-level security: each user sees only the data their role permits, on a shared, always-current view of the same underlying dataset. In practice, this means a department head in Power BI sees only their cost centre's actuals and variance lines, while the CFO sees the consolidated entity view — both pulling from a single published semantic model refreshed on the same overnight schedule, with no version reconciliation required.
In healthcare, multi-stakeholder access control is not optional. Regulatory frameworks require that access to financial and patient-adjacent data be logged, auditable, and role-appropriate. Healthcare KPI dashboard examples for hospital finance teams consistently include data that different roles should see at different granularity - an operating room director needs service-line cost detail that a board member does not.
The AI analytics consulting vs in-house data team question often surfaces at this stage. Mid-market organisations that lack dedicated data engineering capacity find that the governance model of a managed BI platform - built-in access controls, audit logs, and refresh automation - closes the compliance gap faster than attempting to replicate those controls through manual Excel processes.
Excel vs BI Tools for Financial Reporting: A Direct Comparison
The decision is not binary. Excel remains the right tool for scenario modelling, ad hoc analysis, and working with small, self-contained datasets. The question is whether it should own your reporting distribution layer - the layer that serves consistent, governed numbers to a diverse stakeholder set on a repeatable schedule.
| Capability | Excel | BI Tool |
|---|---|---|
| Data volume | Up to ~500K rows reliably | Millions of rows via columnar storage |
| Refresh automation | Manual or semi-manual | Fully scheduled, sub-hourly intervals possible |
| Multi-source joins | Fragile via Power Query | Native at the semantic model layer |
| Role-based access | File-level permissions only | Row-level security with user-level controls |
| Audit trail | None natively | Full access and activity logging |
| Concurrent collaboration | Version conflicts above 3 users | Single source of truth for all users |
| Ad hoc analysis | Excellent | Limited - best handled in a connected Excel workbook |
| Compliance readiness | Requires manual controls | Built-in governance across most platforms |
| Total cost of ownership | Low upfront, high ongoing labour cost | Higher upfront, lower ongoing labour cost |
The pattern most mature finance teams reach: BI tools own reporting and distribution; Excel stays active for modelling, budgeting, and one-off analysis. This is a division of responsibilities, not an elimination of Excel from the finance toolkit.
Before committing to a specific BI platform in a regulated environment, governance due diligence matters. A CFO's 6-question AI risk checklist for Power BI covers the access, audit, and AI feature questions to resolve before going live in healthcare or financial services settings.
When to Move From Excel to a BI Tool in Regulated Industries
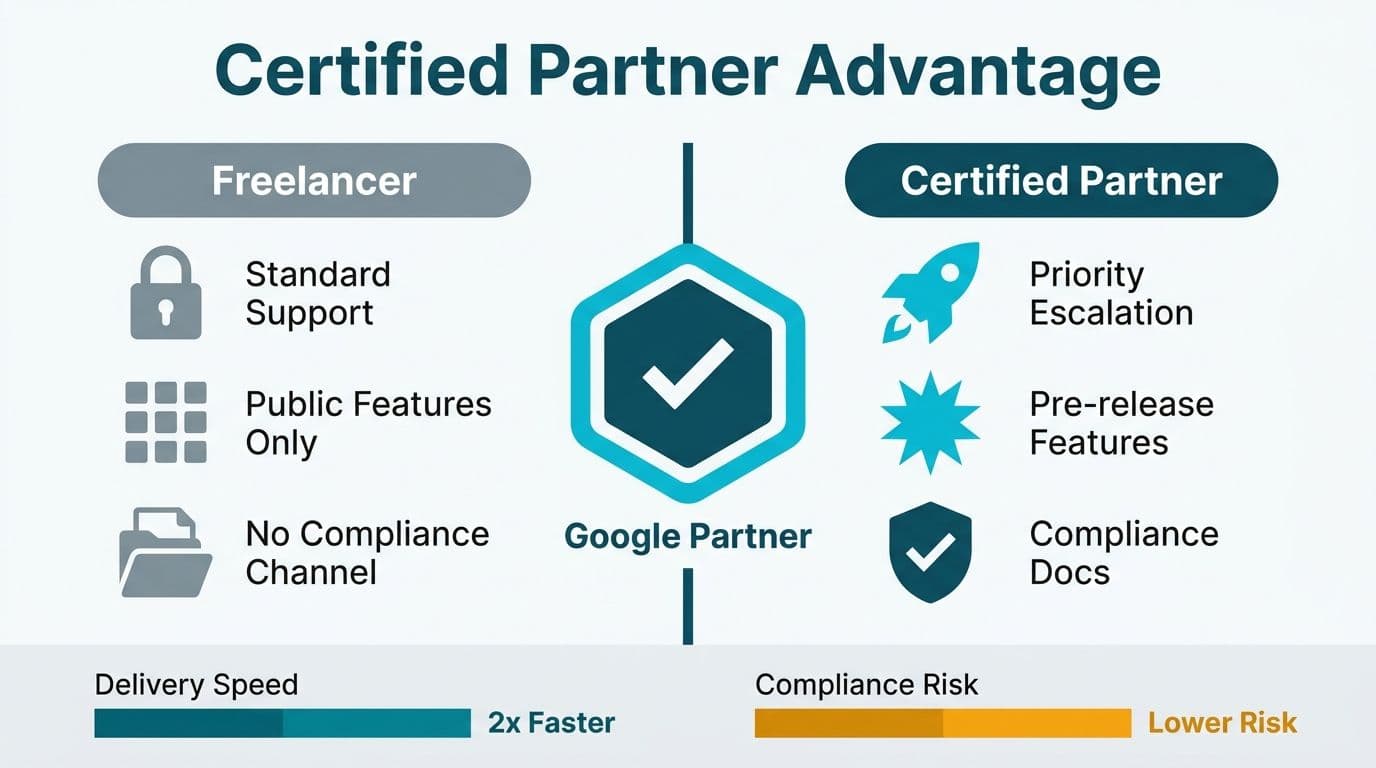
In regulated industries, the three standard thresholds are joined by a fourth: compliance architecture. Healthcare, banking, insurance, and government finance teams operate under frameworks — HIPAA, SOX, GDPR, FCA — that require documented data lineage, enforced access controls, and persistent audit trails. Excel provides none of these natively, and retrofitting them through file permissions and manual process controls is both fragile and expensive to sustain. A SOX-compliant finance team, for example, must demonstrate that reported figures trace back to source data through an unbroken, logged chain — a requirement that eliminates unenriched Excel files from the distribution layer entirely. As of 2026, enterprise BI platforms including Power BI, Tableau, and Looker carry SOC 2 Type II and ISO 27001 certifications that auditors routinely accept as evidence of data governance controls — a credential pathway that simply does not exist for Excel-based reporting workflows.
For healthcare finance specifically, the case is structurally clear. Healthcare KPI dashboard examples by department consistently show that the most useful CFO-level dashboards pull from at least three systems: the EMR data warehouse, the general ledger, and the labour management system. No Excel model connects these sources reliably at enterprise scale without a dedicated engineer maintaining each connection individually.
The AI analytics consulting for finance reporting market is growing precisely because this infrastructure gap is now widely recognised. According to Future Market Insights (2026), the AI consulting services market is projected to grow from USD 14.0 billion in 2026 to approximately USD 91 billion by 2035 at a 26.2% CAGR - growth driven in large part by organisations replacing manual and spreadsheet-based reporting with governed, automated BI platforms.
The healthcare analytics dashboard vs EMR reporting tools debate reflects the same underlying dynamic. EMR tools report on clinical operations; they do not join cleanly with financial systems, payroll data, or capital expenditure tracking. Purpose-built financial BI dashboards close this gap, providing healthcare CFOs with a unified financial performance view that neither EMR reporting nor Excel can sustain at scale.
AI Services and Consulting for Finance and Healthcare Leaders provides a framework for evaluating when external AI analytics consulting for finance reporting accelerates the BI migration - and when building in-house capacity is the right call.
What Does an Excel-to-BI Migration Look Like in Practice?
Successful migrations follow a parallel-run model: the BI platform goes live for reporting while Excel continues for analysis, with a 90-to-120-day overlap period. Attempting a hard cutover - switching off Excel reports while the BI platform is still being validated - is the most common cause of migration failure in finance teams.
The practical sequence:
1. Audit existing Excel reports. Identify which files serve as reporting and distribution outputs versus analysis and modelling inputs. Only the former are BI migration candidates.
2. Map your data sources. Document every system feeding your Excel reports: the refresh frequency required, the schema changes each source is subject to, and the access permissions each output needs. This mapping becomes the foundation of your BI semantic model.
3. Build the semantic model before the dashboards. Establishing defined relationships, calculated measures, and access rules at the model layer - before building any dashboards - is what makes subsequent reports consistent and maintainable. Teams that skip this step and build dashboards directly on raw query outputs typically discover the problem at month three, when two dashboards return different revenue totals for the same period because each query applies a different date filter convention. Fixing that inconsistency after stakeholders have already relied on the numbers is far more disruptive than building the model correctly at the start.
4. Parallel-run for 90 days. Publish both BI and Excel versions of key reports through one full reporting quarter. Use any discrepancies as data quality investigations - they reveal the hidden logic embedded in the Excel model that needs to be made explicit in the BI semantic layer.
5. Retire the Excel report, preserve the Excel skill. Once stakeholders trust the BI output, stop distributing the Excel version. Keep Excel available for the modelling and scenario analysis it handles well, and use your BI platform's connected workbook feature to give analysts a live-data-connected Excel environment for ad hoc work.
The 90-day overlap is not delay - it is the period during which your BI reports earn the confidence of the people who stake operational and financial decisions on them. Finance leaders and hospital CFOs are not early adopters; they need to see the numbers match before they rely on a new system.
---
If your financial reporting workflow has crossed any of these thresholds - data volume, refresh cadence, collaboration scale, or compliance requirements - Managed Power BI services from Lets Viz provide a structured path from spreadsheet-based reporting to a governed, automated BI platform, with end-to-end support across data model architecture, dashboard build, and stakeholder rollout.
---
About Lets Viz: Lets Viz is an analytics consulting firm with over a decade of experience building financial reporting infrastructure for mid-market and enterprise clients across healthcare, financial services, and professional services. Our team has delivered Power BI reporting platforms for regulated-industry finance teams in the UK, US, and India, combining technical implementation depth with the change management discipline that makes migrations stick.