Power BI Fiscal Year Date Table for US, UK and Canada
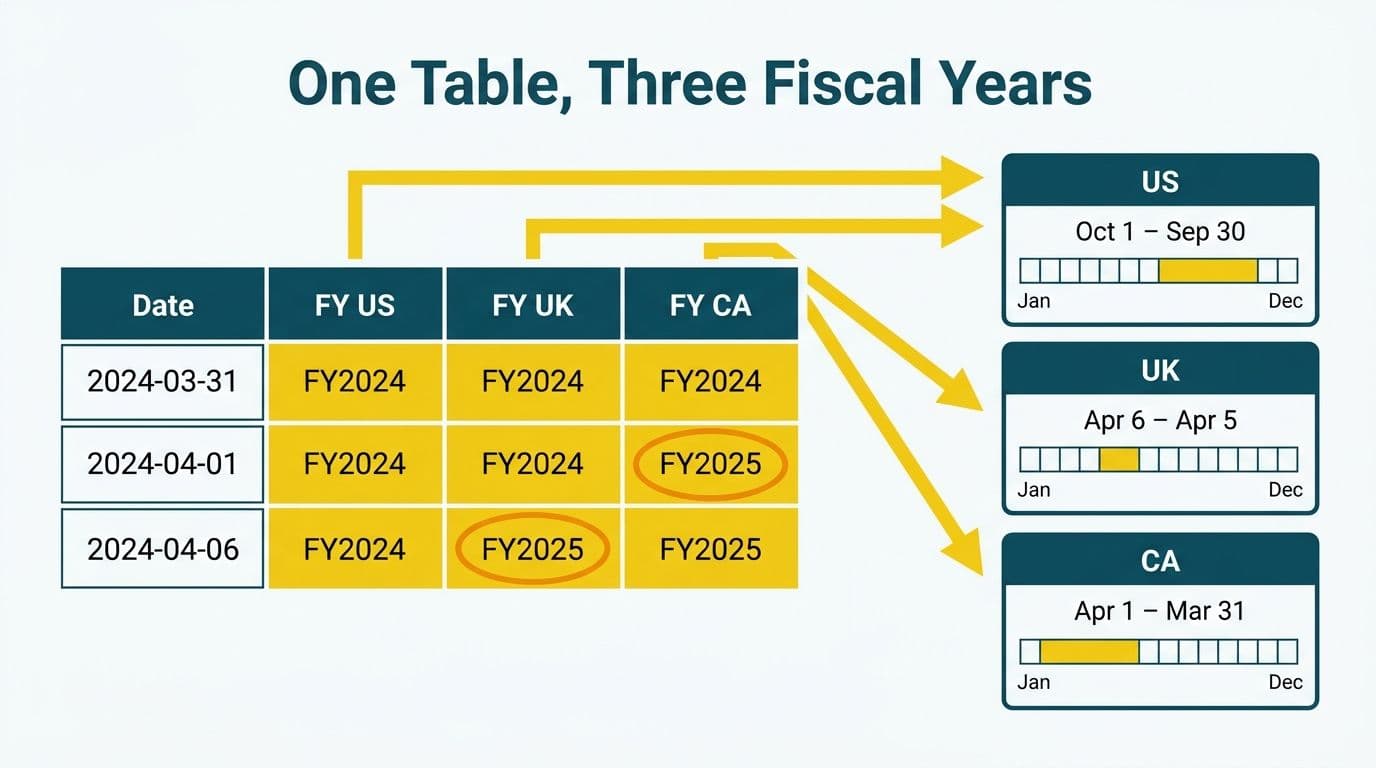
A single Power BI date table can serve US, UK, and Canadian entities simultaneously - provided it carries a dedicated fiscal year column for each jurisdiction. The key is computing fiscal membership per row in Power Query using each entity's specific year-end date, then writing DAX measures that reference those columns rather than the calendar year. Built correctly, one shared model delivers accurate YTD, prior-year, and rolling-period figures for every entity without duplicating tables.
Key Takeaways
- A reusable multi-fiscal-year date table stores one row per calendar day with separate fiscal year label columns for each jurisdiction (US Jan 31, UK Apr 6, Canada Oct 31).
- Power Query M is the right layer for computing fiscal year labels; DAX measures then consume those columns for CALCULATE-based time intelligence.
- Use `TOTALYTD` with a custom year-end date string, or write `CALCULATE` with `DATESYTD`, for full control over period boundaries.
- Parameterize fiscal start dates in a configuration table so adding a fourth entity later requires no changes to the M query logic itself.
- Apply row-level security on fact tables - not on the date table - to satisfy GDPR (UK/EU), PIPEDA (Canada), and SOC 2 (US) data segregation requirements.
What Is a Fiscal Year Date Table in Power BI?
A fiscal year date table - also called a time dimension or calendar dimension - is a single-row-per-day table that all fact tables join on their date key. Beyond standard attributes such as year, quarter, month, and week, a fiscal date table adds fiscal year labels, fiscal quarter numbers, and fiscal period offsets computed relative to each entity's year-end date rather than December 31.
For Power BI for SaaS finance teams, a shared date dimension is not optional. SaaS companies operating across multiple geographies each carry a different statutory or management reporting calendar. A UK fintech subsidiary may close books on April 5 (the day before the UK personal tax year starts on April 6). A Canadian holding company may end its year on October 31. A US retail entity may follow the NRF 4-5-4 calendar ending January 31. Without a single authoritative date dimension, those three entities will never produce comparable period-over-period figures in the same report.
The table must be marked as a Date Table in Power BI Desktop (Table tools > Mark as date table) using the Date column as the unique key. This step unlocks built-in time-intelligence DAX functions; without it, functions like `TOTALYTD` and `SAMEPERIODLASTYEAR` generate their own implicit date tables and silently diverge from your custom fiscal columns.
How Do Fiscal Year-End Dates Differ Across US, UK, and Canada?
Each jurisdiction follows a different default, and individual companies often deviate further for operational or historical reasons. This table shows what a multi-entity CFO dashboard must resolve before a single measure can be written:
| Entity | Fiscal Year-End | Fiscal Year Starts | Label Convention | Notes |
|---|---|---|---|---|
| US Retail (NRF 4-5-4) | January 31 | February 1 | FY2026 | Aligns with post-holiday inventory close |
| UK Tax Year | April 5 | April 6 | FY2025/26 | Straddles two calendar years |
| Canada (example) | October 31 | November 1 | FY2026 | Common in agribusiness and financial services |
| Calendar Year | December 31 | January 1 | FY2026 | Power BI default assumption |
The UK convention is the most complex because the fiscal year straddles two calendar years and is typically labelled with a slash notation (2025/26). Your Power Query formula must test both the month and the day of month to determine which side of April 6 a date falls on - a simple month threshold is not sufficient and will produce silent off-by-one errors on April 6 itself.
How Do You Build a Power BI Fiscal Year Date Table for US, UK, and Canada?
The recommended approach is to build the entire date table in Power Query (M), so it recalculates on each model refresh and fiscal configuration can be updated without touching the data model.
Step 1 - Create a Fiscal Configuration Table
Add a Power Query table called `FiscalConfig` that stores each entity's key and its fiscal year-start month and day:
```
EntityKey | FY_StartMonth | FY_StartDay | LabelStyle
US_RETAIL | 2 | 1 | single
UK_ENTITY | 4 | 6 | slash
CA_ENTITY | 11 | 1 | single
```
Loading this from a SharePoint list or a Microsoft Fabric Lakehouse table means finance operations can update fiscal calendars without opening Power BI Desktop. When a new subsidiary is onboarded, the change is a single row addition rather than a query rewrite.
Step 2 - Generate the Date Spine
Create a query called `DimDate` that generates every calendar day between the earliest transaction date and a rolling two-year horizon:
```m
let
StartDate = #date(2020, 1, 1),
EndDate = Date.AddYears(Date.From(DateTime.LocalNow()), 2),
DateList = List.Dates(StartDate,
Duration.Days(EndDate - StartDate) + 1,
#duration(1, 0, 0, 0)),
DateTable = Table.FromList(DateList,
Splitter.SplitByNothing(), {"Date"}),
Typed = Table.TransformColumnTypes(DateTable,
{{"Date", type date}})
in
Typed
```
Step 3 - Add Per-Entity Fiscal Year Columns
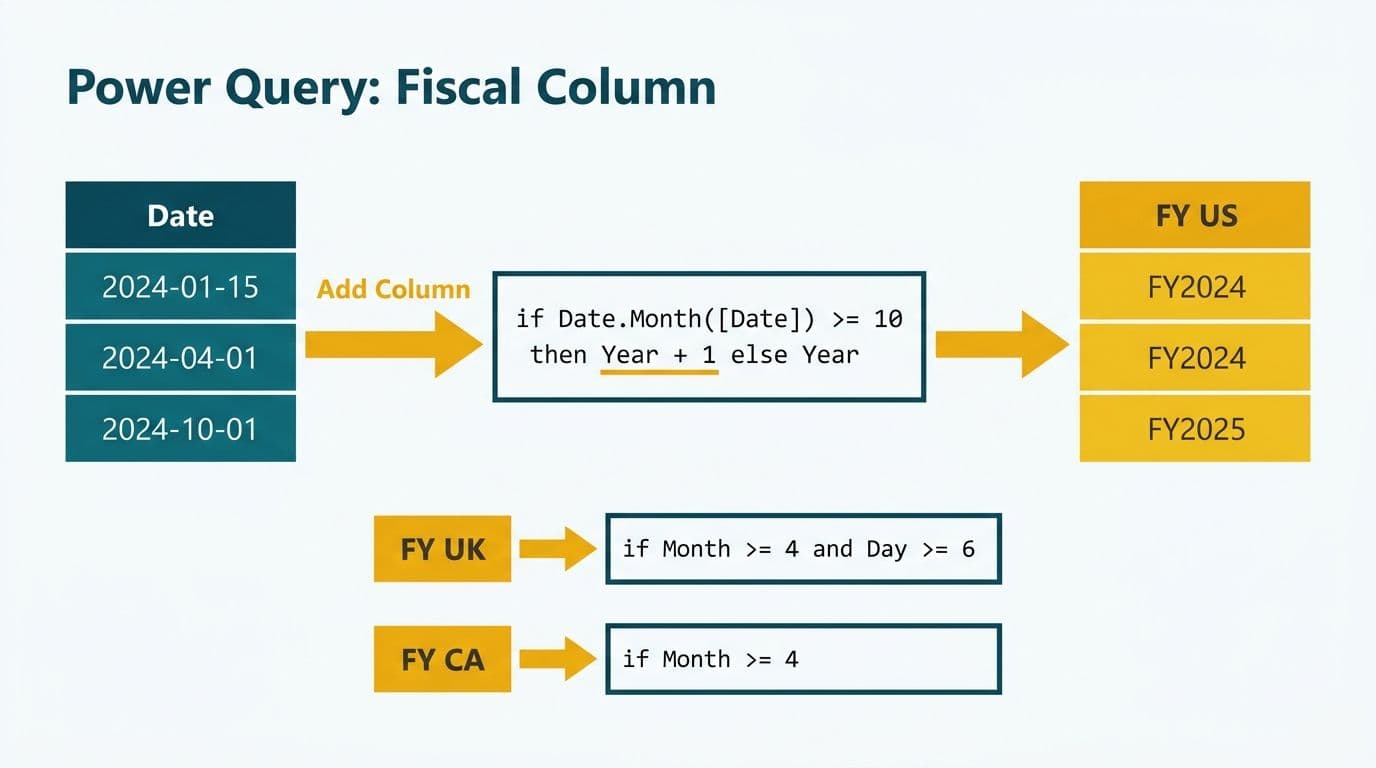
Append a computed column for each entity. The US retail and Canada cases use a month-threshold test. The UK case must also test the day of month:
```m
// US Retail: year starts Feb 1, ends Jan 31
AddFY_US = Table.AddColumn(Typed, "FY_US", each
let yr = Date.Year([Date]), mo = Date.Month([Date])
in if mo >= 2
then "FY" & Text.From(yr + 1)
else "FY" & Text.From(yr), type text),
// UK: year starts Apr 6, label uses slash notation
AddFY_UK = Table.AddColumn(AddFY_US, "FY_UK", each
let
yr = Date.Year([Date]),
mo = Date.Month([Date]),
dy = Date.Day([Date]),
after = (mo > 4) or (mo = 4 and dy >= 6)
in
if after
then "FY" & Text.From(yr) & "/" & Text.From(yr + 1)
else "FY" & Text.From(yr - 1) & "/" & Text.From(yr),
type text),
// Canada: year starts Nov 1, ends Oct 31
AddFY_CA = Table.AddColumn(AddFY_UK, "FY_CA", each
let yr = Date.Year([Date]), mo = Date.Month([Date])
in if mo >= 11
then "FY" & Text.From(yr + 1)
else "FY" & Text.From(yr), type text)
```
After the fiscal year columns, add fiscal quarter and fiscal month number columns using the same offset arithmetic. A US retail FQ1 spans February through April; a UK FQ1 spans April 6 through July 5. These columns drive the quarter-on-quarter slicers in the report layer and are required for any period-over-period measure that needs to compare quarters rather than full years.
Step 4 - Mark the Table and Build Relationships
Mark `DimDate` as the date table in Desktop, then create a single active relationship from `DimDate[Date]` to the date column in each fact table. Use inactive relationships if a fact table carries multiple date columns (transaction date, invoice date, payment date) and activate the correct one per measure using `USERELATIONSHIP`.
How Do You Write Fiscal YTD and Period-Over-Period DAX Measures?
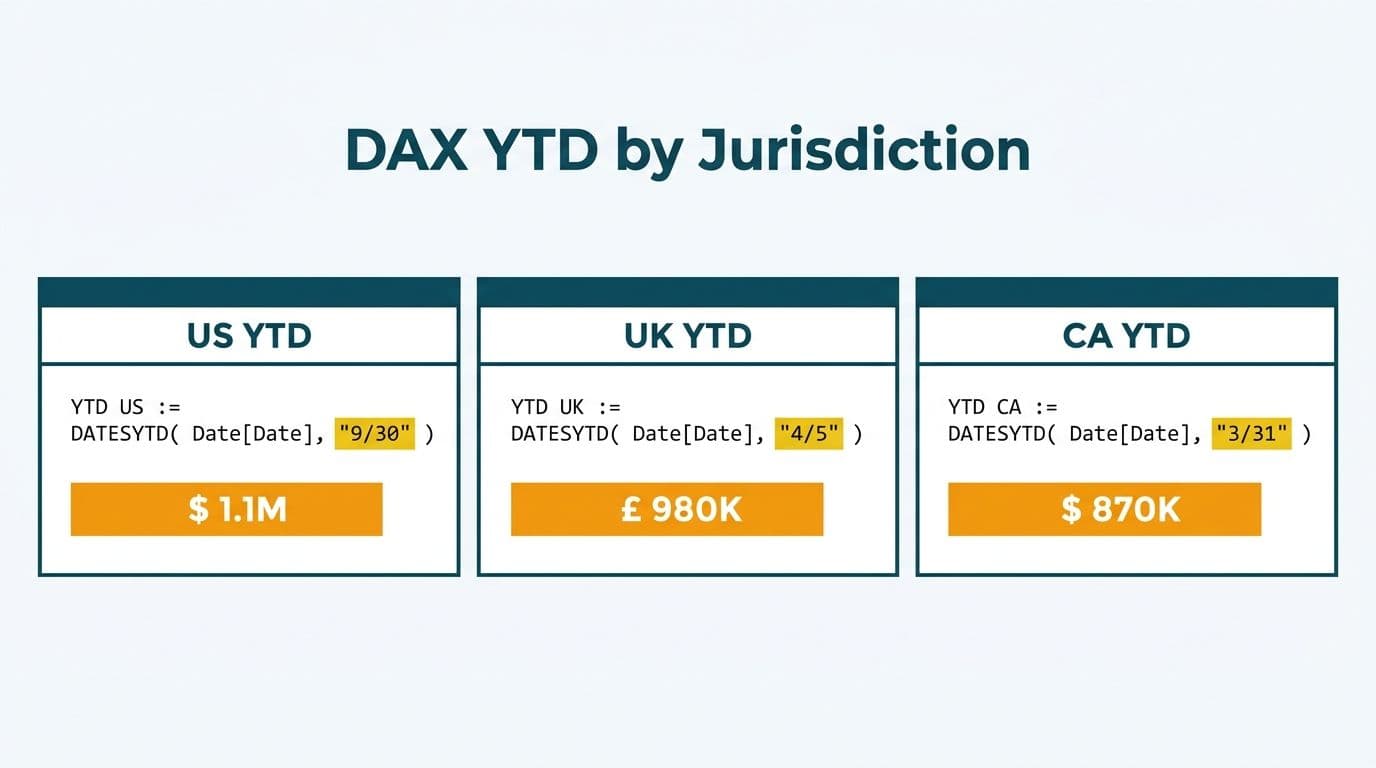
With fiscal year columns in place, DAX time intelligence becomes clean and explicit. `TOTALYTD` accepts a custom year-end date string as its third argument:
```dax
// US Retail YTD Revenue (year ends January 31)
Revenue YTD US =
TOTALYTD([Total Revenue], DimDate[Date], "01-31")
// Canada YTD Revenue (year ends October 31)
Revenue YTD CA =
TOTALYTD([Total Revenue], DimDate[Date], "10-31")
```
For the UK entity, where the year-end is April 5, use `CALCULATE` with `DATESYTD` for explicit control:
```dax
Revenue YTD UK =
CALCULATE(
[Total Revenue],
DATESYTD(DimDate[Date], "04-05")
)
```
Period-Over-Period Comparisons
Use `DATEADD` for explicit prior-year offsets and wrap comparisons in `DIVIDE` to avoid division-by-zero errors at year boundaries:
```dax
Revenue Prior Year US =
CALCULATE([Total Revenue], DATEADD(DimDate[Date], -1, YEAR))
Revenue YoY % US =
DIVIDE(
[Revenue YTD US] - [Revenue Prior Year US],
[Revenue Prior Year US]
)
```
For UK entities where the fiscal year straddles two calendar years, rolling 12-month totals produce more stable comparisons than `SAMEPERIODLASTYEAR`, which can return unexpected results when the report filter context sits near the April 6 boundary:
```dax
Revenue R12M UK =
CALCULATE(
[Total Revenue],
DATESINPERIOD(DimDate[Date], LASTDATE(DimDate[Date]), -12, MONTH)
)
```
What Causes Silent Errors in Multi-Entity Fiscal Year Reporting?
Date window mismatches are the most common source of P&L discrepancies in multi-entity Power BI models - and they return a number rather than an error, which is exactly what makes them dangerous.
We worked with an events production company where two reports kept showing different revenue totals for the same period. After reconciling all the underlying data, the grand totals matched exactly - the only real difference was 34 filler rows that fell into different date windows because each report used slightly different period boundaries. The dispute was never about the data.
Power BI models face the same risk. The most common triggers are:
- Measure uses `YEAR(DimDate[Date])` instead of `DimDate[FY_US]`: silently ignores the fiscal offset and produces a calendar-year total that looks plausible but is off by one or two months at year boundaries.
- Date table not marked: Power BI creates an auto-generated calendar table that uses a different year boundary, causing `TOTALYTD` to return different numbers than measures referencing your custom fiscal column.
- Off-by-one on April 6: if the UK fiscal year test uses `dy > 6` instead of `dy >= 6`, every transaction on April 6 is assigned to the prior fiscal year, overstating the prior year and understating the current year by one day's revenue across all UK entities.
The remediation is a structured Power BI governance checklist that validates date table marking, enforces fiscal column usage across all time-intelligence measures, and includes a regression test comparing total-year actuals against the prior-month report before any model refresh reaches production.
When Should You Parameterize Vs Hardcode Fiscal Year Start Dates?
Parameterize whenever the number of entities or their fiscal calendars could change. Hardcoding is acceptable only in a single-entity model where the year-end is fixed by statute and no future acquisitions are planned.
For a multi-entity model serving a CFO or FP&A team, the right pattern is:
1. Store fiscal configuration in a reference table - a Power Query parameter, a SharePoint list, or a Microsoft Fabric warehouse table.
2. In Power Query, load the configuration table first and extract each entity's start month and day as named variables before building the date spine.
3. When a new subsidiary is onboarded - for example, a German GmbH with a December 31 year-end operating under GDPR data residency obligations - finance operations updates the configuration table and the date spine recalculates on the next refresh without any changes to the Power BI model.
4. Add an effective-date column to the configuration table to support fiscal calendar changes. If a Canadian subsidiary shifts its year-end after receiving regulatory approval under PIPEDA requirements, historical fiscal labels are preserved by filtering the configuration by effective date at refresh time.
A typical mid-market FP&A team onboards one to three new entities per year through acquisition or restructuring. With the parameterized approach, each addition is a one-row update to the configuration table rather than a query rewrite, and the change is fully auditable in version control.
How Does Compliance Shape Multi-Entity Date Table Design?
The date table itself carries no personally identifiable information, so it does not trigger GDPR, PIPEDA, or HIPAA requirements directly. Compliance enters through the fact tables the date table joins and through the row-level security that governs which users can query which entity's data.
For a shared multi-entity Power BI model:
- US SaaS and finance teams: SOC 2 Type II controls commonly require that individual contributors cannot query another business unit's P&L. Enforce this in Power BI RLS by mapping each user's UPN to their authorized entity key and filtering fact tables accordingly. The date dimension passes through unfiltered.
- UK and EU operations: GDPR applies to personal data in fact or dimension tables (employee-level headcount, customer-level ARR disaggregated to identifiable individuals). Any time-intelligence measure aggregating data at a level that could identify an individual must be reviewed against the relevant data processing agreement. The date table itself is out of scope.
- Canadian entities: PIPEDA requires disclosure of cross-border data transfers. If the Power BI dataset is hosted in a US Azure region and serves Canadian users, document the transfer in the data processing agreement. Power BI Premium Per User and Microsoft Fabric capacities support region-specific data residency if a Canadian-hosted workspace is required.
For teams building financial dashboards that span Power BI for accounting and finance firms use cases - consolidation reporting, intercompany elimination, and multi-GAAP presentations - the compliance layer is inseparable from the data model design. A well-structured date dimension actually simplifies audit trails: because fiscal period labels are computed centrally in a single version-controlled M query, every reported figure anchors to the same date logic. Regulators and external auditors can trace any variance to a single source without hunting through multiple dataset versions.
For teams that need this capability maintained and monitored on an ongoing basis, our Power BI managed service for finance teams covers the operational layer above the date table: workspace governance, dataset certification, scheduled validation tests, and the runbook documentation that keeps multi-entity models trustworthy across reporting cycles.
---
About Lets Viz: Lets Viz has delivered financial reporting solutions for US healthcare organizations, UK fintech firms, Canadian manufacturing companies, and global SaaS businesses since 2020. Our engineers have designed and implemented multi-entity Power BI models with custom fiscal calendars in environments where audit-grade accuracy is non-negotiable. Lets Viz holds a 5.0 rating on Clutch.
If your finance team needs a production-ready multi-fiscal-year date table or a full time-intelligence layer for multi-entity reporting, explore Power BI for SaaS finance teams to see how we approach the design.