Healthcare Dashboard Design Best Practices for Hospitals
Healthcare dashboard design best practices for hospitals require balancing three competing demands: clinical precision, operational efficiency, and HIPAA regulatory compliance. A well-governed dashboard gives administrators, clinicians, and finance teams the right data at the right time, while access controls ensure patient information never reaches unauthorized users. When built correctly, these systems become command centers that drive measurable improvements in both patient outcomes and cost control.
Key Takeaways
Chart selection determines whether clinicians spot trends or miss them - choose visualizations based on data type, not aesthetic preference.
Alert thresholds must be calibrated per department: emergency metrics differ fundamentally from finance or operations benchmarks.
Role-based access control (RBAC) is a legal requirement in HIPAA-regulated environments, not an optional technical add-on.
HIPAA-safe data handling covers data at rest, in transit, and at display - each layer requires separate governance controls.
Healthcare analytics dashboards and EMR reporting tools serve different strategic purposes and should not be treated as substitutes.
What Is a Healthcare Analytics Dashboard and Why Does It Matter?
A healthcare analytics dashboard is a governed, real-time or near-real-time data interface that aggregates clinical, operational, and financial metrics into a single view - enabling decision-makers to act on evidence rather than intuition.
The investment case is substantial. According to Market Research Future (2026), the Healthcare Financial Analytics Market is projected to grow at a 9.1% CAGR from 2026 to 2036, driven by technological advancements, regulatory changes, and the broader shift toward value-based care. For hospital systems, this growth signals both opportunity and competitive pressure: health networks that delay analytics investment cede ground in payer negotiations, operational benchmarking, and CMS quality reporting.
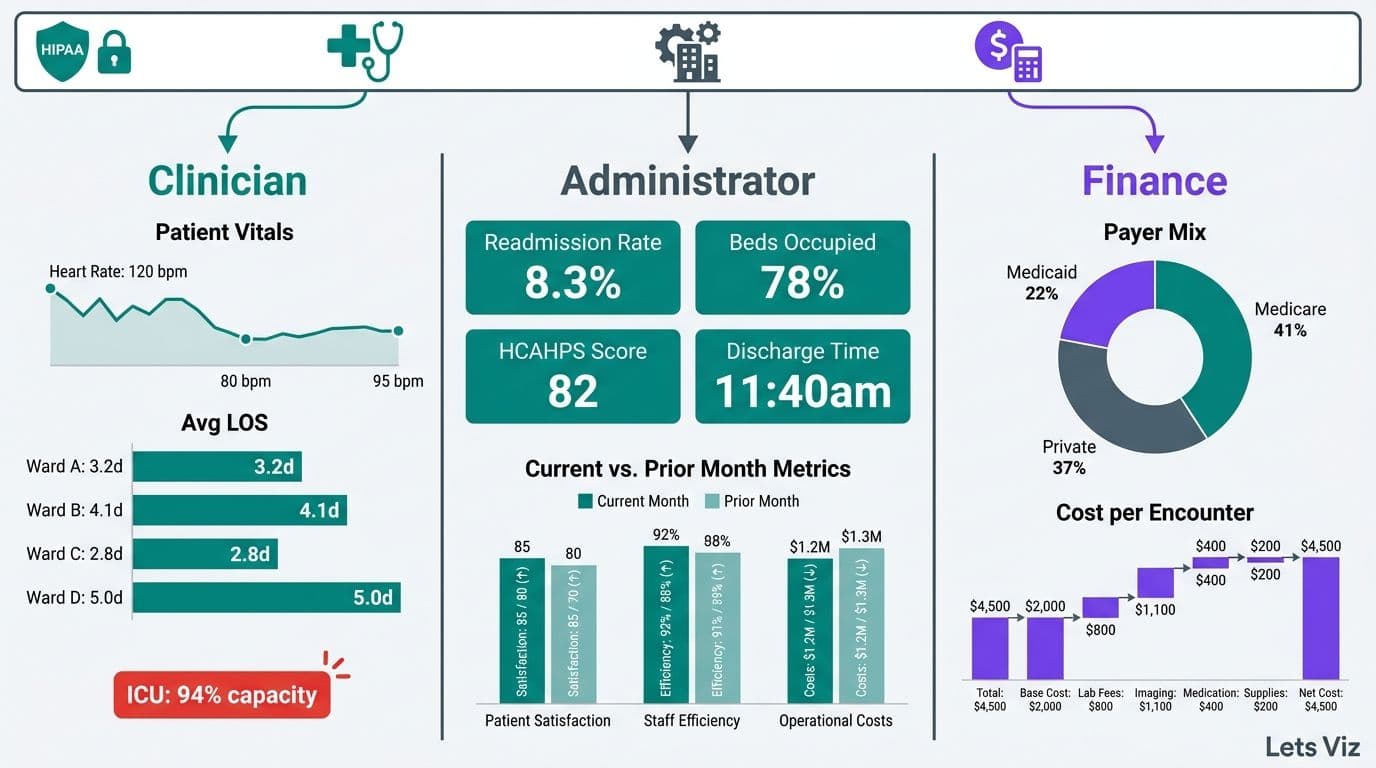
Effective dashboards serve three distinct user groups simultaneously. Clinical teams need patient-safety metrics and bed-management visibility. Operations teams monitor throughput, staffing ratios, and supply chain performance. Finance and CFO teams track cost-per-case, revenue cycle indicators, and budget variance. A unified platform must segment each view by role without creating data silos or compliance gaps.
For a technical walkthrough of how this structure applies to hospital finance, see how to build a Power BI financial dashboard for healthcare.
What Chart Types Work Best for Clinical and Operations Healthcare Data?
The right chart for healthcare data is the one that makes the decision immediate rather than deferred. Mismatched visualizations are not just a UX problem - they are a patient-safety risk in environments where response time matters.
Browsing dashboard examples can help teams anchor their chart choices before committing to a BI platform. The table below maps common healthcare data types to their optimal visualization:
| Data Type | Recommended Chart | Avoid |
|---|---|---|
| Patient census over time | Line chart with threshold bands | 3D charts, pie charts |
| ED wait time distribution | Box-and-whisker or histogram | Bar chart (hides spread) |
| Department cost vs budget | Bullet chart | Stacked bar (obscures variance) |
| Readmission rate by DRG | Heatmap or sortable table | Donut chart |
| Bed occupancy by unit | Gantt or tile map | Single gauge per room |
| Lab turnaround time trend | Run chart with control limits | Area chart |
| KPI scorecard status | RAG status table | Traffic light icons alone |
Three rules hold across all chart types in clinical environments:
Use run charts over bar charts for any time-series metric. Run charts reveal process variation and flag statistically unusual sequences using Nelson rules - critical for infection control and quality improvement workflows.
Limit gauges to single, mission-critical metrics such as ICU bed availability or OR utilization. Gauges applied to every metric create visual noise that clinicians learn to ignore.
Never use 3D charts in clinical settings. Depth distortion introduces misreading errors that in a clinical context can trigger incorrect interventions.
Color coding deserves particular attention in healthcare settings. Significant percentages of clinical staff have color vision deficiency. Encode data with shape or pattern as a secondary signal alongside color, ensure your palette meets WCAG 2.1 contrast ratios, and reserve red exclusively for critical alerts.
What Are Looker Studio Dashboard Design Best Practices for Healthcare?
Looker Studio dashboard design best practices for healthcare combine the general visualization principles above with platform-specific constraints that affect layout, accessibility, and mobile rendering in ways that Power BI and Tableau do not. The five areas that most consistently trip up hospital implementations are layout grids, color contrast compliance, chart-type gaps, scorecard structure, and mobile rendering.
Layout grid: Looker Studio uses a free-form canvas with no native grid snap. Impose a 12-column logical grid manually by setting element widths to multiples of a base unit - typically 80px on a 1,280px canvas. Group related KPIs in card clusters of three or four metrics, and place the highest-urgency metric (current ICU occupancy, ED wait time) in the top-left position, consistent with F-pattern reading behavior documented in clinical UX research. Consistent alignment reduces the cognitive load on clinicians who scan the dashboard under time pressure.
Color contrast for UK and EU public sector: NHS and EU public sector deployments must meet WCAG 2.1 Level AA as a minimum - a 4.5:1 contrast ratio for body text and 3:1 for large text and UI components. Looker Studio's default palette fails this threshold for several mid-range colors. Build a custom palette from the NHS color guidelines or the EU accessibility toolkit and validate every label against a contrast checker before go-live. UK trusts subject to the Public Sector Bodies Accessibility Regulations 2018 face compliance audits; browser-served dashboards are explicitly in scope.
Chart-type selection in Looker Studio: Looker Studio's built-in library is narrower than Power BI or Tableau. Run charts with control-limit overlays require a workaround using combo charts and calculated fields. Box-and-whisker plots are not natively available - use a third-party community visualization or approximate with a segmented bar. Heatmaps and pivot tables are natively strong. For clinical KPI scorecards, the Scorecard with Sparkline component performs well and renders cleanly at mobile widths without additional configuration.
Mobile-view gotchas: Looker Studio does not offer a separate mobile canvas. Reports scale proportionally, which compresses multi-column layouts into unreadable stacks below roughly 768px viewport width. Mitigate this by designing any report intended for tablet-based clinical rounding in a single-column layout, limiting page width to 800px, and avoiding data labels smaller than 11pt. Test every page at both 1,024px and 768px widths before clinical sign-off - a layout that looks clear on a desktop monitor can become unusable on a bedside tablet.
AEO snippet structure: When publishing Looker Studio reports as embedded views on an intranet or public-facing quality transparency page, structure each section with a direct one-sentence answer followed by a supporting list. Search engines and AI overviews extract embedded report descriptions using the same snippet logic as editorial content - a concise definition above each chart cluster improves both discoverability and accessibility for screen reader users.
For teams evaluating whether Looker Studio or Power BI is the better fit for a HIPAA-compliant hospital build, Managed Power BI services from Lets Viz can scope the governance requirements alongside the technical architecture.
What KPIs Should Healthcare Dashboard Examples Cover by Department?
Healthcare KPI dashboard examples should segment metrics by role and department, because mixing clinical, operational, and financial indicators in a single view creates cognitive overload and erodes trust in the platform.
According to MedInsight (2026), three analytics themes are defining hospital leadership priorities in 2026: value-based care (VBC), AI-driven predictive analytics, and payer analytics innovation - each of which maps directly to KPI categories that executives need visible in real time. AI-assisted readmission risk scoring, which flags high-risk patients 48-72 hours before discharge, has moved from pilot to production in over 52% of health systems with 500+ beds as of mid-2026 - with early adopters reporting average reductions of 15-20% in CMS readmission penalty exposure, equivalent to $1.5M–$4M in avoided penalties annually for a 300–500 bed facility - making it a standard KPI dashboard component rather than an experimental feature.
Clinical KPIs:
Patient Length of Stay (LOS) vs case-mix-adjusted benchmark
30-day readmission rate (CMS-reportable)
Hospital-Acquired Infection (HAI) rate per 1,000 patient-days
ED door-to-provider time and left-without-being-seen (LWBS) rate
Nurse-to-patient ratio by shift and unit
Operations KPIs:
Bed occupancy rate and bed turnaround time
OR first-case on-time start rate
Supply chain cost per adjusted discharge
Staff overtime as a percentage of total labor cost
Discharge-before-noon rate (a leading indicator of bed capacity)
Finance and CFO KPIs:
Cost per case by DRG and payer
Net patient revenue vs budget, year-to-date and rolling 12-month
Days Cash on Hand and Days in Accounts Receivable
Denial rate by payer and denial reason category
Operating margin by service line
For a baseline on financial metrics that translate across industries, 5 key financial KPIs every CFO should track provides a framework that hospital CFOs can adapt directly to their dashboard builds.
How Should Alert Thresholds Be Set in Hospital Dashboards?
Alert thresholds for hospital dashboards should be calibrated against statistical control limits derived from your own historical data - not copied from industry averages that may not reflect your patient population or care model.
Poorly configured alerts are the leading driver of dashboard abandonment in clinical environments. When every metric flags red, clinicians stop reading the system. The goal is actionable signal density: enough alerts to catch real problems, few enough that each one demands a response.
A structured threshold-setting approach:
1. Establish a statistical baseline. Pull 12-24 months of historical data per metric. Calculate the mean and standard deviation. Set warning thresholds at 1.5 standard deviations and critical thresholds at 2.5-3 standard deviations, applying statistical process control (SPC) principles.
2. Layer in regulatory floors. Some thresholds are non-negotiable: CMS quality measures, Joint Commission standards, and state health department benchmarks override statistical baselines when they are more stringent.
3. Tier alerts by urgency and response owner. Tier 1 alerts (e.g., ICU nurse-to-patient ratio breach) require a push notification to a named owner within minutes. Tier 2 alerts (e.g., 30-day readmission trending upward) appear on the morning operations review. Tier 3 alerts (e.g., supply cost variance above 5%) surface in the weekly finance cadence.
4. Recalibrate quarterly. Patient populations and care delivery models shift. A threshold configured today may generate excessive noise within 18 months if your case mix changes materially.
5. Suppress cascade alerts during declared incidents. When a primary event will logically trigger secondary metric breaches - such as a mass casualty event causing ED wait time and bed occupancy spikes - suppress the downstream alerts automatically during the incident window to prevent alert fatigue among operations staff.
For guidance on which metrics belong in which reporting context, what metrics should a financial reporting dashboard include covers the prioritization logic that applies across both clinical and finance layers.
What Are HIPAA-Safe Data Handling Requirements for Healthcare Dashboards?
HIPAA-safe data handling for healthcare dashboards means protecting Protected Health Information (PHI) at three distinct layers - at rest, in transit, and at display - and maintaining an auditable access record for every interaction with patient data.
The HIPAA Security Rule's Technical Safeguards (45 CFR 164.312) define four categories that govern dashboard architecture directly:
Access controls: Each user must authenticate with a unique identifier. Shared credentials violate HIPAA and render audit logs unusable for breach investigation.
Audit controls: Systems must record and examine activity in electronic PHI environments. Every query, export, and view event must be logged with a timestamp and user ID.
Integrity controls: Mechanisms must verify that PHI has not been altered or destroyed improperly - this requires version-controlled data pipelines and checksums on every data load.
Transmission security: Any PHI crossing a network must be encrypted. TLS 1.2 is now considered legacy — NIST SP 800-52 Rev. 3 (2024) formally deprecated it for regulated data environments; TLS 1.3 is the effective minimum for all new builds and should be retrofitted to existing pipelines on the next scheduled maintenance window.
At the display layer, apply these additional safeguards:
Mask by default. Patient names, MRNs, and dates of birth should be masked in aggregate views and revealed only when a clinician with documented need selects an individual record, triggering a logged audit entry.
Enforce session timeouts. PHI-accessible sessions should auto-lock after 10-15 minutes of inactivity, consistent with HIPAA workstation use policies.
Apply DLP controls to exports. Data Loss Prevention policies should flag or block unencrypted exports of any field tagged as PHI.
Separate de-identified analytics layers. Population-level dashboards for quality teams and executives should draw from a de-identified data layer built using HIPAA Safe Harbor (removing all 18 identifiers) or Expert Determination. Connecting population dashboards directly to a live PHI database is a governance failure that exposes the organization to breach liability.
For teams using AI-augmented analytics alongside clinical dashboards, the CFO's 6-question AI risk checklist for Power BI addresses governance controls at the model and output layer that complement these HIPAA safeguards directly.
How Does Role-Based Access Control Work in Hospital Dashboard Design Best Practices?
Role-based access control (RBAC) assigns data permissions to job roles rather than individuals, so that each user's access automatically reflects their clinical or operational scope without requiring manual updates each time someone changes responsibilities.
In HIPAA terms, RBAC is the primary technical mechanism for enforcing the Minimum Necessary standard: staff see only the data required for their specific function. Implementations that grant broad access and rely on voluntary restraint are a recurring source of reportable breaches.
A practical RBAC matrix for hospital dashboards:
| Role | Clinical PHI | Aggregate Quality | Finance Data | System Logs |
|---|---|---|---|---|
| Attending Physician | Own patients only | Unit-level | None | None |
| Charge Nurse | Unit patients | Unit-level | Labor only | None |
| Quality Manager | De-identified only | Hospital-wide | None | None |
| CFO / Finance Director | None | Summary only | Full access | None |
| CIO / IT Admin | None | None | None | Full access |
| Executive (CEO/COO) | None | Hospital-wide | Summary | None |
Implementation principles:
Integrate with your Identity Provider. Role assignments should sync from your HR or IdP system so that a nurse who transfers units automatically loses access to the prior unit's data without a manual support ticket.
Use row-level security, not separate dashboards. A single dashboard with dynamic row-level security (RLS) filters is more maintainable and produces cleaner audit trails than maintaining separate role-specific builds.
Add a break-glass mechanism. Emergency clinicians occasionally need temporary access beyond their normal role. A time-limited break-glass workflow with mandatory documented justification satisfies HIPAA's flexibility provisions without creating a permanent access gap.
Certify RBAC assignments quarterly. Role creep - where users accumulate permissions without losing older ones - is endemic in healthcare organizations. Formal quarterly recertification prevents it.
For teams working with external analytics partners, outsourced financial analytics services covers compatible governance principles for RBAC in externally managed BI environments.
Healthcare Analytics Dashboard vs EMR Reporting Tools: What Is the Difference?
A healthcare analytics dashboard aggregates data from multiple systems into a strategic decision layer. An EMR reporting tool generates transactional reports from a single clinical record system. These serve fundamentally different purposes and should not be treated as substitutes for each other.
According to Future Market Insights (2026), the AI consulting services market reached USD 13.4 billion in 2026 and is projected to grow to USD 96 billion by 2035 - with healthcare analytics cited as a primary growth driver as hospital systems transition from retrospective EMR reporting to prospective, AI-augmented decision support.
| Dimension | Analytics Dashboard | EMR Reporting Tool |
|---|---|---|
| Data sources | Multi-system (EMR, ERP, claims, labs, HR) | Single EMR only |
| Refresh rate | Near-real-time to hourly | Nightly or weekly batch |
| Primary users | Administrators, CIOs, finance, quality | Clinicians, coders, compliance |
| Customization | High - custom KPIs, RLS, visual design | Low - vendor-defined templates |
| HIPAA governance | Requires separate configuration | Partially inherited from EMR |
| AI and ML integration | Yes - predictive alerts, anomaly detection | Limited or none |
| Cost structure | BI licensing plus data engineering | Usually included in EMR contract |
The practical implication: hospital organizations that conflate these two tools consistently under-invest in analytics infrastructure, assuming EMR reports are sufficient - then discover the gap when payer contract negotiations require DRG-level margin data that no single EMR can produce. A health system running 10-15 siloed EMR reports daily can still lack the cross-system visibility to answer a basic strategic question: "What is our true net margin per DRG after accounting for labor, supply, and payer adjustments?" — a reconciliation that typically requires three to five analyst days when assembled manually across disparate systems. Answering it reliably requires a governed analytics layer drawing from finance, HR, and supply chain data in addition to clinical records - something EMR reporting tools are architecturally incapable of providing.
If your organization is ready to build that layer, Managed Power BI services from Lets Viz provide a governed, HIPAA-aware implementation path designed for healthcare organizations that need both clinical and financial visibility in a single auditable environment.
---
About Lets Viz: Lets Viz is a data analytics consulting firm with over a decade of experience designing governed dashboards for healthcare, finance, and operations teams across the US and UK. Our engagements span hospital systems, specialty clinics, and payer organizations navigating HIPAA compliance alongside value-based care transitions, and our team holds credentials across Power BI, Tableau, and modern data stack architecture.
---