Simplifying Data Blend with Zoho Analytics Lookup Column
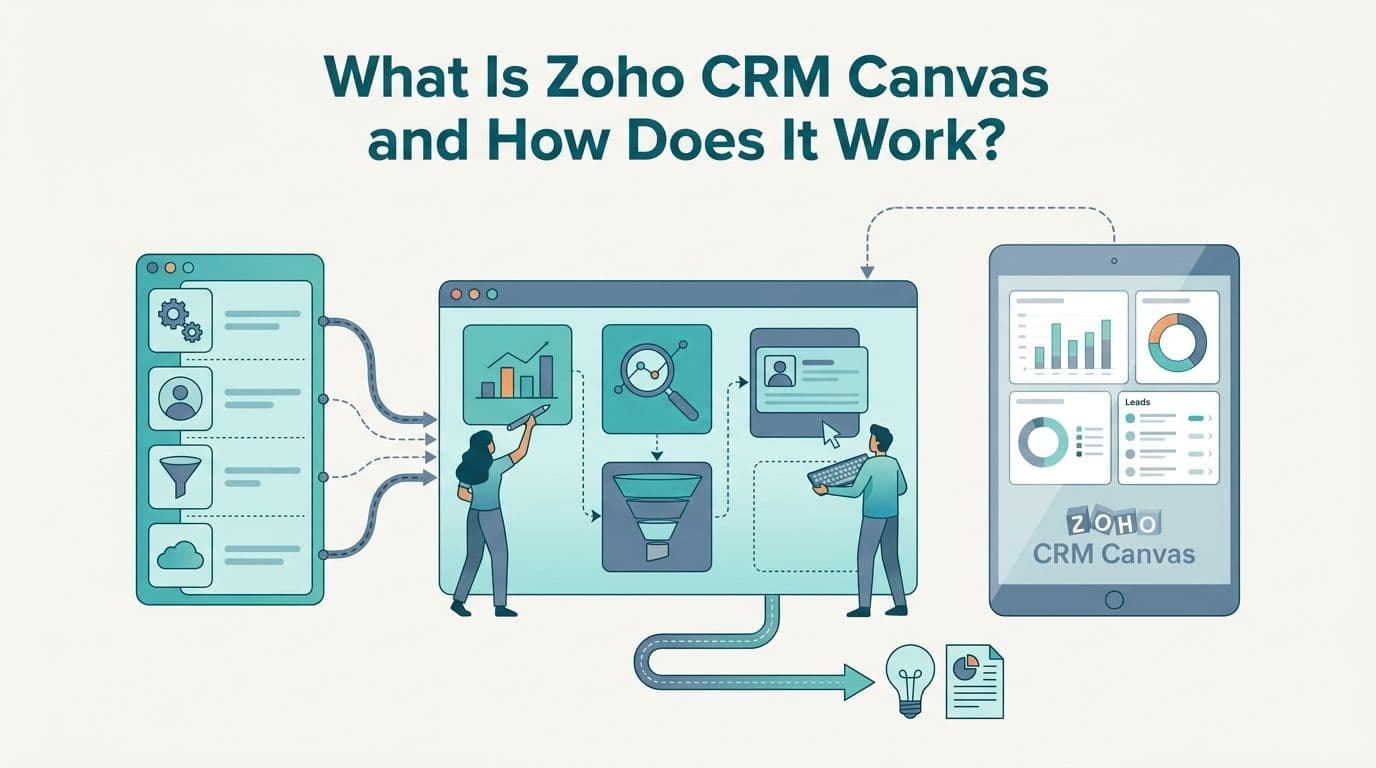
Zoho Analytics Lookup column is a type of column used in Zoho Analytics, a data analytics and reporting tool. It allows you to retrieve data from another table and display it in the current table. The lookup column acts as a reference to the data in the other table, and the data is not duplicated in the current table. This helps to reduce data duplication and improve data integrity.
The lookup column can be used to display data such as product names, customer names, and other related information, based on a common key value between the two tables.
For example, if you have a table with customer IDs and another table with customer names, you can create a lookup column in the first table to display the customer names based on the customer IDs. This makes it easier to understand the data in the first table and provides additional context to the data
Create Lookup Column
To create a lookup column, you first need to create two tables in Zoho Analytics. The first table will be the source table, which contains the data you want to display in the lookup column. The second table will be the target table, which contains the data you want to retrieve and display in the lookup column.
Once you have created the two tables, you can create the lookup column in the target table. To do this, you need to select the target table and click on the “Add Column” button. From the list of column types, select “Lookup” and specify the source table and the source column that you want to retrieve data from.
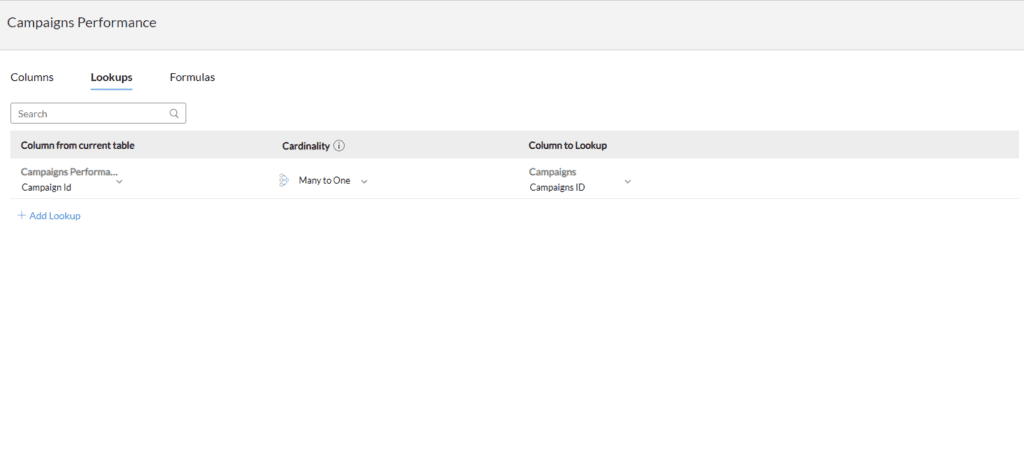
Or You can Open the Data select “Edit Design” Option and go to “Lookups”. On the base of Opened data table column select secondary data table column.
You also need to specify the common key value between the two tables, which will be used to match the data in the source table with the data in the target table.
Apply Lookup Column
Once you have created the lookup column, you can use it to display data in the target table. The lookup column will automatically retrieve data from the source table based on the common key value, and display it in the target table. You can also use the lookup column in reports and dashboards, just like any other column in Zoho Analytics.
As you can see, business intelligence has a lot to offer businesses of all sizes across all industries. If you’re not already using BI in your decision-making process, now is the time to start!
Check out other helpful Zoho Blogs below
Follow us on Twitter, Facebook, Linkedin, and Tableau Public to stay updated with our latest blog and what’s new in Tableau.

If you are looking forward to getting your data pipeline built and setting up the dashboard for business intelligence, book a call now from here.
#zoho #zohoanalytics #data #business #artificialintelligence #machinelearning #startup #deeplearning #deeplearning #datascience #ai #growth #dataanalytics #india #datascientist #powerbi #dataanalysis #tableau #businessanalytics #businessanalyst #businessandmanagement #dataanalyst #businessanalysis #analyst #analysis #powerbideveloper #powerbidesktop #letsviz