SEO Reporting Metrics & KPIs Every Agency Should Track
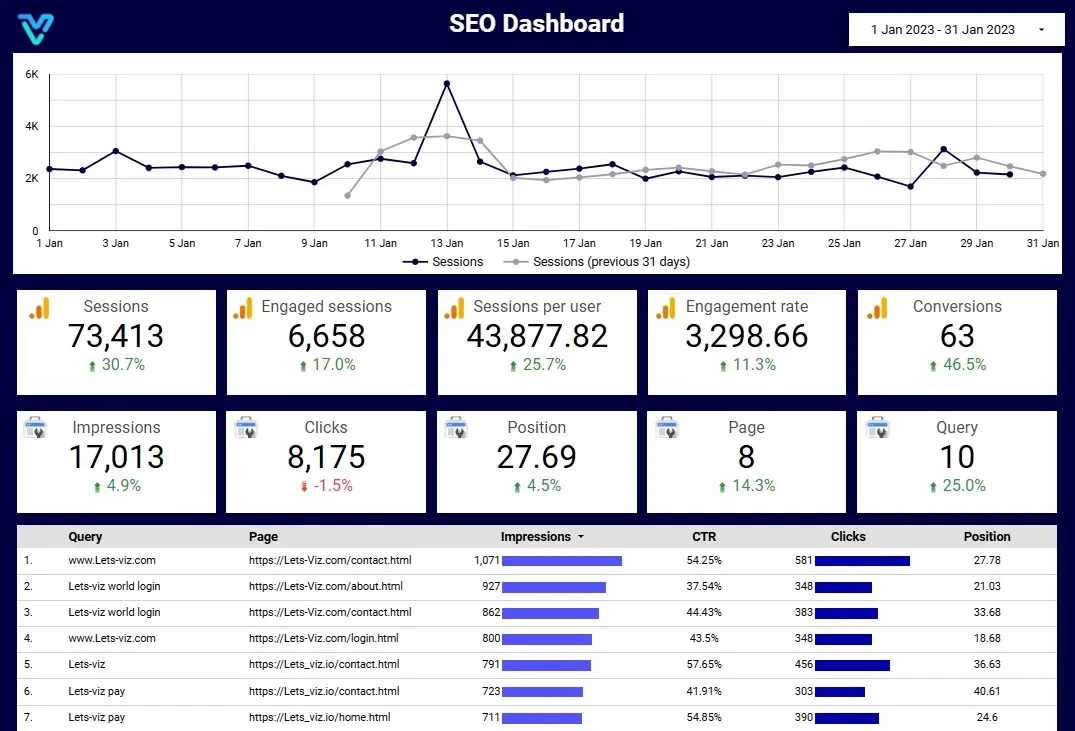
Most SEO reports fail for the same reason: they show everything Search Console and GA4 can export, and the client cannot tell whether things got better. A good report answers three questions in the first minute. Are more of the right people finding us? Are they doing what we want once they arrive? What are we doing next, and why?
This guide lists the SEO reporting metrics and KPIs worth tracking for clients, what each one actually measures, the traps in reading them, and a simple structure for a monthly report that a client will read to the end.
Start with the outcome, then work backwards
Before choosing metrics, agree with the client on what organic search is for. A B2B services firm wants qualified enquiries. An e-commerce store wants revenue. A publisher wants engaged readers. The KPIs at the top of the report should be the ones tied to that goal; everything else is supporting evidence.
A useful rule: no more than three headline KPIs. If a number would not change a decision, it belongs in an appendix, not on page one.
Visibility metrics from Google Search Console
These four metrics come from the Performance report in Google Search Console. They describe how often your pages appear in Google and how often people click.
- Impressions: how many times a page from the site appeared in search results a user saw. A rise in impressions usually means the site is ranking for more queries, or ranking higher for existing ones.
- Clicks: how many times users clicked through to the site from Google Search. This is the closest Search Console metric to real traffic.
- CTR (click-through rate): clicks divided by impressions. It depends heavily on position and on what else is on the results page, such as ads, AI Overviews, video and "People also ask" boxes.
- Average position: the average of the topmost position the site held for each impression. It is weighted by impressions, so it can move for reasons that have nothing to do with ranking changes.
How to read them without fooling yourself
- Average position can get worse while the site gets better. If a page starts ranking at position 40 for a hundred new queries, the site-wide average drops even though nothing was lost. Report position per query group or per page, not as one site-wide number.
- CTR falls when impressions grow at low positions. New impressions on page three dilute CTR. Look at CTR for the queries where you already rank in the top five.
- Branded and non-branded traffic behave differently. Brand searches have high CTR and say little about SEO work. Split them, so a brand campaign does not hide a non-branded decline.
- Search Console hides some queries. Rare queries are anonymised, so the query table never adds up to the total. Say so in the report rather than explaining the gap later.
Traffic and engagement metrics from GA4
Search Console stops at the click. GA4 tells you what happened after it. Filter these to the organic search channel.
- Organic sessions and users: visits that arrived from search engines. Expect them to differ from Search Console clicks; the two tools count in different ways, and consent banners and blockers remove some GA4 data.
- Engaged sessions and engagement rate: sessions that lasted longer than ten seconds, viewed two or more pages, or triggered a key event. This is more useful than bounce rate, which in GA4 is simply the share of sessions that were not engaged.
- Landing pages: which pages bring organic visitors in. Pair this with Search Console page data to see which pages earn impressions but lose the click.
Conversion KPIs: the numbers clients care about
These are usually the headline KPIs.
- Key events from organic traffic: form submissions, booked calls, sign-ups, purchases. GA4 renamed conversions to key events in 2024; make sure the events you report are the real business actions and not page views of a contact page.
- Organic conversion rate: key events divided by organic sessions. It shows whether SEO is bringing the right visitors, not only more of them.
- Revenue or pipeline from organic: for e-commerce, GA4 revenue by channel. For B2B, match CRM leads to their first-touch source so the report can show qualified pipeline that started in search.
A practical check before you report any conversion number: compare it with the source of truth, such as the CRM, the booking tool or the order system, for one month. If the analytics count is far higher, something other than real conversions is firing the event.
Diagnostic metrics: keep them, but lower down
These explain why the headline numbers moved. They matter to the SEO team and belong in a second section or an appendix.
- Indexing: how many important pages are indexed, and any that are "crawled, currently not indexed" or "discovered, not indexed".
- Core Web Vitals: the share of URLs passing for LCP, INP and CLS, from the Search Console report.
- Top gaining and losing queries and pages: the five biggest movers each way, with a one-line reason where you know it.
- Cannibalisation: queries where two of your own pages swap places. These often show up as unstable positions with low CTR.
- Backlinks gained and lost: count of new referring domains, with notable ones named. Third-party authority scores are estimates; treat them as context, not targets.
Metrics to drop or explain
- Raw keyword rankings for hundreds of terms. A long ranking table invites questions about single positions that do not matter. Report a tracked set grouped by intent, and show the trend.
- Total keywords ranked. It rises when the site ranks on page eight for more terms; on its own it says nothing about traffic.
- Time on page in isolation. Without a goal it is easy to misread; engagement rate and key events say more.
A monthly client report structure that gets read
- Summary (one screen): the three headline KPIs, each against the previous month and the same month last year, with a one-line verdict.
- What changed and why: two or three wins and two or three problems, in plain language, each linked to a page or query group.
- Work completed: what was shipped this month, such as pages published, fixes made and links earned.
- Next month: the three most valuable actions and what each should move.
- Appendix: the visibility, engagement and diagnostic metrics above, for anyone who wants detail.
Compare month on month for direction and year on year for seasonality. Search Console keeps 16 months of data, so export it regularly if the client will want longer history.
Turning the report into a live view
Copying numbers into slides every month is where reports go stale and errors creep in. Most of the metrics above can come straight from the Search Console and GA4 APIs into one live view that updates itself. If you want that built for your team or your clients, see our SEO dashboard for GA4 and Search Console, or the Looker Studio SEO dashboard if your reporting already lives in Looker Studio.