Power BI Audit — What's Wrong, What to Fix, and In What Order
We audit your Power BI environment in 5 business days. DAX Studio performance profiling of your 10 slowest measures. Model assessment. Row-level security review. Governance snapshot. Every finding scored by impact and effort — so you know exactly what to fix first. Fixed price.
Trusted by teams across 15+ countries
What the audit delivers
Driving measurable success through data. We help our clients achieve improved KPIs, operational efficiency, and tangible business outcomes.
5
Business day turnaround
10
Slowest measures profiled
5
Finding categories covered
40-60%
Typical orphaned content found
Most Power BI environments have at least three of these five issues
Measure logic errors — DAX measures that look right but produce incorrect totals at different grain levels. SUMX used where SUM would work. CALCULATE filter context misunderstood. These are invisible until someone drills through and the number changes unexpectedly.
Slow DirectQuery reports — model on DirectQuery when data volume does not justify it, or DirectQuery without query reduction settings, sending hundreds of queries per visual render. End users see 8+ second load times and blame 'Power BI' rather than the model configuration.
Relationship chaos — many-to-many relationships everywhere because someone did not normalise the model. Cross-filter direction set to Both across the entire model, causing circular ambiguity and incorrect filter propagation.
No row-level security — everyone in the company can see everyone else's regional data, never configured because the original builder 'didn't need it for the pilot.' Common in environments built by a one-off contractor who no longer works with the company.
Orphaned reports and datasets — 40-60% of workspaces we audit have reports that nobody has opened in 90+ days consuming gateway connections and refresh slots. This is a licence waste issue that the audit surfaces immediately.

What the audit covers — five deliverables in five days
Our Offerings
Model assessment
Star schema vs flat table diagnosis. Calculated column vs measure misuse. Relationship cardinality issues. Bi-directional filter misuse. Import vs DirectQuery appropriateness for your data volume.


A fix list, not a judgement
We have audited environments built by one-person IT departments, ex-Excel users, and well-meaning contractors. The report is actionable, not critical.
DAX Studio profiling, not guesswork
We run Server Timings on your 10 slowest measures, inspect Storage Engine query plans, and identify Formula Engine overhead. Every slow measure in the report includes the specific DAX pattern causing the bottleneck.
Full environment view, not just report design
We look at the workspace structure, dataset sharing, sensitivity labels, service principal configuration, and refresh history — not just whether the visuals look nice.
Prioritised by impact and effort
Every finding is scored High / Medium / Low for impact and Quick win / Sprint / Full rebuild for effort. You get a ranked list — not a wall of recommendations with no guidance on what to do first.
No Global Admin access required
We need Viewer access to the workspaces being audited and Read access to datasets to run DAX Studio queries. We do not require Global Admin or Power Platform Admin roles. NDA signed before access is granted.
Five business days from access to prioritised fix list
A strategic approach tailored to your business needs.
Day 1 — Access and scoping
We request Viewer access to your workspaces and dataset Read access. NDA signed. We inventory all datasets, reports, and workspaces in scope and flag any obvious high-priority issues immediately.
Day 2-3 — Model assessment and DAX profiling
DAX Studio profiling of the 10 slowest measures. Model assessment against star schema best practices. Relationship audit. RLS role testing across all defined roles.
Day 4 — Governance and security review
Workspace structure analysis. Dataset sharing and sensitivity label audit. Orphaned report and dataset identification. Service principal vs personal user account exposure.
Day 5 — Fix list delivery and walkthrough
Full audit report delivered. Every finding scored by impact and effort. 45-minute walkthrough call to explain findings, answer questions, and discuss remediation options.
Wondering what this would cost you?
Answer a few questions and see an honest price range on screen — no email, no call needed.
See it in action
Real engagements. Documented outcomes.
From Four Systems to One Source of Truth
How a regulated US neurovascular device manufacturer turned siloed ERP and third-party market data into dashboards leadership trusts — with every KPI reconciled to source.
From Attribution Chaos to Marketing Clarity
How a wellness retreat discovered its Facebook ROAS was 70% higher than reported — and why a 27% revenue drop had nothing to do with ad creative.
Power BI Audit — Common Questions
Find answers to common questions about our services and process.
Further reading
Guides and insights to help you make an informed decision.
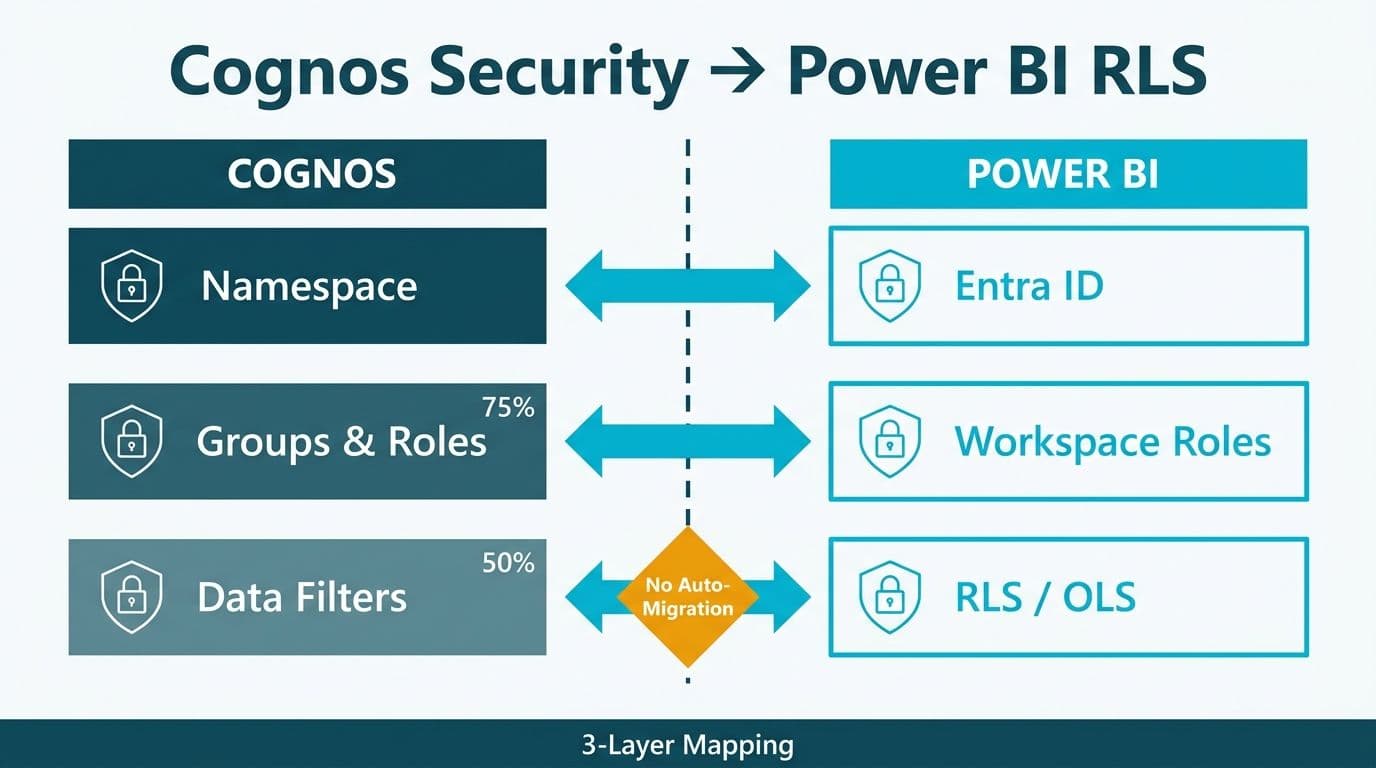
Cognos Security Model vs Power BI RLS: Side-by-Side Mapping
Map Cognos namespaces, groups, and data-level security filters to Power BI RLS and OLS - the technical guide developers need mid-Cognos-to-Power-BI migration.
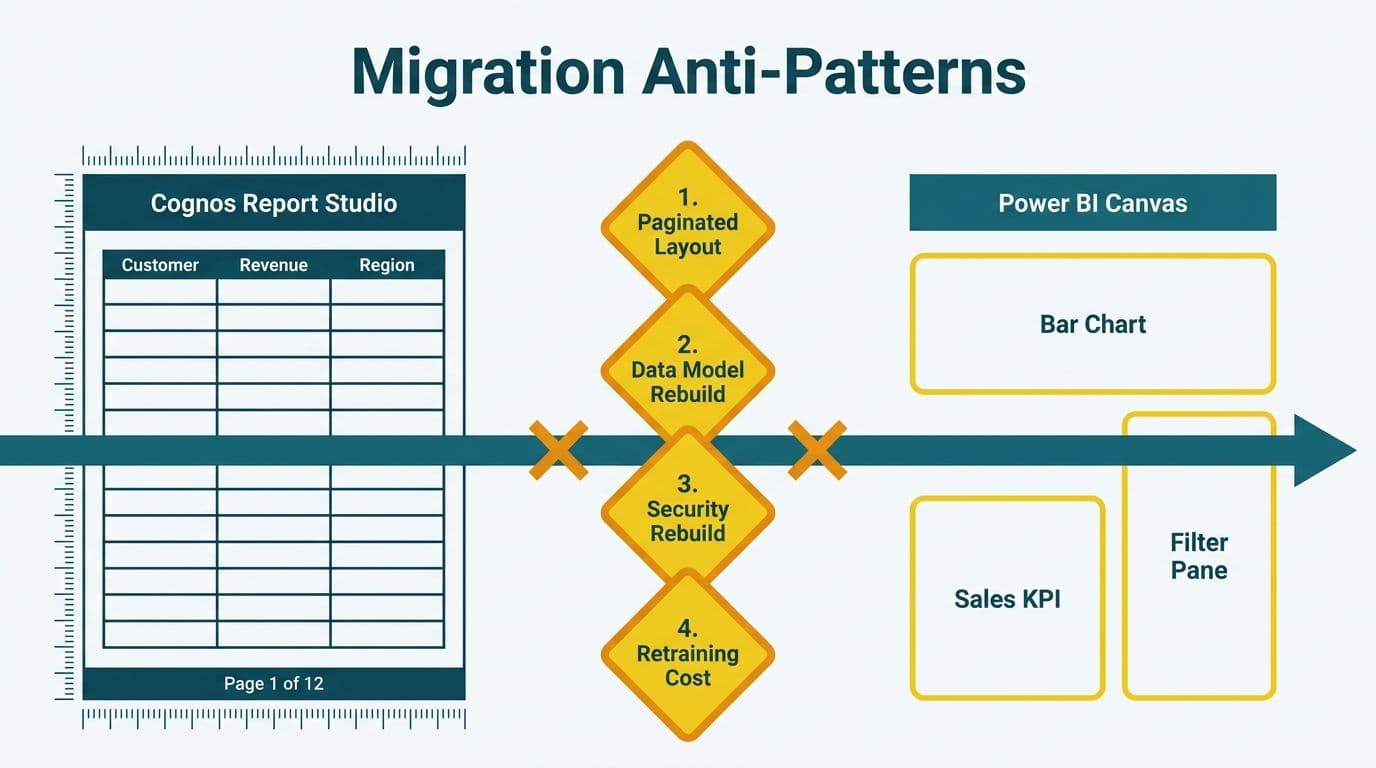
Cognos to Power BI Migration Mistakes: Anti-Pattern Guide
The most common Cognos to Power BI migration mistakes: pixel-perfect paging, M:M data model gaps, skipped RLS, and underestimated retraining - explained.
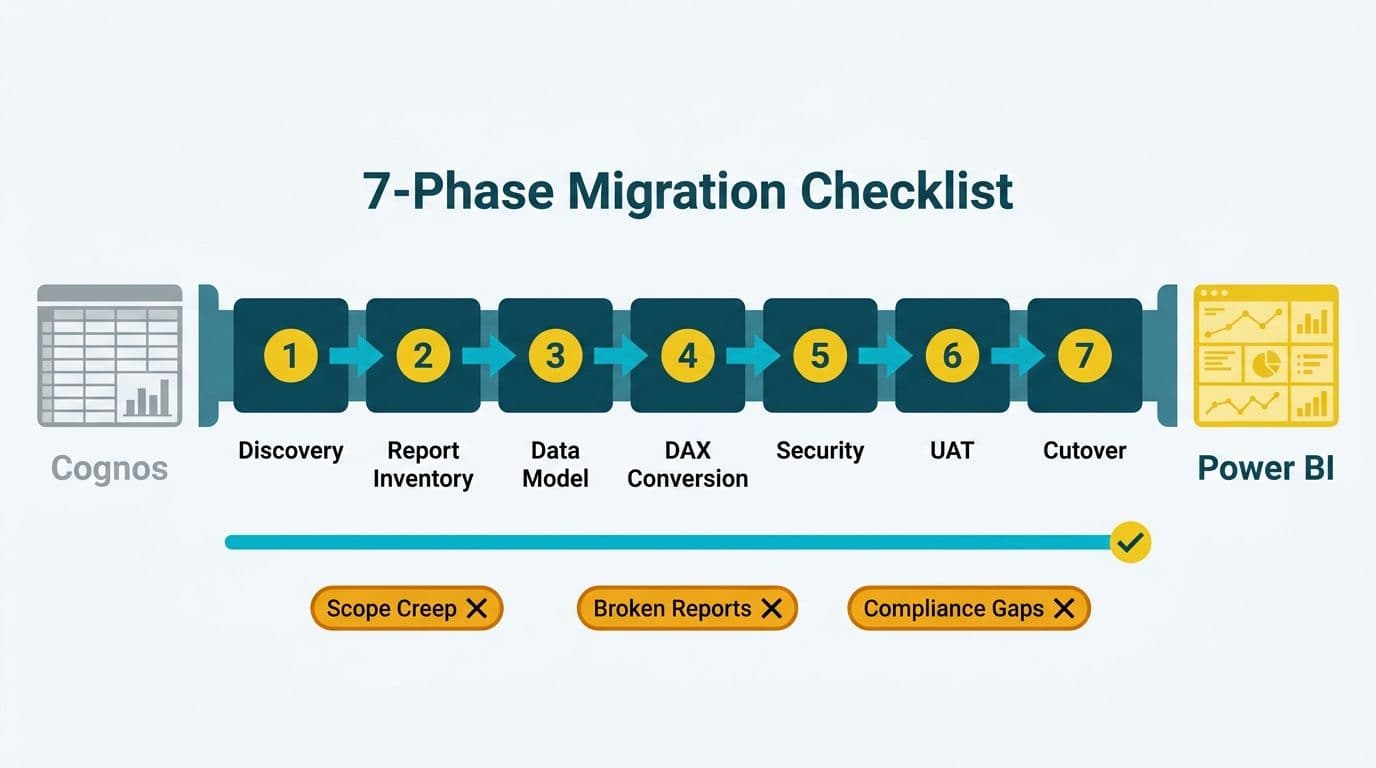
Cognos to Power BI Migration Checklist: 7-Phase Guide
A phase-by-phase Cognos to Power BI migration checklist covering discovery, DAX conversion, security mapping, UAT, and cutover for mid-market data teams.

Find out what's actually wrong with your Power BI environment.
Five business days. Five deliverables. One fixed price. Book a scoping call to confirm your workspace size and access requirements.