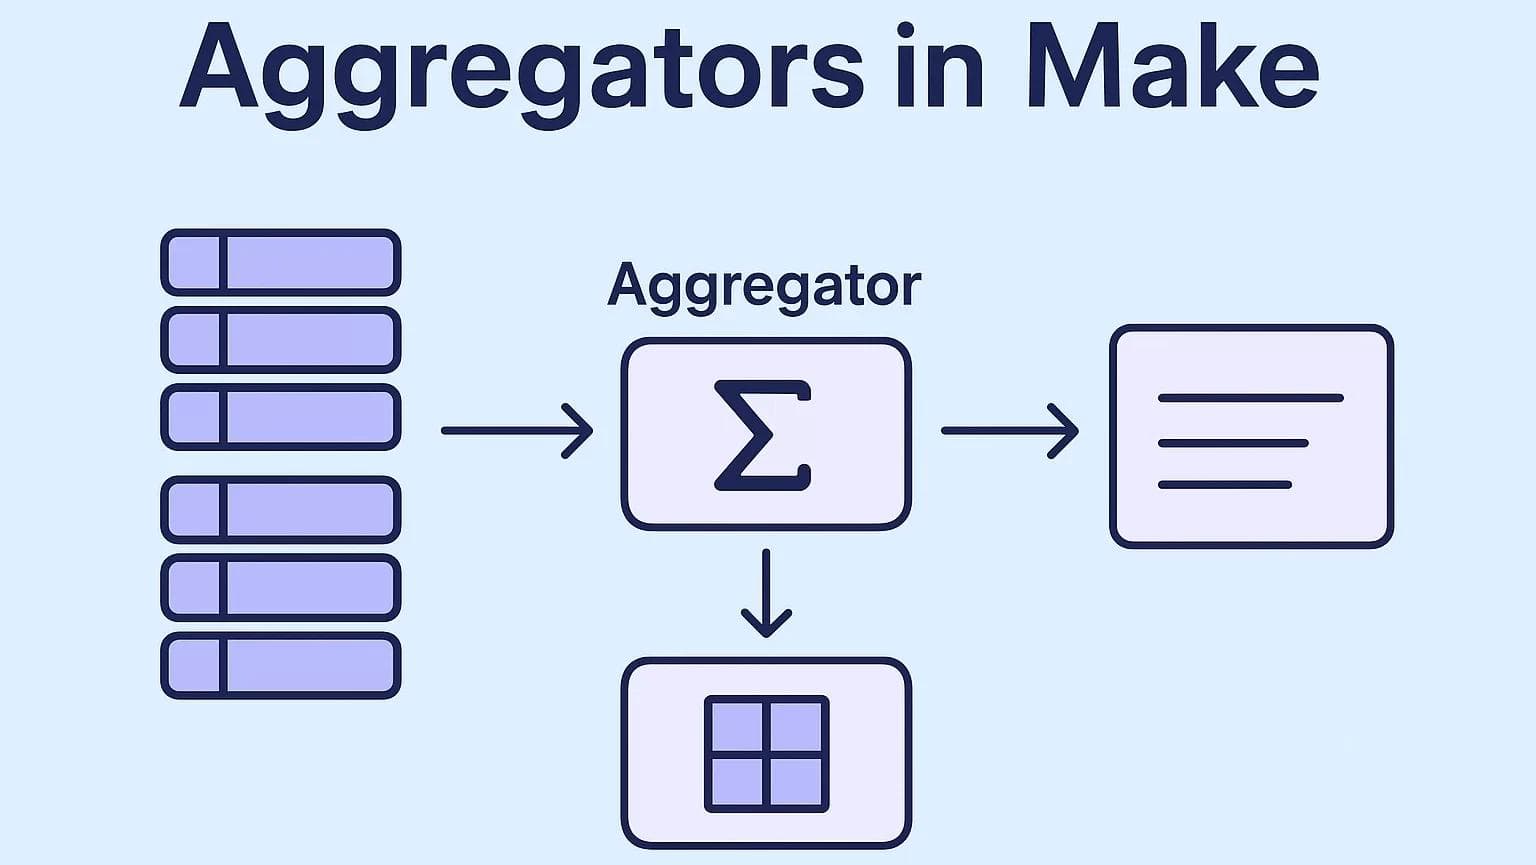
An Introduction to Aggregators in Make: How I Learned to Group, Combine, and Simplify Data
When I first started building scenarios in Make, I often ran into the same problem: I had too much data scattered across multiple bundles, and I needed a way to combine it into something useful. That’s when I discovered aggregators.
In this post, I’ll walk you through what aggregators are, how they work, and why they’re so powerful. I’ll also show you practical examples—from social media tracking to inventory management—that highlight just how much time and effort they can save.
By the end, you’ll not only understand the fundamentals of aggregation in Make, but you’ll also feel confident setting up numeric and text aggregators in your own scenarios.
What Are Aggregators?
Let’s start simple. Aggregation is the process of combining multiple values into a single value.
Think of it like building a wall. You start with a pile of bricks, but one brick by itself isn’t useful. Once you put them together with cement, you’ve got something strong and functional. That’s what aggregation does: it takes many small pieces and merges them into one big, usable result.
In Make, aggregators are the tools that perform this combining step. They collect items from multiple bundles (with the same structure) and condense them into a single bundle.
What Exactly Do Aggregators Do?
To break it down, aggregators perform two key functions:
Mapping – deciding which items to use from your data source.
Reduction – combining those items into a new value or structure.
Let’s go back to the brick wall example:
You’ve received several pallets of bricks, but some are cracked.
Choosing the unbroken ones for the wall = mapping.
Assembling them into a finished wall = reduction.
That’s how aggregators work in Make—they let you select what matters, then combine it into something useful.
Why Are Aggregators Useful?
Here’s why I love them: aggregators don’t just combine data, they make data meaningful.
Take this analogy: imagine you have a box of colored pencils. Without any organization, it’s just a jumble of colors. But if you use an aggregator to group them by color, suddenly you can see patterns:
1 red
1 blue
3 green
5 purple
Now you know:
You have 10 pencils in total.
You’re running low on red and blue (time to buy more).
You definitely don’t need more purple.
Aggregators give you insight at a glance. Instead of staring at raw data, you get something you can analyze and act on.
Aggregators in Make: The Different Types
Within Make, you’ll find several types of aggregators under Tools and Flow Control. While they all perform aggregation, each works slightly differently.
1. Tools Aggregators
These include Table, Text, and Numeric aggregators.
Numeric aggregator: Perfect for math operations like SUM, AVG, COUNT, MIN, and MAX.
Text aggregator: Combines multiple text values into one string (great for reports and emails).
Table aggregator: Organizes bundles into rows and columns for export or structured analysis.
2. Array Aggregator
This is a powerhouse tool. It lets you combine fields from multiple bundles into a single array. You can also customize which fields appear in the output.
For example:
Bundle 1 = Library products (books + magazines).
Bundle 2 = Users.
With the Array aggregator, I can combine “magazines” (from bundle 1) and “users” (from bundle 2) into one array while ignoring the rest.
Deep Dive: The Numeric Aggregator
The numeric aggregator is where the magic happens if you’re working with numbers. It’s one of my favorites because of how versatile it is.
Here are some real-world ways I’ve used it:
Time Tracking: Aggregate all logged hours into one report for invoicing. No more manual calculations.
Social Media Monitoring: Track brand mentions, likes, and shares across platforms, then SUM them into a single engagement score.
E-commerce: Aggregate sales by product or by region to see what’s performing best.
Inventory Management: Aggregate stock levels across multiple warehouses so you know when and where to reorder.
Common Numeric Functions in Make
AVG() – Find the average value (e.g., average employee salary).
SUM() – Add everything up (e.g., total monthly expenses).
COUNT() – Count how many items meet a condition (e.g., number of customers under 5 years’ loyalty).
MAX() – Identify the highest value (e.g., largest payment received).
MIN() – Identify the lowest value (e.g., smallest expense).
These simple functions save hours of spreadsheet work.
Deep Dive: The Text Aggregator
Sometimes, it’s not numbers you want to combine, but text. That’s where the Text Aggregator comes in.
It collects multiple text values and joins them into a single block or list.
How It Works
Input: Rows of text (from Google Sheets, Airtable, APIs, etc.).
Processing: The module groups them.
Output: One text string with a separator you choose (comma, semicolon, line break, etc.).
Example Use Case
Let’s say I pull a list of new leads from a CRM. Instead of blasting multiple emails, I want to send one daily summary email to the sales team.
Here’s how I’d set it up:
Search Module → Fetch new leads.
Text Aggregator → Combine lead names + emails with line breaks.
Email Module → Send one summary email.
That’s it—clean, efficient, and much friendlier for the team than spamming their inboxes.
Wrapping It Up
When I first discovered aggregators in Make, I realized they’re more than just data-combining tools—they’re insight engines. Whether it’s crunching numbers, summarizing text, or organizing arrays, aggregators let you transform messy data into something actionable.
Here’s the quick takeaway:
Use numeric aggregators for calculations (SUM, AVG, etc.).
Use text aggregators to join strings (reports, summaries).
Use the array aggregator to build custom output structures.
The beauty of Make is that these tools fit into any scenario—from automating e-commerce sales reporting to simplifying CRM updates. Once you start using aggregators, you’ll wonder how you ever managed without them.
Ready to start building? Sign up for Make.com today and discover the power of agentic automation for yourself.
📩 Contact us today to schedule a free consultation and see how automation can help you keep more customers, protect revenue, and grow stronger.
Check out other helpful Make.com Workflow Automate Blogs
- Understanding Execution and Cycles in Make.com: A Hands-On Guide
- Connections, Webhooks, and Filters in Make.com: A Practical Guide
- Transforming Data in Make.com: A Professional Guide to Using Functions for Business Automation
- AI Agents in Make.com: The Future of Business Automation
- Mastering Dates and Time in Make.com: A Practical Guide for Automation Builders
- How to Use HTTP Module in Make.com: My Complete Guide to Custom API Magic
An aggregator in Make is a tool that combines multiple data bundles into one. It can merge numbers, text, or structured fields, allowing you to summarize and process information more efficiently in your automation scenarios.
A numeric aggregator works with numbers—it can calculate totals, averages, maximums, and more. A text aggregator, on the other hand, takes multiple text items and merges them into one string, which is useful for summaries, emails, or reports.
The array aggregator is best when you want to keep structured data. For example, if you need to combine fields from multiple bundles into one array for further processing, use the array aggregator instead of flattening the data into just text or numbers.
Yes! It’s common to use more than one aggregator in a workflow. For example, you might use a numeric aggregator to calculate totals and a text aggregator to generate a summary message—all within the same scenario.
In most cases, no. Aggregators are lightweight operations, but performance depends on how much data you’re processing. If you’re aggregating thousands of records at once, you may want to use filters or routers to keep your scenario efficient.
One common example is generating a daily sales report. A numeric aggregator can calculate total sales and revenue, while a text aggregator can build a single message listing all products sold. This way, managers get both numbers and context in one automated report.
Not entirely. Aggregators in Make are great for quick summaries and automations, but if you need deep analytics, visualization, or long-term data storage, you’ll still want a spreadsheet or BI tool. Think of aggregators as the first layer of analysis before pushing data into dashboards.

If you are looking forward to getting your data pipeline built and setting up the dashboard for business intelligence, book a call now from here.
#analytics #data #business #artificialintelligence #machinelearning #startup #deeplearning #deeplearning #datascience #ai #growth #dataanalytics #india #datascientist #powerbi #dataanalysis #businessanalytics #businessanalyst #businessandmanagement #dataanalyst #businessanalysis #analyst #analysis #powerbideveloper #powerbidesktop #letsviz