Introducing Zoho Analytics Chart Types!
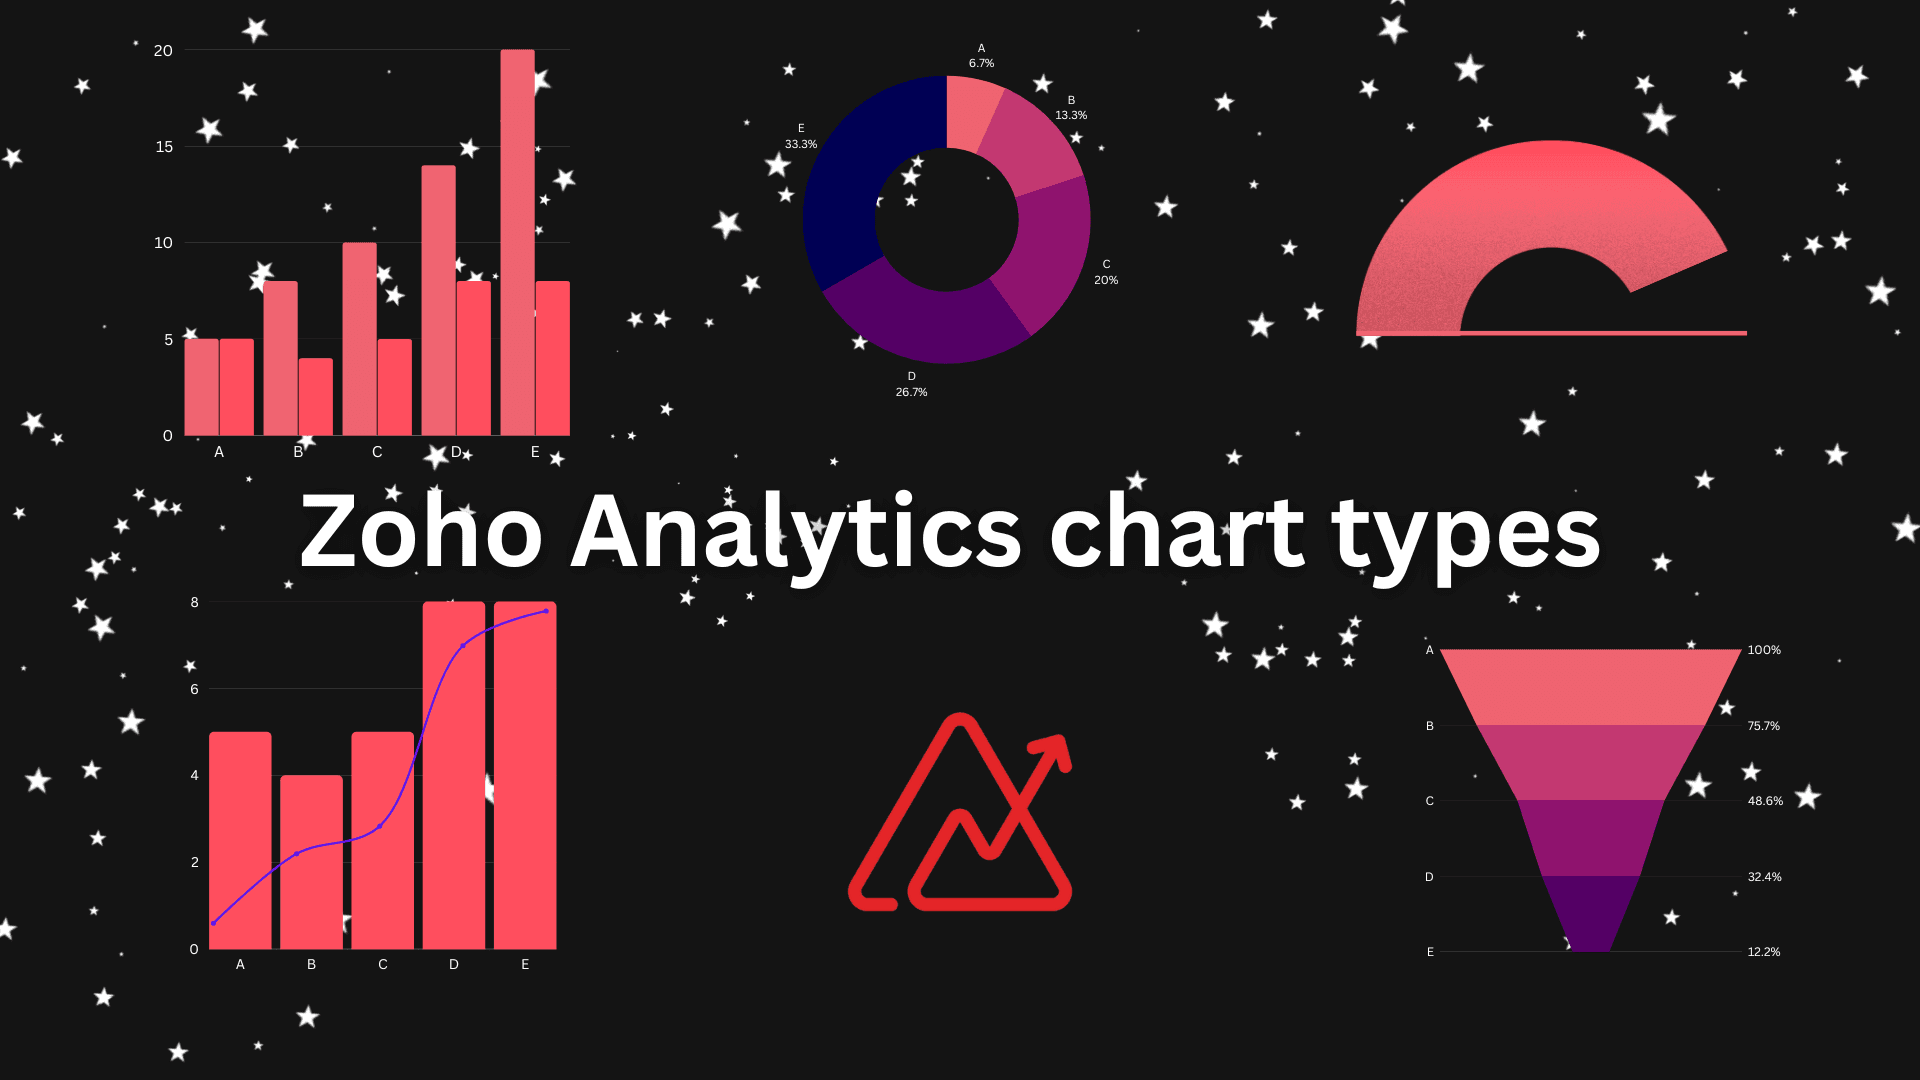
In this blog we are going to discuss Zoho Analytics chart Types. Zoho Analytics is a self-service business intelligence and data analytics program that gives you the ability to analyze your data with a simple drag-and-drop feature and generate spectacular data visualizations, and find hidden insights in a matter of minutes.
Zoho Analytics Chart Types
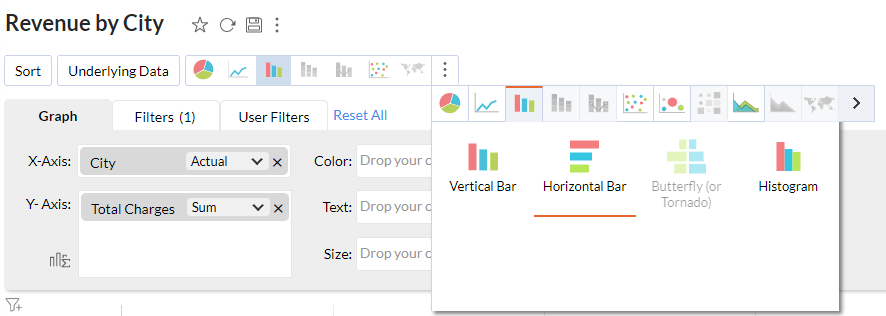
As a Data Analyst chart types really matter to build a spectacular data visualization. as Zoho is a self-service BI tool Zoho provides an auto chart creation option after importing the data. you can simply create a chart by choosing chart view in create.
Picking the right chart for your data to represent is important. If you want to know how to pick the right chart to present your data follow the blog Make Data Visualization Skill Supreme with Chart Picker.
Chart Settings
Filters
Filter Particularly used in chart view are 2 types, filter and user filter. The filter is used to apply default criteria on the chart by the developer on the other hand User filter as the name suggests provides an option for the user to choose criteria.
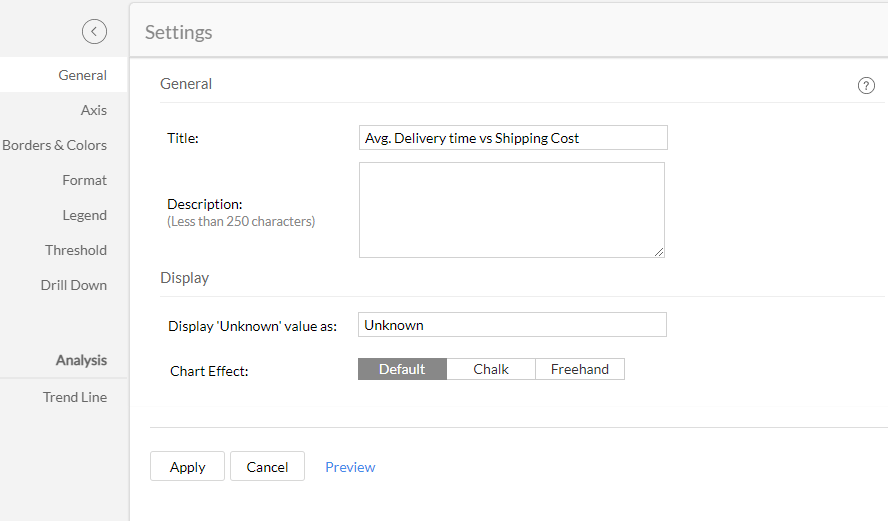
Settings
Embedded Charts of Zoho Analytics
Bar Chart
Round Chart
Combination Chart
Scatter Plot
Line Chart
Follow us on Twitter, Facebook, Linkedin, and Tableau Public to stay updated with our latest blog and what’s new in Tableau.

If you are looking forward to getting your data pipeline built and setting up the dashboard for business intelligence, book a call now from here.
#zoho #zohoanalytics #data #business #artificialintelligence #machinelearning #startup #deeplearning #deeplearning #datascience #ai #growth #dataanalytics #india #datascientist #powerbi #dataanalysis #tableau #businessanalytics #businessanalyst #businessandmanagement #dataanalyst #businessanalysis #analyst #analysis #powerbideveloper #powerbidesktop #letsviz