Complete Financial Modeling Guide for Microsoft Power BI

Crafting well-structured financial reports and statements in Microsoft Power BI can be a daunting task for many users, particularly those with only moderate experience in DAX. Even for those adepts at data modeling, creating polished, professional-looking reports often involves a significant investment of time and effort.
For instance, designing a report of medium complexity typically takes anywhere from two to five days. Despite this effort, users frequently encounter limitations in Power BI’s formatting tools. While the platform offers robust analytical capabilities, its formatting options can fall short of the expectations of financial professionals who demand precision, clarity, and a highly refined presentation.
This challenge often leaves users frustrated, as they struggle to balance the technical requirements of data modeling with the aesthetic and functional needs of a comprehensive financial report.
1. Monthly Revenue Tracke
This tool serves as an efficient and visually intuitive way to monitor monthly revenue performance. It displays actual revenue figures up to the previous month (April), which are clearly highlighted in green for easy identification. For the current month (May), actuals are actively tracked and marked in orange to distinguish them from historical data. Additionally, forecast data for the upcoming three months—spanning May through July—provides a forward-looking perspective.
To maximize data visibility, the column headers are oriented vertically, allowing the layout to remain compact and neatly organized. Users can benefit from a variety of options to keep the report dynamic and up-to-date, including Excel-like cell editing, manual data entry, automated allocations, forecasting tools, simulations, and much more. This versatility makes it an invaluable resource for tracking and projecting revenue trends.
2. Operating Profit Model
The Operating Profit Model offers a detailed visualization of account hierarchies, paired with variance analysis, all within an interactive, expand/collapse-enabled interface. This makes it easier to explore and comprehend complex account structures. With built-in support for unbalanced or ragged hierarchies, the model handles irregular structures seamlessly. For example, accounts like IT Expenses and Other Expenses, which lack child accounts, are presented cleanly without the blank row headers that typically appear in standard Power BI reports. On the other hand, accounts such as Sales and Marketing and Personnel Costs, which include subcategories, are displayed with full hierarchical detail. To enhance interpretability, the model incorporates a scale band, visually represented in blue. This feature effectively highlights scaling differences in bar charts, making it easier to compare metrics and identify outliers.
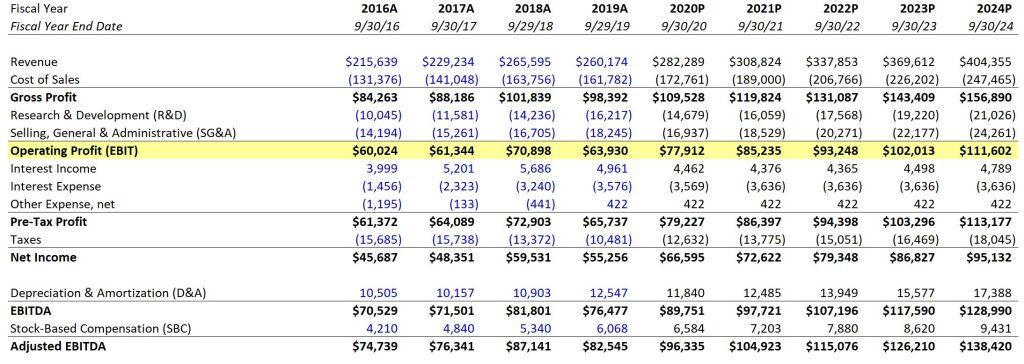
3. Income Statement
Streamline the creation of fully customizable and professional-looking income statements with unprecedented speed and ease—up to 20 times faster than traditional methods. With us, users can achieve formatting flexibility and customization that surpasses the limitations of native Power BI tools.
we enables you to implement advanced formatting techniques with minimal effort, including:
- Multiple Number Formats in a Single Column: Effortlessly apply different number formats within the same column, ensuring that data is presented in the most relevant and accurate way.
- Indented Row Headers: Achieve a clean and organized look by indenting row headers, enhancing readability and hierarchy.
- Grouped Column Headers: Easily group related column headers to better organize and summarize your data.
- Cell Formatting Options: Customize cells with currency symbols, borders, and other stylistic elements to ensure your financial statements are both professional and visually appealing.
- Support for Multi-Line Headers: Add detailed, multi-line headers to provide clarity and additional context for complex data sets.
- Drag-and-Drop Row Sorting: Simplify the organization of rows with an intuitive click-and-drag action, offering unmatched flexibility in customizing the report layout.
- And Much More: Let’s Viz offers a host of additional features to enhance the usability and presentation of your income statements.
With these advanced capabilities, we transforms the process of creating income statements, enabling users to produce highly detailed and polished financial reports with minimal time and effort.
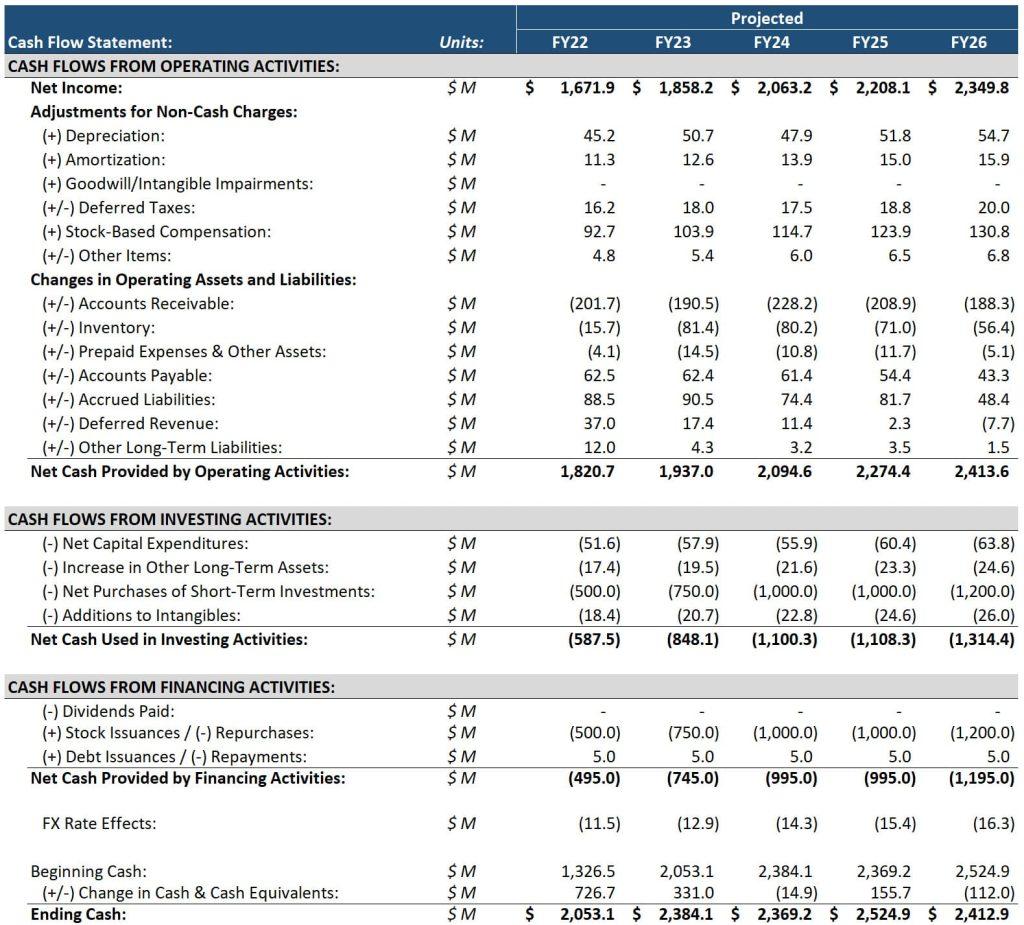
4. Cash Flow Statement
Creating accurate and visually appealing cash flow statements has never been easier. With its advanced functionality, we enables users to replicate and customize cash flow statements to match the high standards of presentation typically found in corporate annual reports.
Let’s Viz’s tools allow you to precisely recreate detailed financial statements, including those with intricate layouts and formats. For instance, Nike’s 2020 Annual Report features a cash flow statement with a clean, professional design. With us, you can effortlessly reproduce a similar report within Power BI. The result is a seamless integration of professional-grade financial documentation into your reporting processes.
Key benefits of using our cash flow statements include:
- Professional Formatting: Achieve polished layouts that mirror the sophistication of annual report standards.
- Accurate Replication: Maintain a high level of fidelity when reproducing intricate financial documents.
- Intuitive Integration: Leverage the flexibility and functionality of Power BI while benefiting from Let’s Viz’s advanced services.
Whether you’re preparing financial statements for internal stakeholders, external investors, or regulatory bodies, Let’s Viz equip you with the tools to deliver clarity, accuracy, and visual excellence. Its user-friendly environment ensures that even complex reports are produced efficiently, without compromising quality.
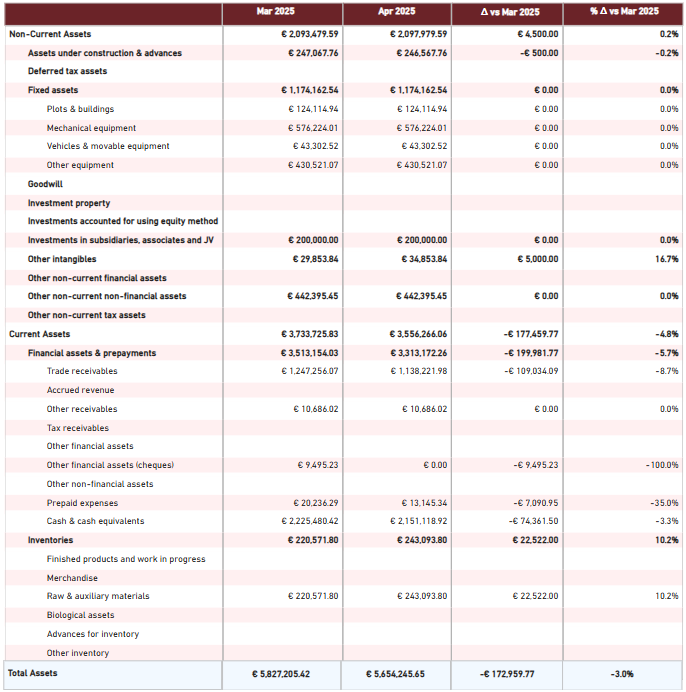
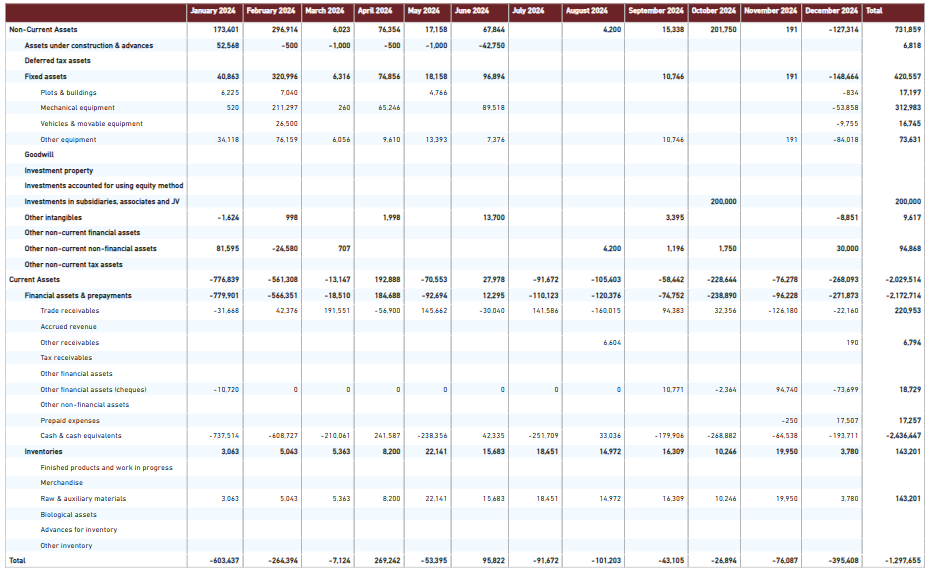
5. Balance Sheet
Let’s Viz empowers users to craft detailed and professional balance sheets directly within Power BI, offering unparalleled flexibility and control over formatting and presentation. The tool’s intuitive interface and robust functionality simplify the process of creating high-quality financial statements.
With us, you can easily enhance your balance sheets through features such as:
- Calculated Rows: Insert custom calculations seamlessly using the built-in formula editor. This intuitive tool eliminates the complexity of manual formulas, saving time and reducing errors.
- Drag-and-Drop Row Reordering: Reorganize rows dynamically with a simple drag-and-drop action. Say goodbye to complex DAX queries for sorting General Ledger (GL) accounts—Our team makes it quick and straightforward.
Additionally, Let’s Viz offers advanced formatting options to elevate the visual appeal of your balance sheet:
- Multi-Line Headers: Add detailed headers across multiple lines for enhanced clarity and organization.
- Indented Account Names: Use indentation to showcase account hierarchies clearly, improving readability and structure.
- Borders and Grouped Columns: Create a polished look with neatly defined borders and grouped column headers.
- Currency Prefixes: Include currency symbols for precise representation of monetary values.
Let’s Viz’s capabilities ensure that your balance sheets are not only accurate but also visually compelling and easy to understand. Whether used for internal financial analysis or formal presentations, these balance sheets will meet the highest standards of professionalism, combining the best of Power BI’s analytics with Let’s Viz’s advanced customization visuals. Till-date Analysis
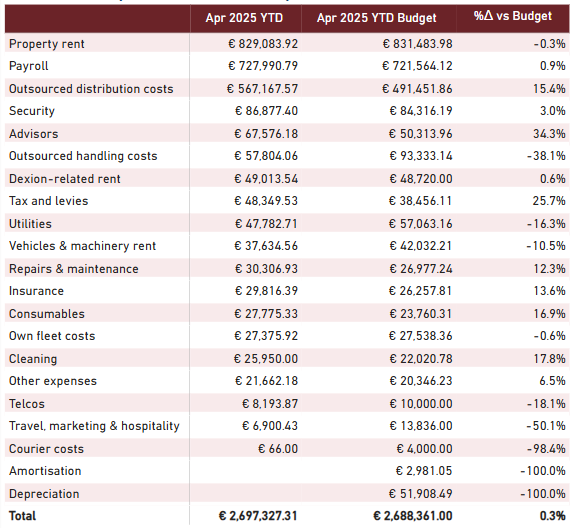
6. Till-Date Analysis
Effortlessly analyze Month-to-Date (MTD) and Year-to-Date (YTD) performance with dynamic features that allow users to interact and update their analyses on the fly. By simply selecting a month from a dropdown menu on the left side of the table, you can instantly view and compare performance metrics for the chosen timeframe.
To enhance interpretability, business metrics such as actuals, forecasts, plans, and prior year figures are visually differentiated using distinct notations:
- Solid Notation for actuals.
- Hatched Patterns for forecasts.
- Outlined Formatting for plans and prior year data.
These clear visual cues make it easy to distinguish data points, enabling faster and more informed decision-making. Whether tracking monthly progress or assessing cumulative annual performance, this feature ensures your analyses remain precise, dynamic, and actionable.
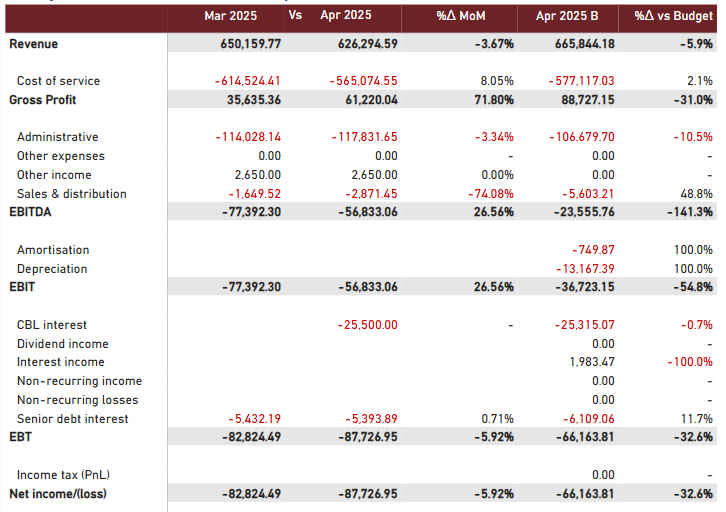
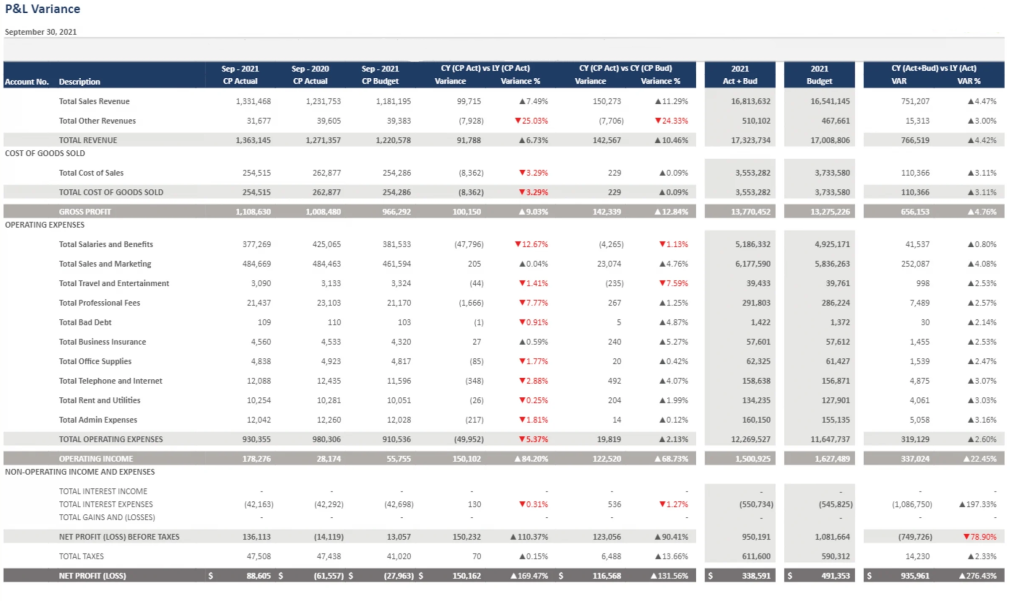
7. P&L Variance Reporting
Let’s Viz’s versatile template for Profit and Loss (P&L) Variance Reporting allows users to visualize calculation schemes directly within rows, accompanied by variances and footnotes. This design is particularly valuable for financial statements like P&L and cash flow statements, where detailed insights into deviations are critical.
Key features include:
- Sign Inversion for Revenue/Expense Accounts: Adjust the display of revenue and expense accounts with ease. By selecting a line item and choosing the ‘Invert Sign’ option, you can ensure that the presentation aligns with your reporting standards.
- Customizable +/- Signs: Control how positive and negative values are displayed, with the flexibility to show or hide signs as needed.
- Influence Total Option: Define whether sign inversion affects only the display or extends to aggregations and totals, offering complete control over how data is calculated and presented.
These features streamline the process of creating comprehensive variance reports, making it easier to interpret financial results, identify trends, and communicate key insights effectively.
8. Annual Budgeting
We simplify the annual budgeting process by combining automation with user-friendly customization. Start by allocating budgets based on prior year actuals, leveraging historical data as a foundation. From there, make precise adjustments directly within the table for a fully tailored budget.
Additional collaborative features include:
- Cell Editing: Modify data at the cell level to reflect unique scenarios or changes in priorities.
- Adding Notes and Comments: Provide context, clarification, or collaborative feedback directly within the budget. Whether explaining adjustments or inviting team input, these annotations facilitate transparent communication and teamwork.
We transform the traditionally tedious process of annual budgeting into an efficient, collaborative, and highly accurate exercise. By offering both automation and flexibility, it ensures that your budgeting aligns seamlessly with organizational goals.
Frequently Asked Questions :
Our financial modeling templates are designed to make creating professional, well-structured financial reports in Power BI a breeze. They help reduce time and effort while providing advanced formatting options that meet the specific demands of financial professionals.
Our Monthly Revenue Tracker makes it simple to monitor both actual and forecasted revenue. With features like color-coded visual cues, vertical headers, manual data entry, and forecasting tools, it ensures a comprehensive and intuitive view of revenue trends.
We provide an Operating Profit Model that delivers detailed account hierarchies, variance analysis, support for unbalanced hierarchies, and scale bands. This interactive interface makes it easy to interpret metrics and explore data with clarity.
Our Income Statement template is packed with features like multi-line headers, indented row headers, currency symbols, and drag-and-drop row sorting. These tools help you create highly customized, professional reports with ease.
We’ve designed our P&L Variance Reporting template with features like sign inversion for revenue/expense accounts, customizable +/- signs, and the Influence Total option. These tools make it easy to analyze variances and deliver clear financial insights.
Our Annual Budgeting template simplifies the entire process. You can start by using historical data for initial allocations, make adjustments directly in the table, and collaborate through built-in notes and comments. This makes budgeting more accurate, efficient, and team-friendly.
Check out other helpful Power BI Blogs
- What are the different types of Data Analysis?
- Choosing the Right BI tool – Follow these major guidelines
- Mastering Financial Statements in Power BI: A Step-by-Step Guide
- Financial Dashboard Examples for Better Decision-Making
- How to Format a Power BI visualization
- The Ultimate Guide to Tableau Business Dashboards: Templates, Key KPIs, and Examples
- How to build Dynamic X and Y Axis in Power BI Using Parameters?

If you are looking forward to getting your data pipeline built and setting up the dashboard for business intelligence, book a call now from here.